By Daniel
WallStreet.io contributor and analyst. Author of upcoming book on market volatility.
WallStreet.io contributor and analyst. Author of upcoming book on market volatility.
Are There Any Bullish Fireworks in AAPL's Future?
A look at this weekly chart of AAPL shows the stock currently staying within a 1-year downtrend that began this time last year (see gold diagonal line in chart.)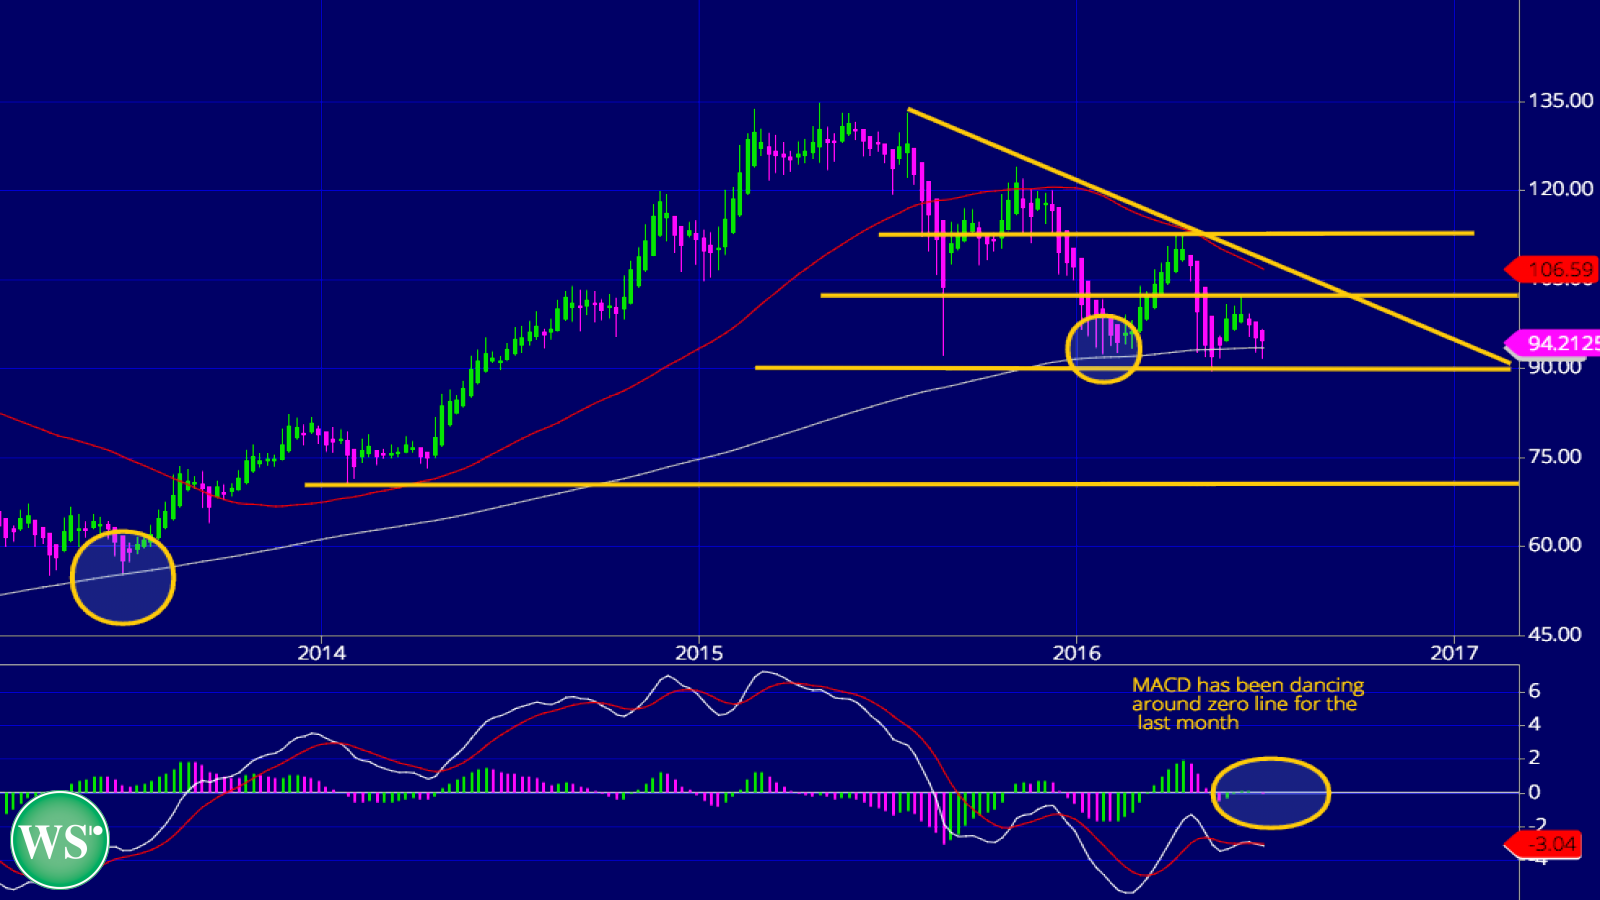
It’s a trend that looks to continue in the near future, particularly if AAPL continues to probe its 200-day MA to the downside, as it has been doing these last 3 weeks.
Even before the whole Brexit whipsaw market action, AAPL has been experiencing choppy price action for the last couple of months ,as can be seen in this weekly chart, a pattern that has emerged following the stock’s most recent earnings report back in late April.
With the low volume that typically accompanies the summer, coupled with a huge amount of uncertainty that remains as the Brexit drama continues to play out, that choppiness is likely to continue throughout the next couple of months.
AAPL ended the week at $95.90, off about 10% from the start of 2016. That’s a sharp level of under-performance compared to the major indices, with the S&P 500 Index (SPX) ending June in the black, up just under 3% while the Dow Jones Industrial Average (DJIA) is up just over 3%.
Of some concern to the bulls is how AAPL is currently trading around its weekly 200-day MA. Looking back at both mid-2013 and early 2016 (see chart’s 2 gold circles,) you can see that AAPL bounced off this MA on both occasions.
Now, however, the stock has spent 6 of the last 10 weeks either touching on, or piercing below, the 200-day MA. This sort of constant probing reveals a search for lower price action, and while the PayDayCycle bars show that the stock has managed to pull back somewhat, the recent 3-week trend reveals a continuing test of support.
So big picture, there are 2 support levels to note: The first is recent support at $89.50. The second, which dates back all the way to the start of 2014, is at $70. That represents a level that could be tested should the broader market experience a severe correction of 15-20%, a level that, speaking strictly cyclical, is becoming overdue.
For resistance, $102 remains the number, last touched on a month back. Should the market continue to ride the bullish wave of the last several trading days, it a number that could come into play. Above that, $112 is the longer term point of resistance.
The MACD for the weekly chart shows that momentum continues to be flat, as the momentum indicator continues to hover at the zero line, where it has mainly resided for the last 4 weeks.
Bottom Line: Support at $89.50 has proven robust so far this year. If the stock can get a couple of green weekly PayDayCycle bars going, gaining some bullish traction off of the 200-day MA, then investors might want to add some stock to their portfolio. For traders, a clear breach of that same MA might signal that it’s time to place a bearish mid-term bet.