Unleash the Power of Seasonality
Explore Historical Patterns Like Never Before with Wallstreet.io's Advanced Graphs
Explore Patterns

Get Educated
8000+ stocks & ETFs
120+ Indicators
< 1 second Loading Times,
Customize Your View with Ease
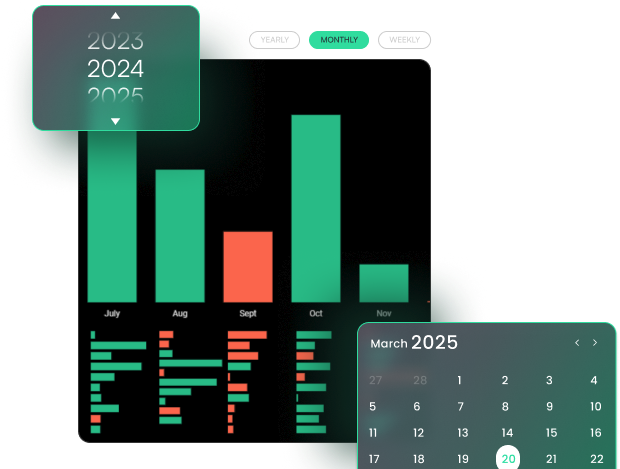
Choose from Yearly, Monthly, or Weekly Bars. Selecting Weekly even allows you to pick a specific month. It's all about giving you control.
Gain Insightful Perspectives
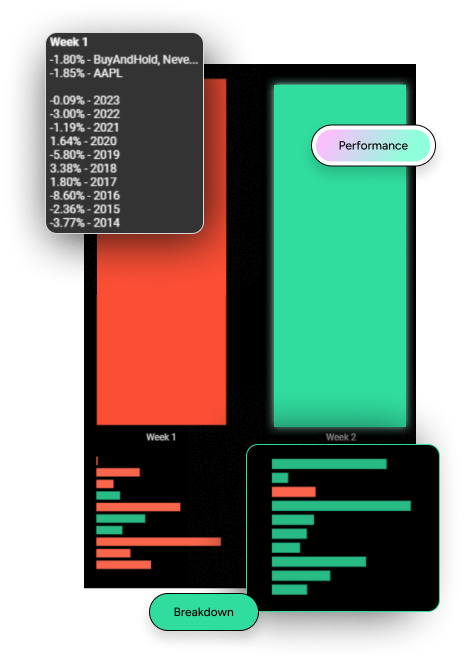
Hover over a bar to see the percentage gain of a Strategy compared to the net buy-and-hold return. See return percentages from previous years in the selected timeframe.
Adapt to Different Time Frames
Switch between 'yearly', 'monthly' or 'weekly' views to see performance over different time frames. Tailored for the needs of experienced traders.


Visualize Consistency with Intuitive Design
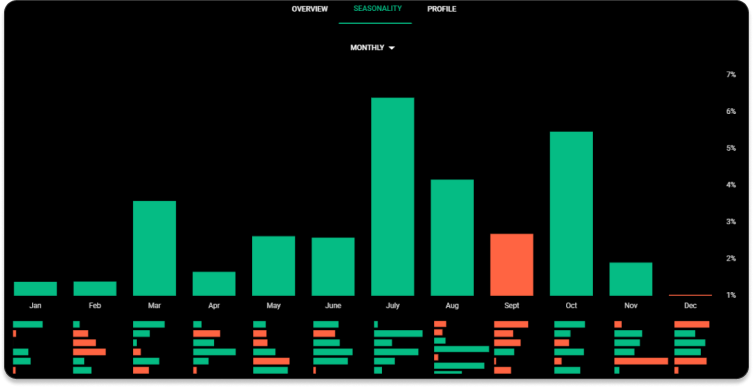
Big green and red vertical bars represent performance. Horizontal bars visually represent the breakdown, helping you grasp consistency over the years.

Ready to Explore
Seasonality Graphs?
Our Seasonality Graphs are more than a tool; they're a solution. They reflect Wallstreet.io's commitment to world-class technology and our mission to enhance trading for everyone. Ready to take your trading to the next level? Explore our Seasonality Graphs today and discover the Wallstreet.io edge.
Explore Trends
Customize View
Visualize Consistency


Like Our Graphs?
You Might Also Like These Features:
Free Live Charts
Experience Wallstreet.io's Free Live Charts, a standout feature that sets us apart from the competition. While others may charge, we provide real-time charting at no cost, allowing you to monitor market trends without the extra expense.
Learn MoreSmart Studies
Design, tweak, and test trading strategies with a blend of advanced technical Smart Studies. Create strategies by stacking Buy and Sell signals to see them in action on historical data paired with in-depth analysis.
Learn MoreEducation
Unlock your trading potential with our On-Demand Education Library. From beginner tutorials to advanced deep-dives, resources are designed to prepare you with knowledge you need. Paired with weekly Live Meetups, you'll have all the tools thrive in markets.
Learn MoreReady to Dive Into the
World of Trading?
Join us today, and elevate your day trading experience to unprecedented heights with Wallstreet.io. The market waits for no one, but with Wallstreet.io, you will always be one step ahead of the curve.
Get Started Now
