By Daniel
WallStreet.io contributor and analyst. Author of upcoming book on market volatility.
WallStreet.io contributor and analyst. Author of upcoming book on market volatility.
Does GLD Bear A Closer Look at a Downward Move?
Towards the end of June, the SPDR Gold Trust ETF (NAR:GLD) finally managed to break out of its 5-month trading range, hitting its high of the year right after the Independence Day weekend. Since then, the gold-tracking fund has given back 5% of those gains.
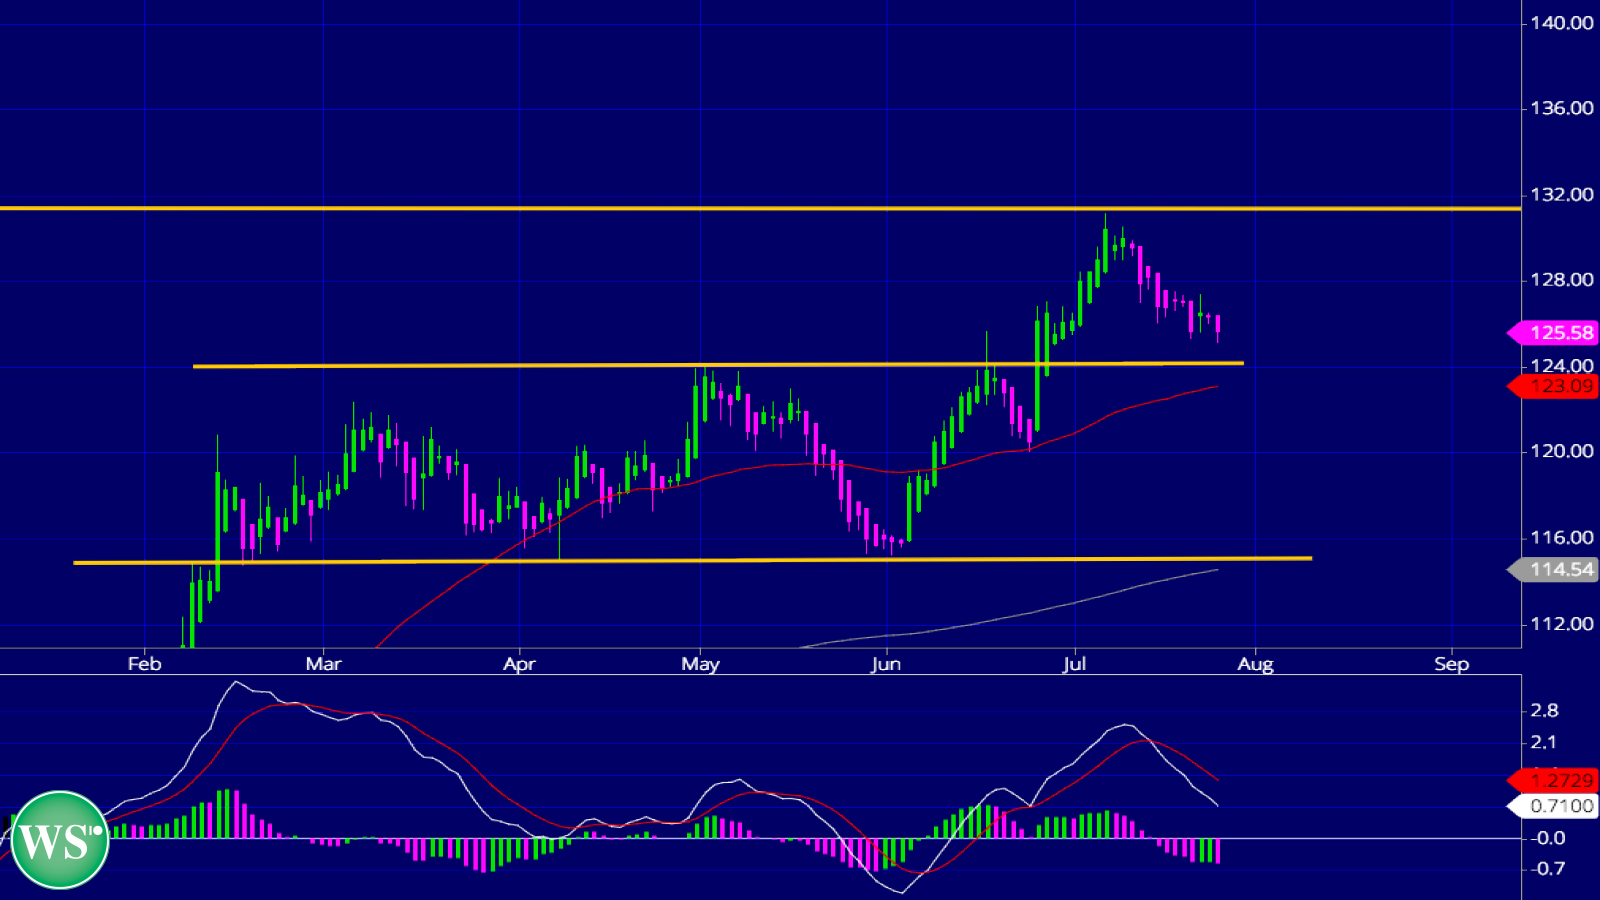
That trading range, in place for the majority of the year, was defined by support at $115 and resistance at $124. The breakout saw the ETF top out at $131.15 back in early July, but by the end of Monday’s session, GLD sat at $125.47.
So it’s a reasonable question to wonder if the ETF can find support at $124, that former resistance level. Previous resistance, after all, frequently becomes current support.
Should that level fail, its 50-day MA, a little lower at $123.09, may end up serving in that capacity for the short-term.
In spite of GLD looking like it’s about to take a bounce off that support level, we’ll still call the ETF’s Over/Under as 131.50/124, as that former level looks as though it generated a strong round of bearish price action.
The broader market is looking more than a little toppy right now, so any sharp sell-off will undoubtedly benefit gold, and therefore GLD, as the commodity attracts capital when equities are deemed too risky.
A case could be made for a swing trade off of the $124 line, should GLD retreat closer to that level. The problem with a full- throated backing of that trade lies in the MACD, which is continuing to trend bearish, with today forming a red bar. That brings the current trend to 8 days, which started at the bearish crossover on July 13.
GLD’s PayDayCycle status is -2. Today’s red bar marks a new bearish PaydayCycle.
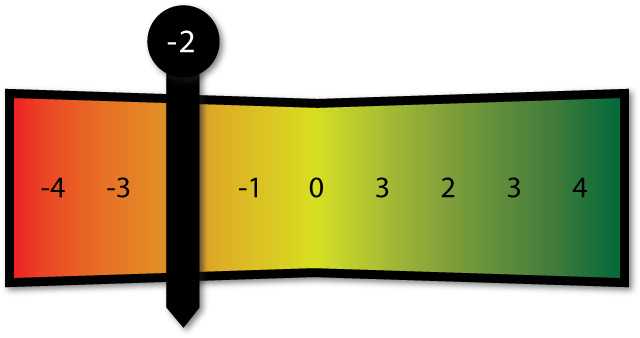
PayDayCycles are 4-8 day trends in stocks that help people swing trade. To learn more about PayDayCycles make sure to grab the free Swing Trading Class on the right sidebar.