By Micah
CEO of Wall Street io
CEO of Wall Street io
How to Backtest Your PayDayCycle Strategy
Here's this week's AAPL Video...
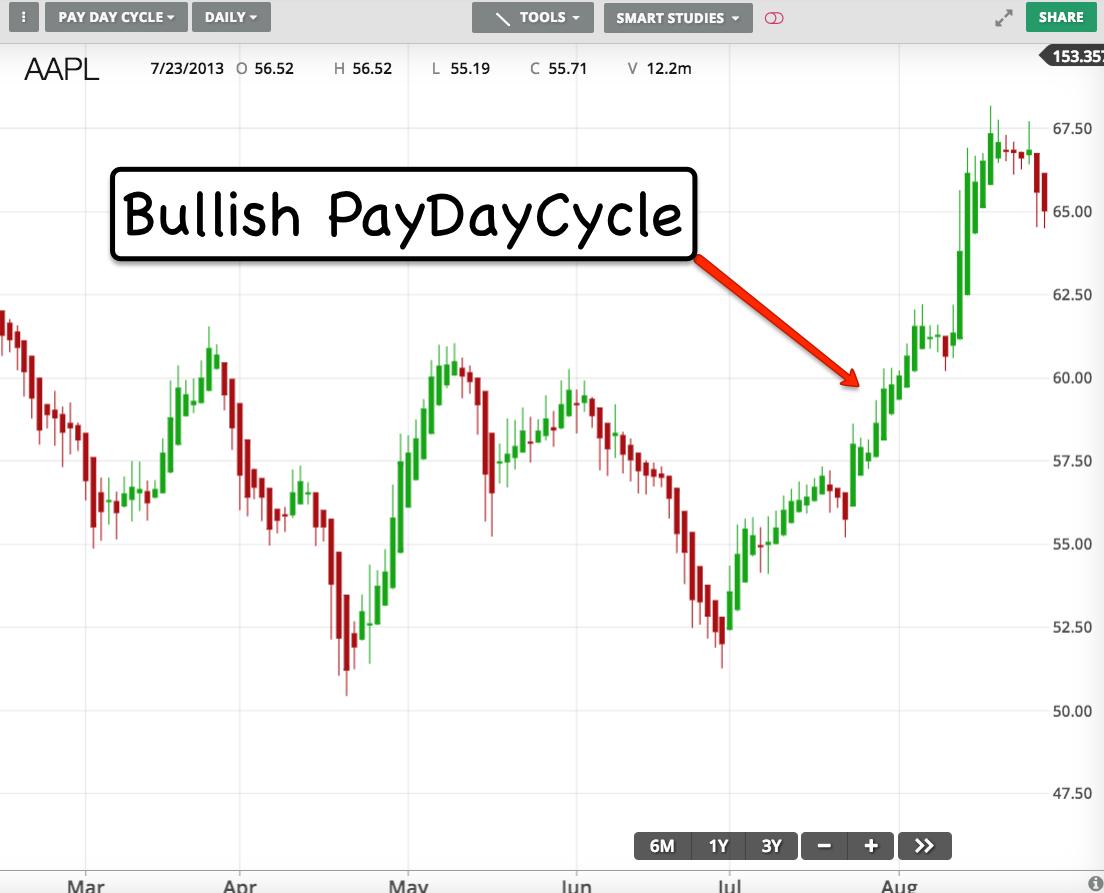
We look at AAPL getting pinned just above $155 and why that is the level to hold.
We also take a look at PayDayCycles, these are 4 to 8 day trends in a stock.
To view a PayDayCycle in WallStreet.io click on Candlesticks under the stock tab and select "PayDayCycle".
PayDayCycles can make it easier to see short term trend in a stock.
You can see from the chart above that PayDayCycles smoothen out the trend.
Backtesting PayDayCycles: WallStreet.io allows you to backtest PayDayCycles to see
Here's a Screen Shot of the backtest results from an optimized AAPL PayDayCycle Strategy.
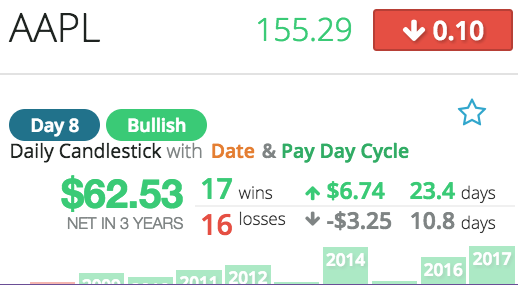
- Profitability Over Time Frame: Made $62.53 if bought and sold 1 share at entry and exit of strategy
- Batting Average: 51%
- Average Win Amount in Dollars: $6.74
- Average Loss Amount in Dollars: $3.25
- Average Days in Winning Trade: 23.4 days
- Average Days in Losing Trade: 10.8 days
- 10 Year Seasonality Snap Shot: Strategy was profitable each year from 2009 to 2017
Fine Tune When You Get in and Out
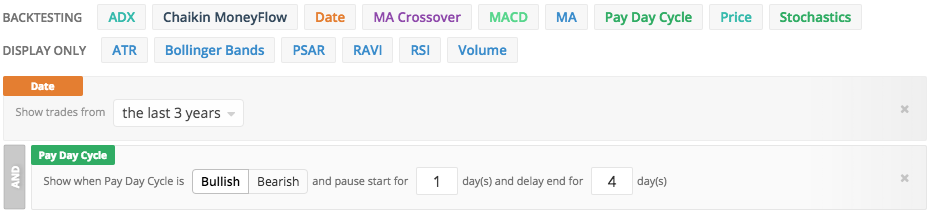
Our backtesting tool, Smart Studies, allows you can fine tune your PayDayCycle backtesting by adding one day on the entry and or the exit.
Here's a screen shot of Smart Studies with the PayDayCycle loaded. Notice I used 1 and 4 for my settings.
Making this adjustment can help get rid of false starts and shake outs.
Get a Notification
Using your WallStreet.io Portfolio you can get daily notifications letting you know when this strategy starts and stops.
Step #1 - Save the Strategy: Click on the little blue star at the top right of the strategy box and our system will send you an email letting you know when this optimized PayDayCycle strategy starts and stops.
Step #2 - Add the ticker to your Portfolio. Click on the Portfolio Tab and then the edit pencil at the top right of the page. Add the ticker and click save.
Let me know what you think about PayDayCycles below in the comments. Thanks in advance!
Trade Safe,
Micah