By WallStreet-IO
This is the official account for WallStreet I/O
This is the official account for WallStreet I/O
Is PCLN About to Trend Sideways?
Here's a 3-month chart of (NASDAQ:PCLN) showing how it is starting a sideways trend following a 30% run-up that began back on 2-10-16.
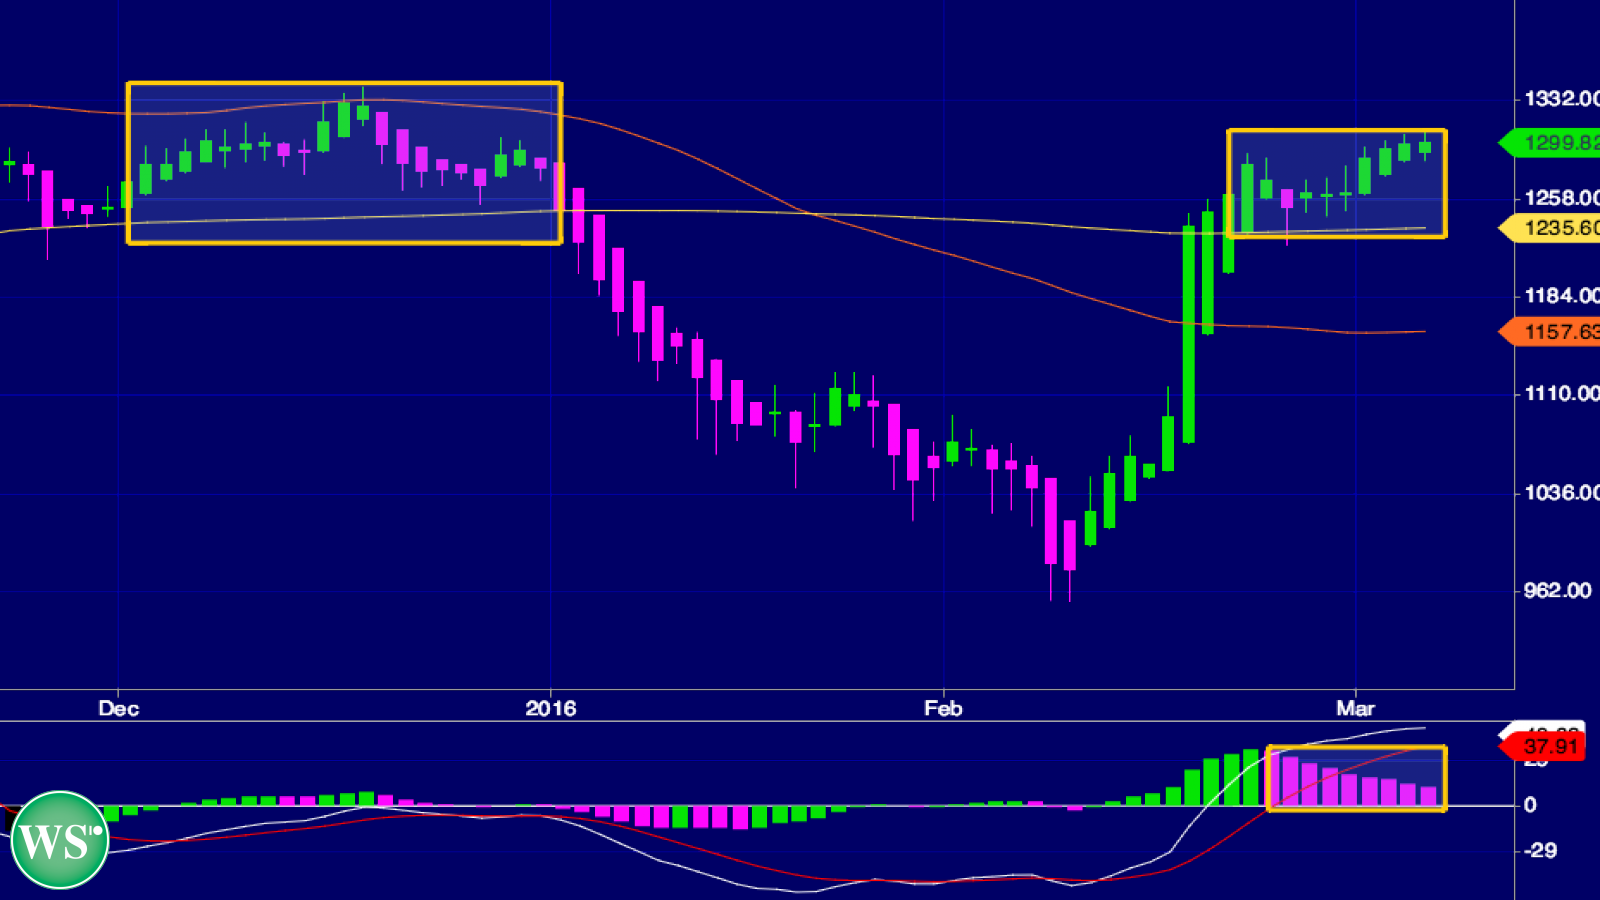
Right now I’m seeing a consolidation pattern over the last 10 trading days, with 1300 serving as resistance. That’s just below the point PCLN finished the week, after briefly topping Friday out at 1307. With the 200-day Moving Average hovering around 1235 for several weeks, that could become the new level of support for the stock. So let’s call the new over/under 1235/1307.
Worth noting is the last sideways trend for the stock, which completely filled the trading calendar back in December, as seen in the larger of the 2 boxes shown on the chart. That month-long consolidation ended with that 30% correction. The recent consolidation, which features a number of dojis, together with a shorter-than-average daily trading range, could indicate that a big move, either bullish towards the year’s highs of 1482, or back down to below 1000, may be in the works. A big range, but it’s a volatile stock.
PCLN PayDayCycle Status right now remains at +3, continuing a 4-day PayDayCycle winning streak. Based on previous PCLN winning streaks, it may be reaching the midpoint of that cycle.

PayDayCycles are 4-8 day trends in stocks that help people swing trade. To learn more about PayDayCycles make sure to grab the free Swing Trading Class on the right sidebar.
Contrary to the stock’s bullish price movement, the MACD shows an 8-day descending trend of red bars, a strong indication of bearish momentum, in spite of the fact that it still remains above the zero line.
Overall, PCLN looks like it is heading into a period of compression, with the stock trading in a tighter range, and the MACD trending bearish.