By Daniel
WallStreet.io contributor and analyst. Author of upcoming book on market volatility.
WallStreet.io contributor and analyst. Author of upcoming book on market volatility.
Will Amazon Make Good On A Delivery to the Bulls?
Taking a look at this 3-month chart of Amazon, (NASDAQ:AMZN) we can see how the second tooth in the FANG tech-stock grouping has resumed the bullish trajectory that was established at the start of February (see the chart’s gold diagonal line.)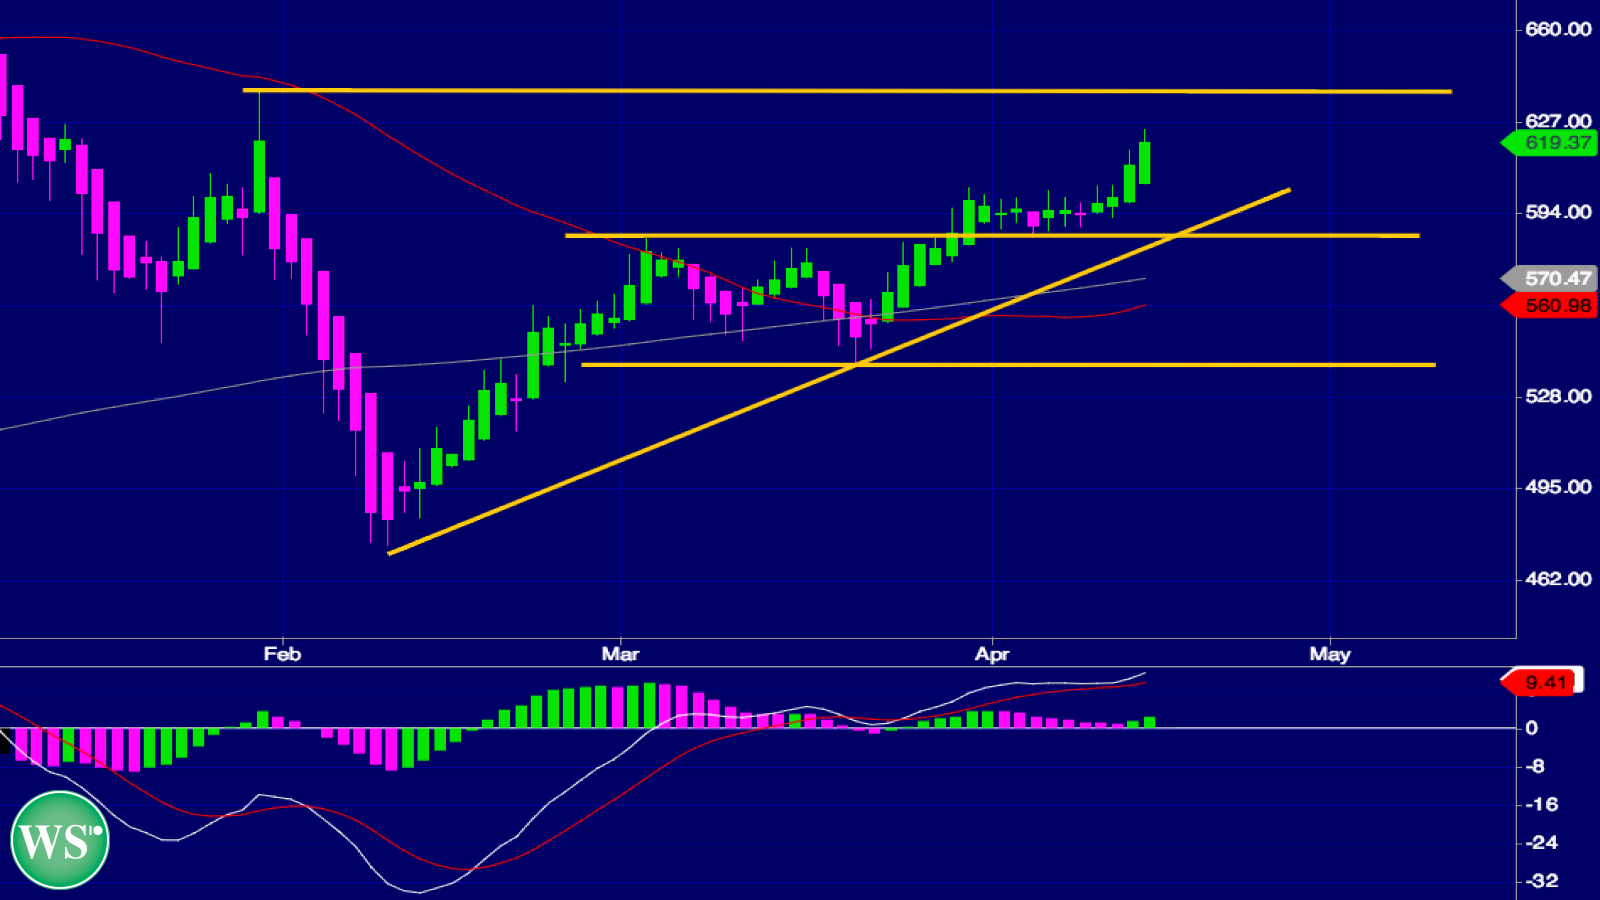
After spending the entire first week of March tightly bouncing off the current support line of $588 in a string of dojis, AMZN has now regained some bullish mojo over the last 4 trading sessions. That level recently served as resistance for the stock’s sideways trend, and as is often the case, that resistance has turned now into solid support.
Support for that recent trend was at $539, which continues as longer-term support. Though that’s quite a ways down from the stock’s current level of $619.37, a bad earnings beat could find that level tested, as AMZN tends to swing big in either direction when earnings are well off the mark. Estimated date for Q1 earnings is 4/28/16.
For the over/under, we’ll go with $638 as the bullish top, with $588 as the bearish bottom.
AMZN PayDayCycle Status is at +3, as today’s high ended well above the previous day’s high. That makes it 4 days running of green bars, establishing a bullish PayDay Cycle. This cycle follows a string of dojis, a strong signal of consolidation that often is followed by a strong movement in either direction.

PayDayCycles are 4-8 day trends in stocks that help people swing trade. To learn more about PayDayCycles make sure to grab the free Swing Trading Class on the right sidebar.
The MACD is in the 2nd day of green bars, which follows a recent run of bearish momentum. All the bars remain above the zero line, but the MACD isn’t really showing a strong trend at the moment, a factor that could indicate more sideways action in the near future.
Overall, AMZN looks as if it is ready to test its next level of resistance. Swing traders might want to consider if the possible 3% ride to that point poses sufficient risk-to-reward to warrant the trade.