Unlock Your Trading Potential
Discover Wallstreet.io's Comprehensive Education Roadmap
Get Educated Now

Get Educated
8000+ stocks & ETFs
120+ Indicators
< 1 second Loading Times,
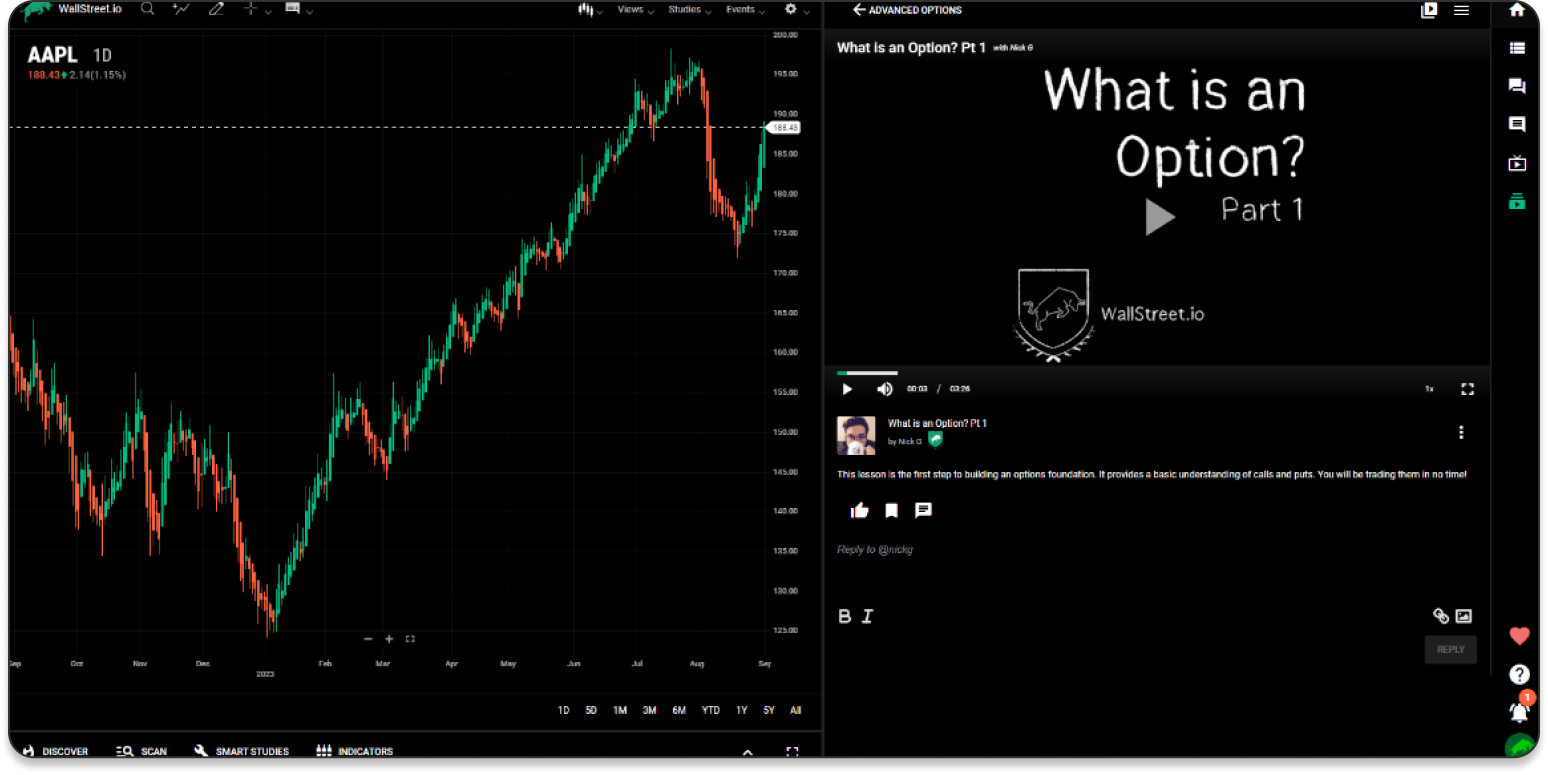
Essential Video Library
Your Gateway to Trading Mastery. Quick guides, success stories, and insights into popular technical indicators, all included in our free Essential plan.
Premium Video Libraries
Take Your Trading to the next level with the following courses:
Stocks - Beginner and Advanced Options - Day Trading - Portfolio Growth - PayDay Cycles
Trade Confidently
Our mission is to provide the tools, insights, and community support to help you achieve profitability, performance, and success.


Our Dedication to Community
Tailored Learning, World-Class Instructors, Cutting-Edge Technology, and Community Support. Empowering you to trade confidently.

Ready to Trade?
Ready to take the next step in your trading journey? Explore our Essential and Premium video libraries today and unlock the trader in you.
Tailored Learning
Word-Class Instructors
Cutting-Edge Technology


Enjoy our Education Roadmap?
You Might Also Like These Features:
Smart Studies
Design, tweak, and test trading strategies with a blend of advanced technical Smart Studies. Create strategies by stacking Buy and Sell signals to see them in action on historical data paired with in-depth analysis.
Learn MoreSeasonality
Unearth a symbol's historical behavior across years, months, or weeks with our Seasonality graphs. Easily customize views and dive into return percentages with a simple hover. It'll be your key to unlocking insights from the past.
Learn MoreCommunities
Engage, learn, and grow with our Communities. Our Community Wall and Chatrooms offer a space for everyone to share insights, ask questions, and collaborate on strategies. It's not just about trading; it's about being part of a community that empowers you.
Learn MoreReady to Dive Into the
World of Trading?
Join us today, and elevate your day trading experience to unprecedented heights with Wallstreet.io. The market waits for no one, but with Wallstreet.io, you will always be one step ahead of the curve.
Get Started Now
