
 Discover Tab Reference Guide
 Discover Tab How-To Guide
 Smart Studies How-To Guide
 Smart Studies Reference Guide
 Scan Tab Reference Guide
 Scan Tab How-To Guide
 Watchlists How-To guide
 Watchlists Reference Guide
 Chatrooms Reference Guide
 Community Wall How-To Guide
 Community Wall Reference Guide
 Streams Reference Guide
 Streams How-To Guide
Accumulative Swing Index
Definition
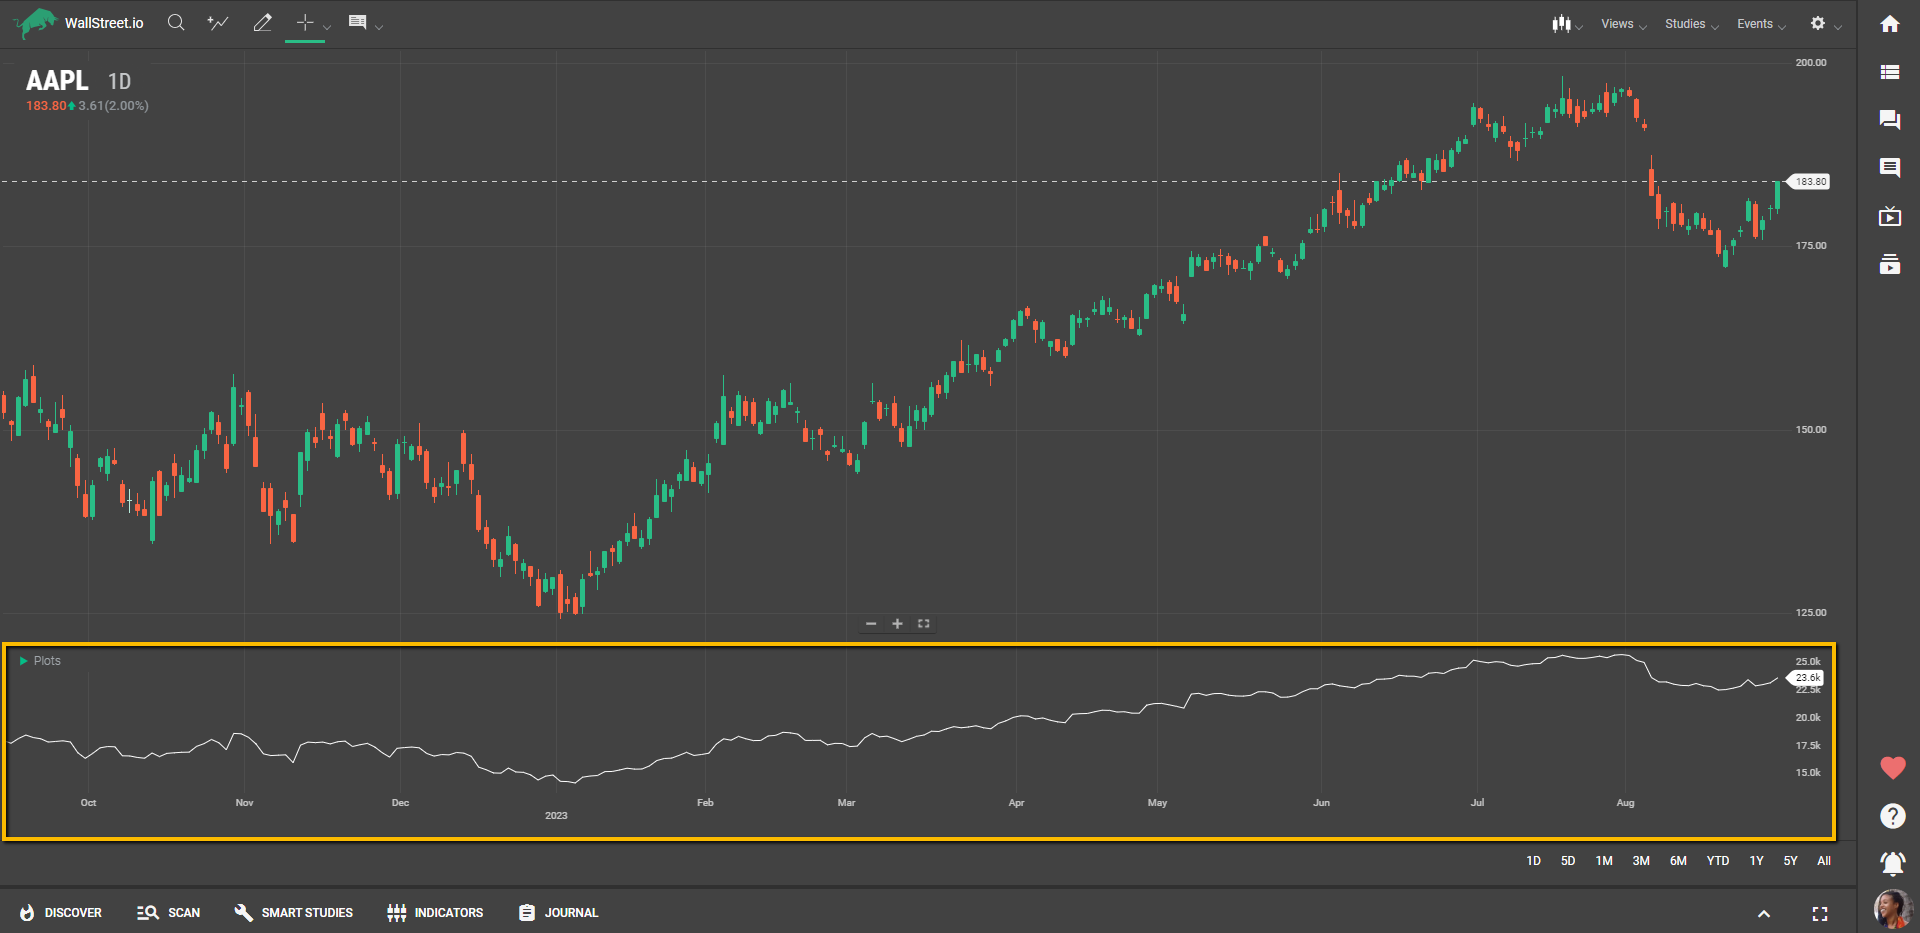
The Accumulative Swing Index is a technical indicator that provides a cumulative total of the Swing Index, which measures short-term price swings. Essentially, the ASI adds up these swings to create a line that can oscillate above and below zero, offering a broader view of market trends. The ASI is particularly useful for capturing the "real" trend of an asset by accounting for both its magnitude and characteristics over time.
Suggested Trading Use
Traders can use the Accumulative Swing Index to identify general trends and potential reversal points. When the ASI line moves above zero, it often signifies an overall bullish trend, making it a potential time to consider entering a long position. Conversely, when the ASI line moves below zero, it may indicate a bearish trend, suggesting it could be a time to consider a short position or exiting a long one.
The ASI is also effective in spotting divergence with the underlying asset's price. For example, if the asset is making new highs but the ASI fails to do so, it could signal that the trend is losing strength and a reversal might be forthcoming.
The Accumulative Swing Index is a versatile tool that goes beyond simple price action to give traders a more comprehensive understanding of market behavior. It can be particularly useful for those who want to capture the nuanced ebb and flow of market trends.