Smart Studies Reference Guide
Smart Studies is an advanced backtesting system for creating, tweaking, and testing customized trading strategies.
By leveraging a wide variety of technical studies and designing complex trading signals, users can test their strategies based on historical data to make informed trading decisions. This document provides an in-depth look at how to configure and operate the Smart Studies System.
Studies
Studies are the essential components of our Smart Studies system. They are based on specific methods of technical analysis, such as Moving Average Convergence Divergence (MACD) or Relative Strength Index (RSI) and many more. Users can select one or more Studies when creating their strategies:
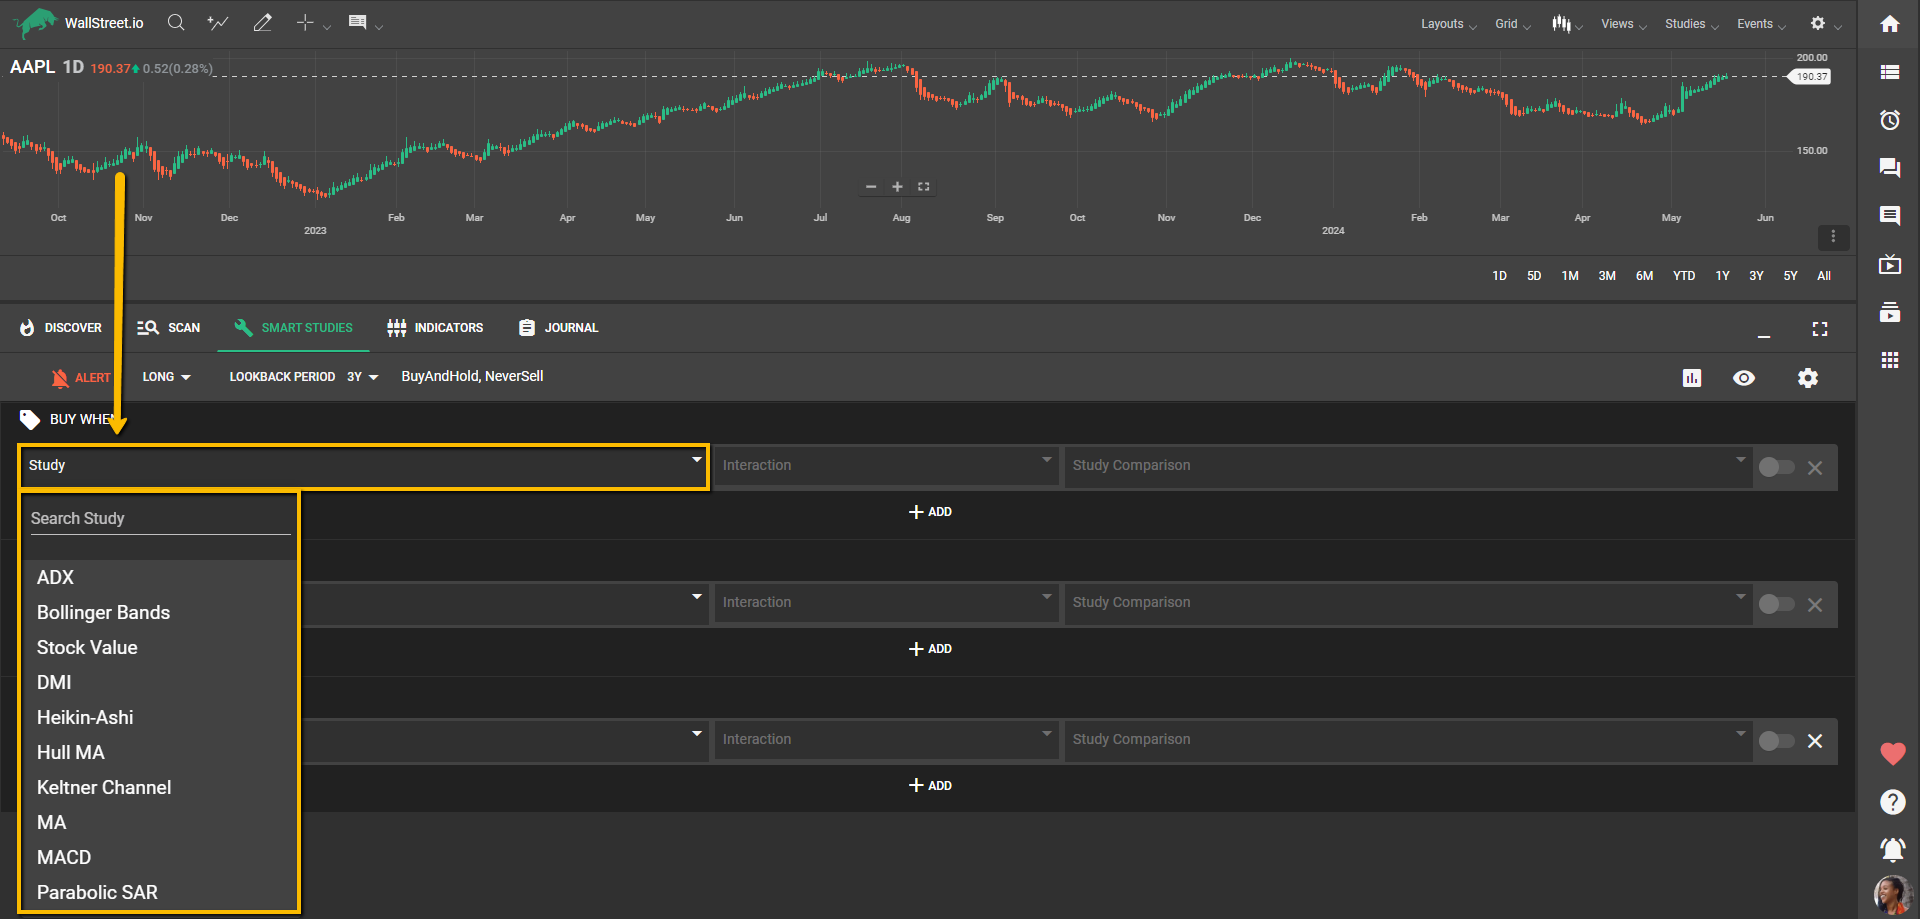
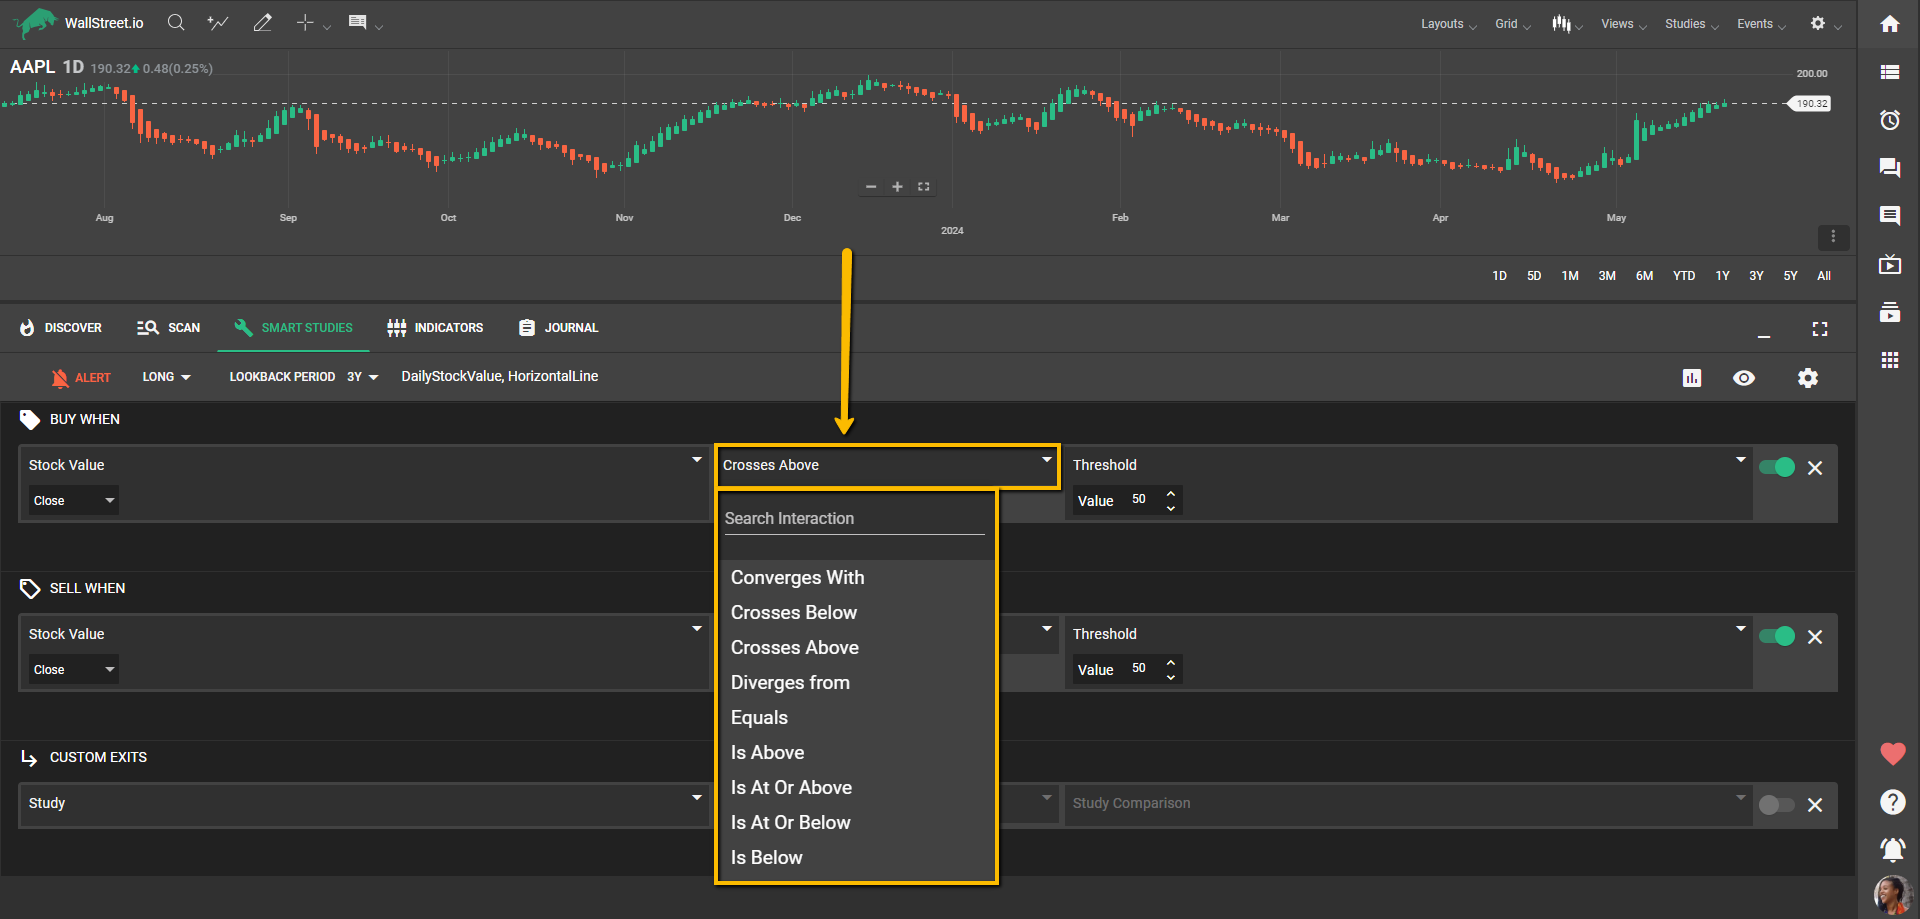
Further customization of a study can be done by specifying a comparison line and defining the interaction between the study line and the comparison line. This can take various forms, such as specifying that the RSI crosses above a certain threshold or that the 14-day RSI stays above the 21-RSI threshold line.
Here’s the list of the Studies available to test under the Smart Studies tab. Click on any of them to learn more:
Interactions
Our comprehensive list of Interactions allows you to establish rules and conditions for generating trading signals or triggering specific actions within your strategies. By combining different indicators and their interactions, you’re able to create complex strategies tailored to your trading preferences and market analysis:
Signals
A Signal or condition in the Smart Studies system denotes a particular trading action and comprises one or more Studies conjoined with each other through Interactions. The three types of signals are: Buy When, Sell When, and Custom Exit.
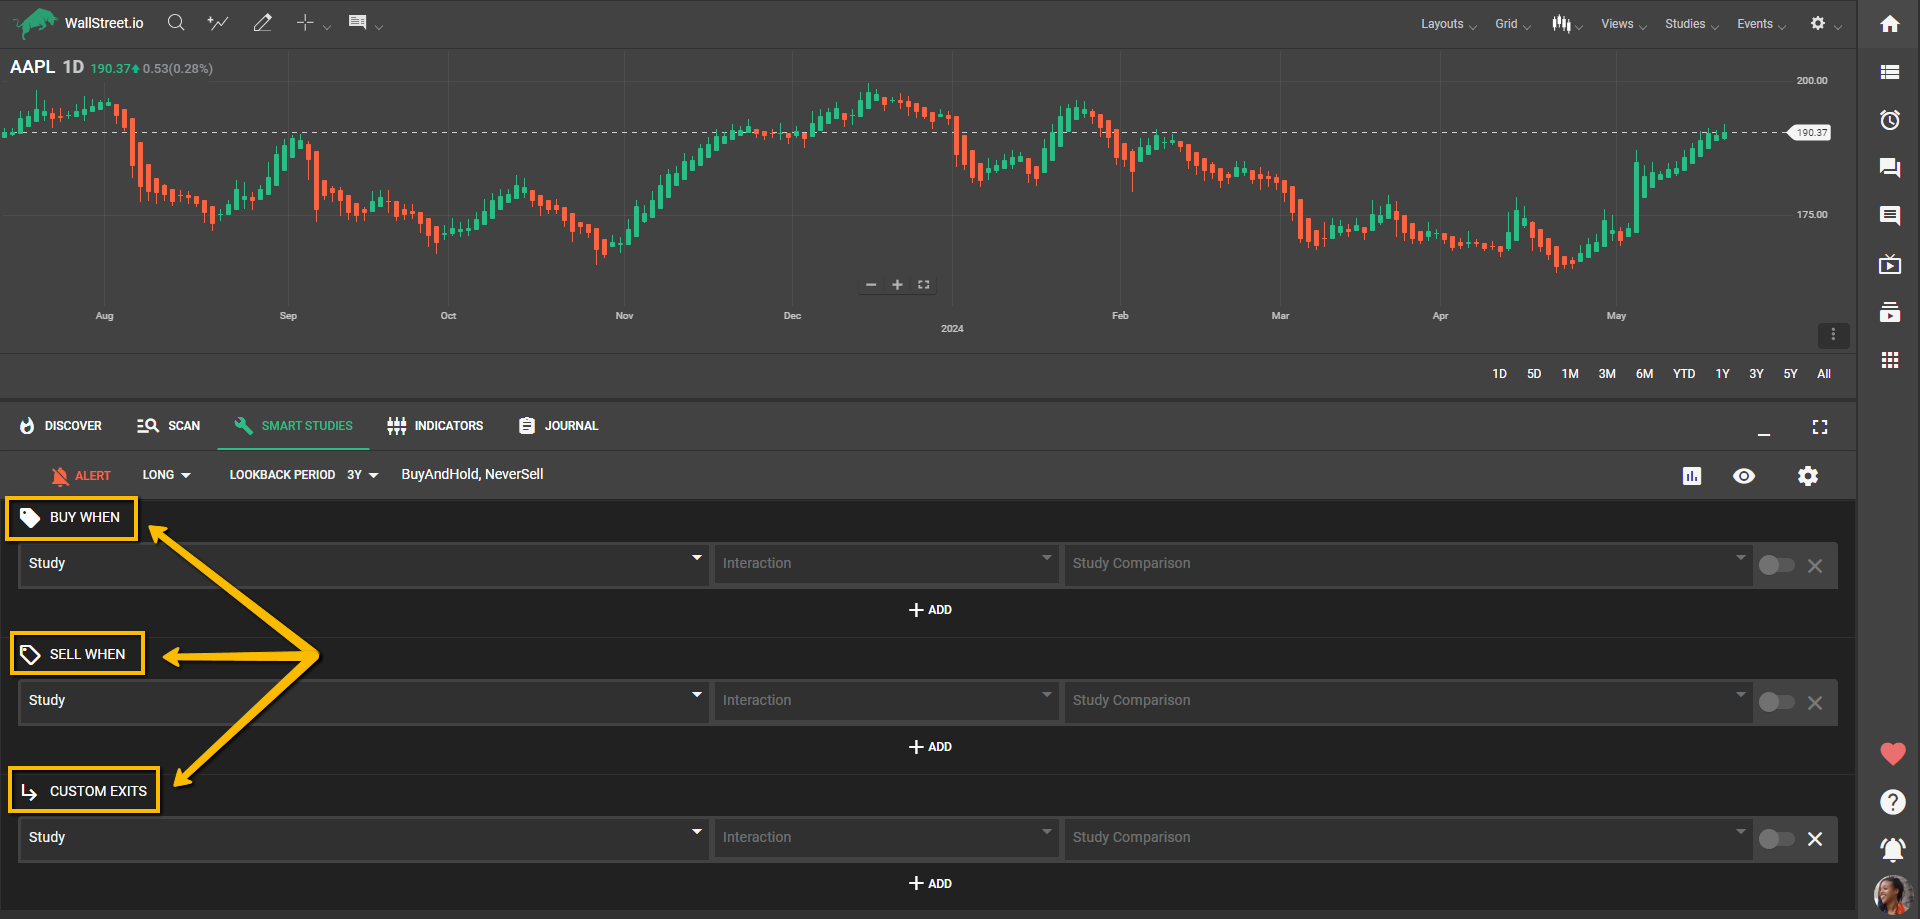
A user can create up to eight signals within one group. When a user selects multiple studies within a group, the Smart Studies System treats them as a conjunctive (AND) condition, meaning all the conditions need to be met for the overall condition to be true. Each signal of the same type is separated into different groups, which are treated as a disjunctive (OR) condition, which means if any signal within a type group becomes true, a trigger for that specific action is registered by the system.
Buy When/Sell When
On bullish/long strategies, the “Buy When” is an Entry signal, and the “Sell When” or “Custom Exit” are Exit signals.
Conversely, on bearish/short strategies, the “Sell When” is an Entry signal, and the “Buy When” or “Custom Exit” are Exit signals.
Custom Exits
Profit Target or Stop Loss
This Custom Exit type refers to predetermined price levels at which a trader aims to exit a trade to take profits. These levels are set based on factors such as technical analysis, price patterns, or desired risk-reward ratios.
Profit targets help traders lock in gains and prevent emotions from influencing their decision-making process.
Stop loss, on the other hand, is a predetermined price level at which a trader exits a trade to limit potential losses. It acts as a safety net by automatically closing the trade if the price reaches a certain level that indicates the trade is not performing as expected. Stop losses help traders control risk and protect their capital from significant drawdowns.
Trade Length
Refers to the duration of time between the entry and exit of a trade.
Trailing Stop
A trailing stop in Smart Studies tracks daily closing prices. Intraday highs or lows do not move or trigger the stop on a daily test.
For long positions, the stop trails the highest closing price since entry by a fixed percentage. The level is calculated as:
Trailing Stop Level = Highest Close Since Entry × (1 − Percent / 100)
The stop ratchets up only when a new highest close is set and does not move down while the position remains open. If a bar closes at or below the trailing stop level, the position exits on that close.
Input is a positive percentage. For example, entering 4 creates a 4 percent trail. In the rule builder, you may see this phrased as “Trailing Stop is above Value 4,” which represents the same 4 percent setting.
Example: In a daily backtest with a 4 percent trail, if the highest close since entry is 110, the stop is 110 × 0.96 = 105.6. A subsequent daily close at 105.6 or lower exits the trade.
Strategies
A Strategy is a probability model or statistical data, resulting from a combination of a set group of one or many Entry signals, and one or many Exit signals applied to the price action of a financial instrument over a period of time in the past (or Lookback Period).
To ensure valid backtesting results from our Smart Studies System, at least one Exit signal, i.e., either a Sell signal with at least one study or a Custom Exit signal, needs to be defined.
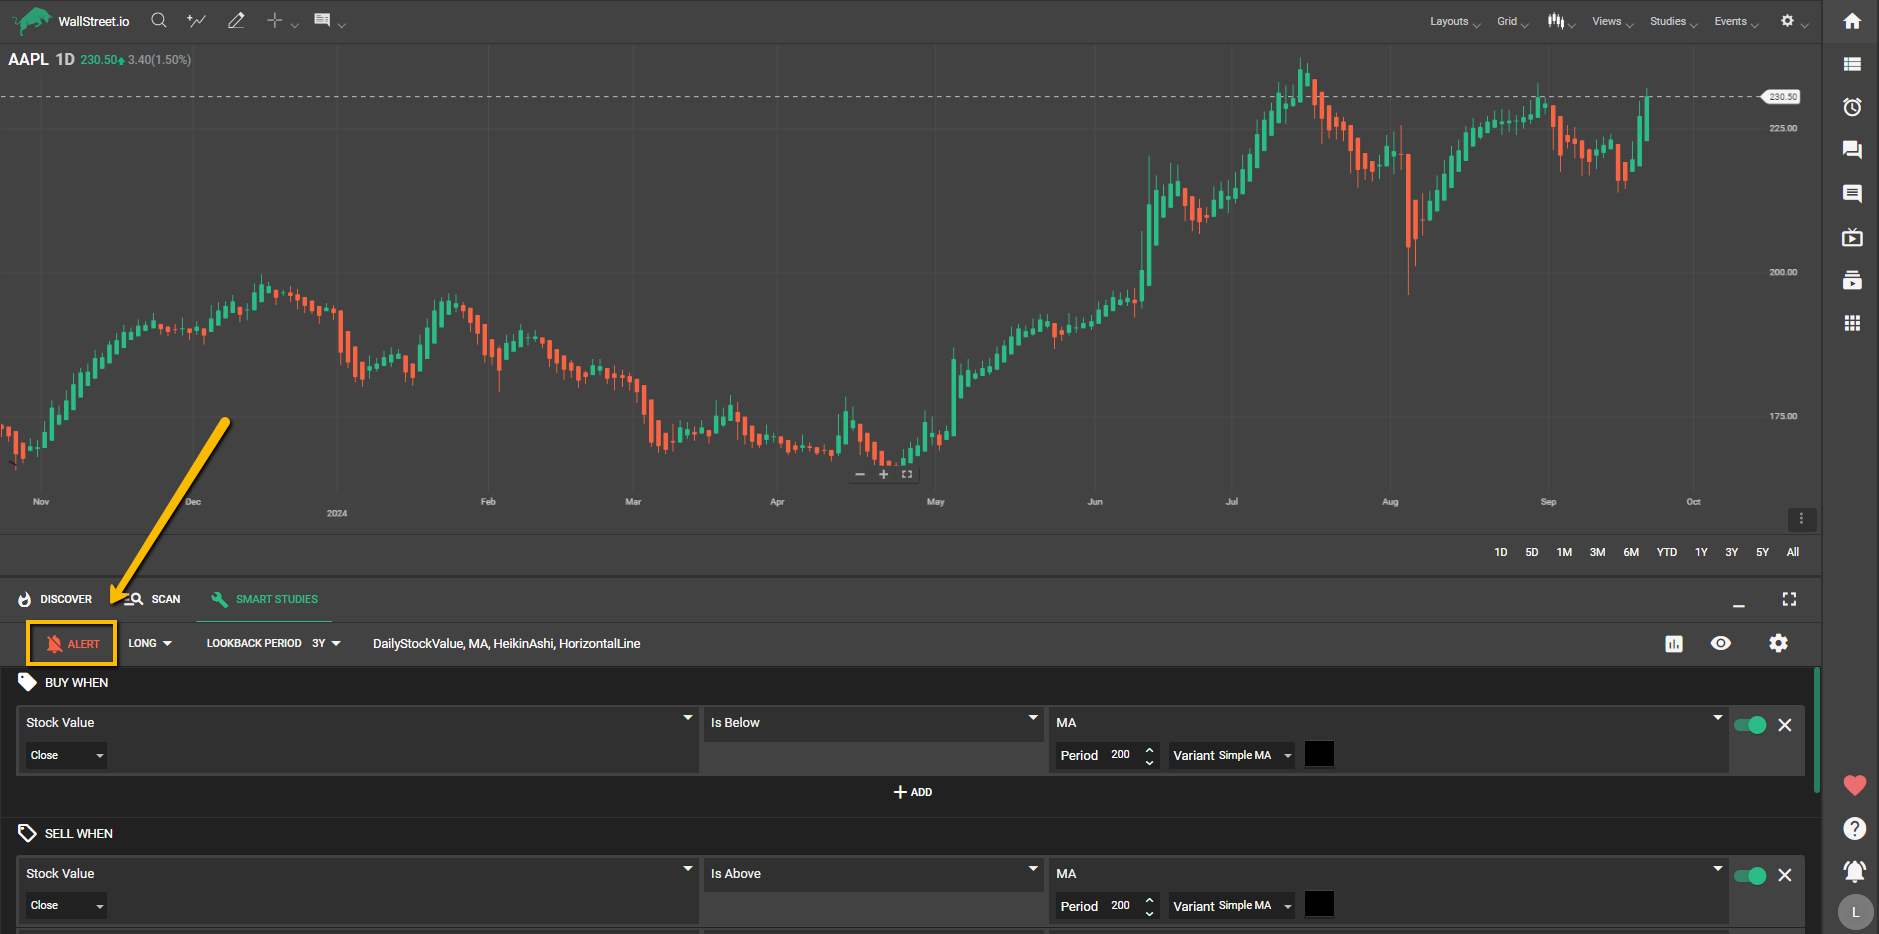
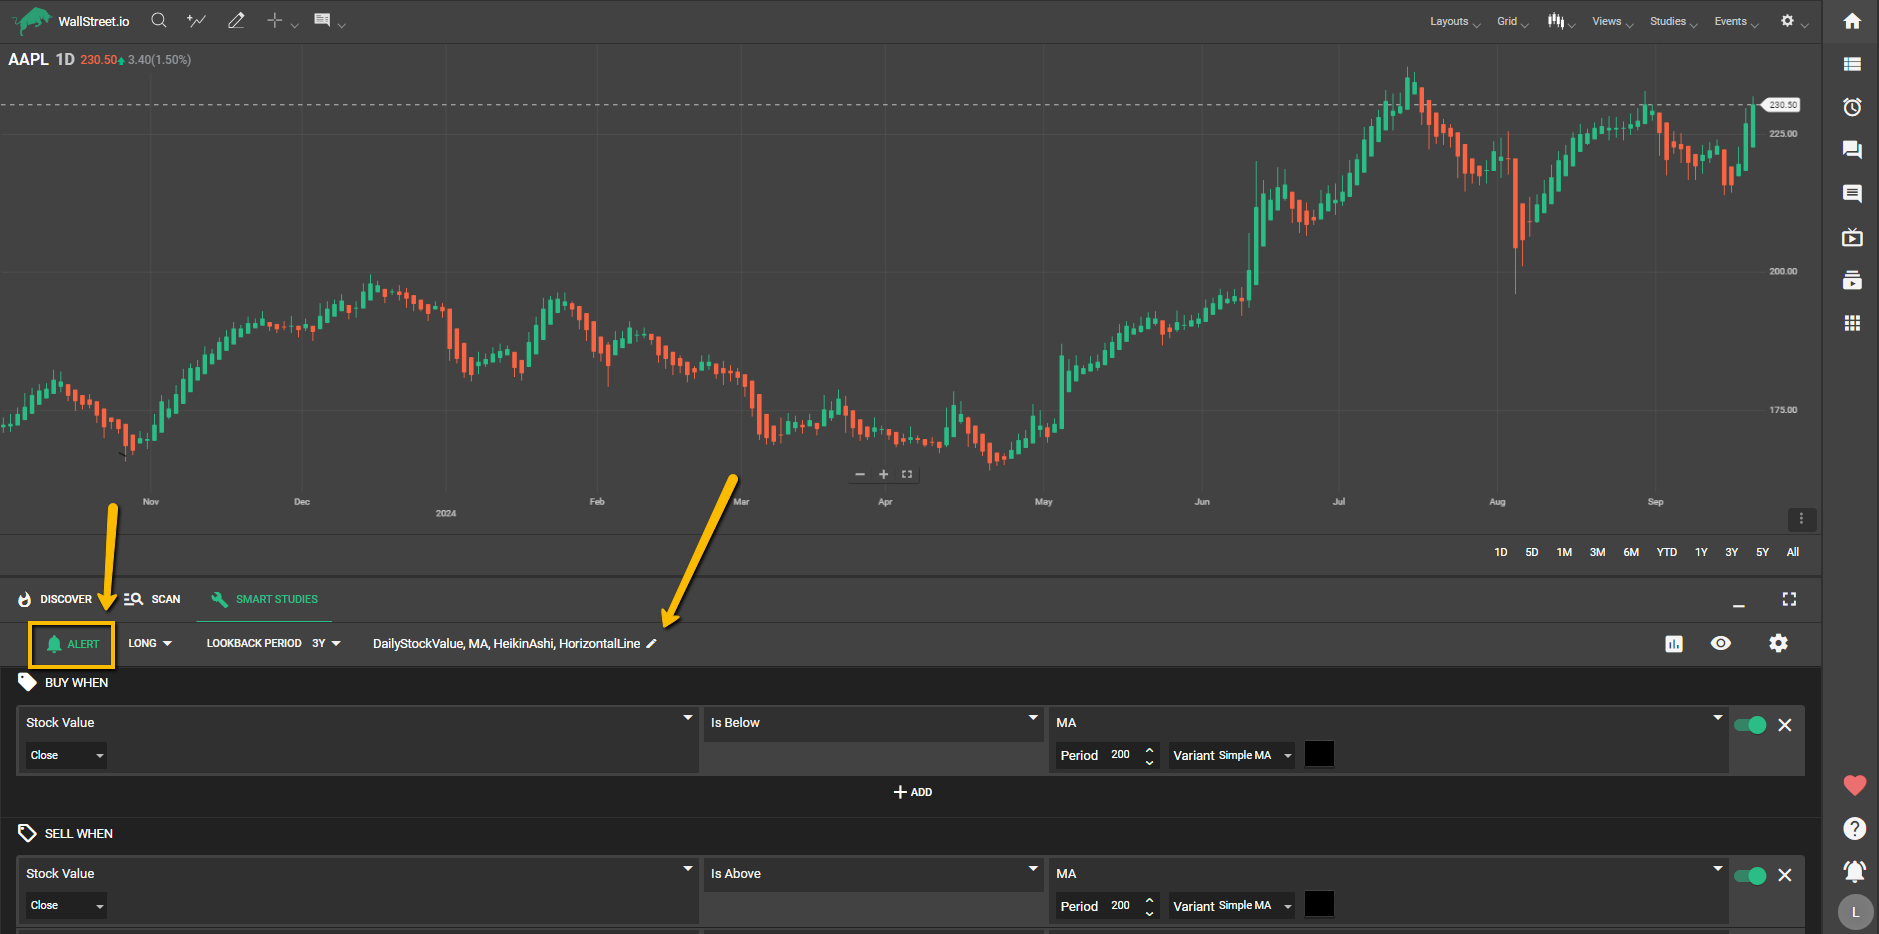
Alerts
Once you’ve configured the Strategy studies and signals and are satisfied with the backtesting results, you can set up Strategy Notification Alerts to be notified of the ongoing status of your strategy. The alert system can inform you when the strategy is starting, active, or ending. This proactive alert system is a standout feature of our Smart Studies system, keeping you informed and engaged with your chosen trading strategies.
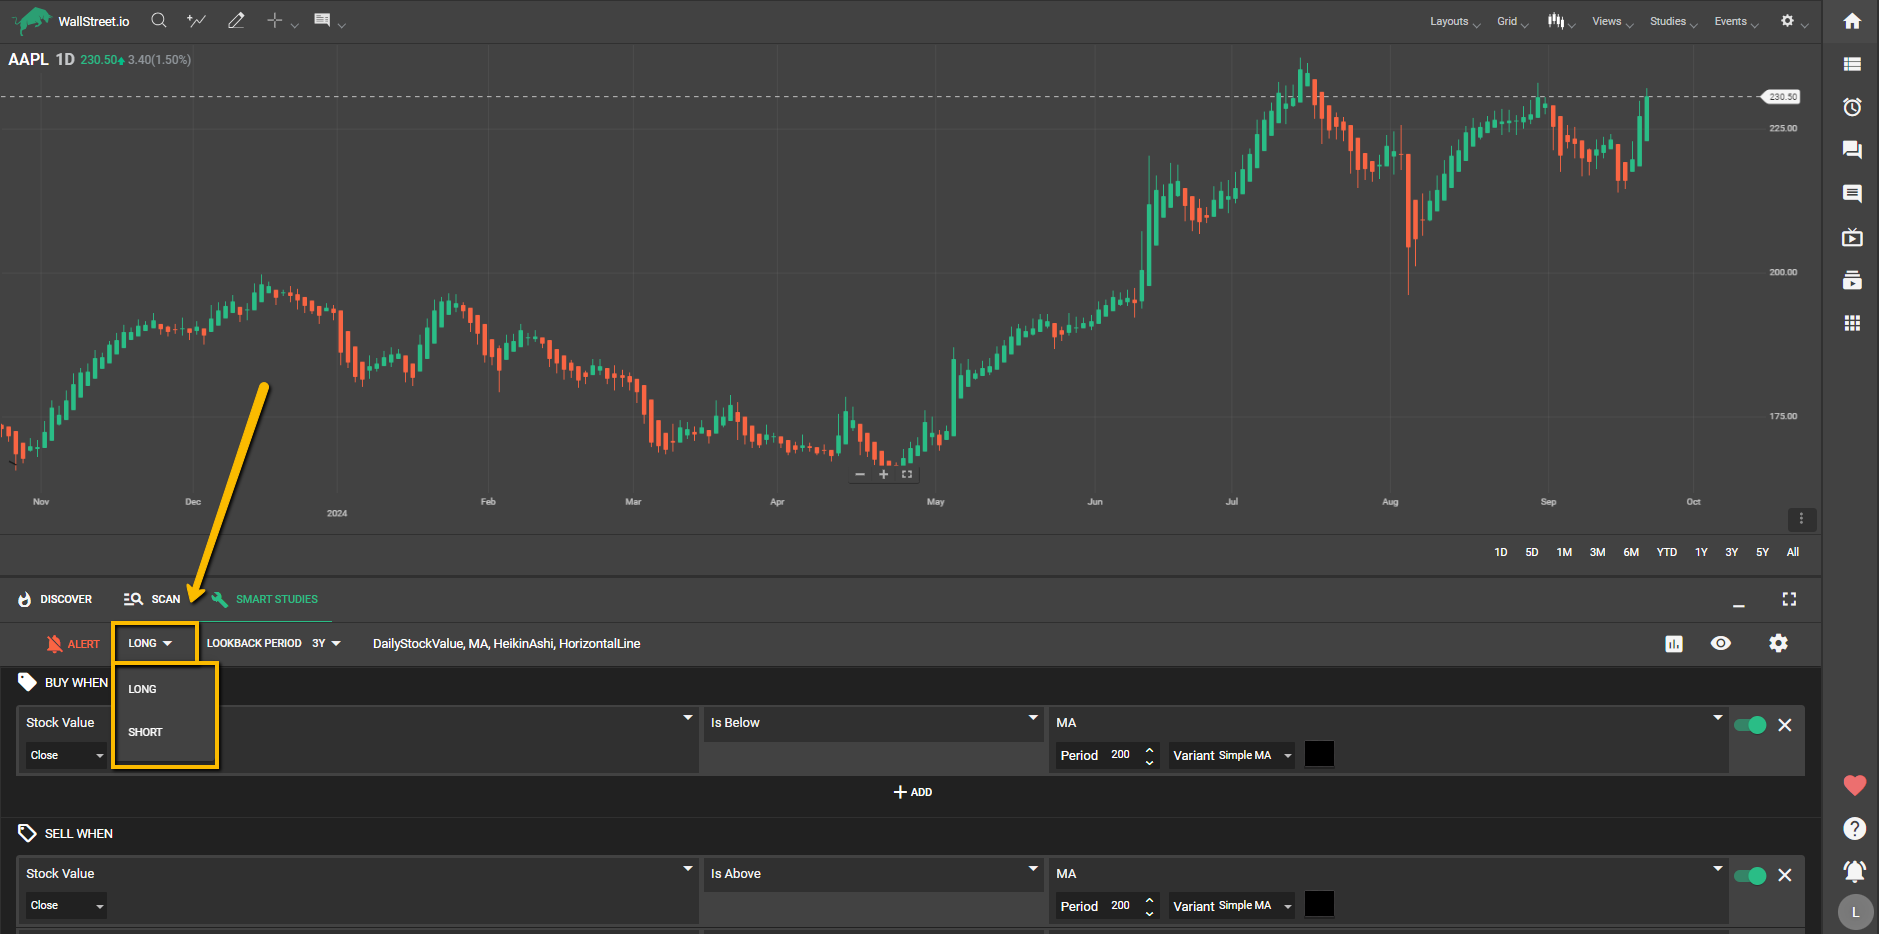
Long/Short Menu
This menu allows you to refine your search to show only Long (”bullish”) or Short (”bearish”) Strategies.
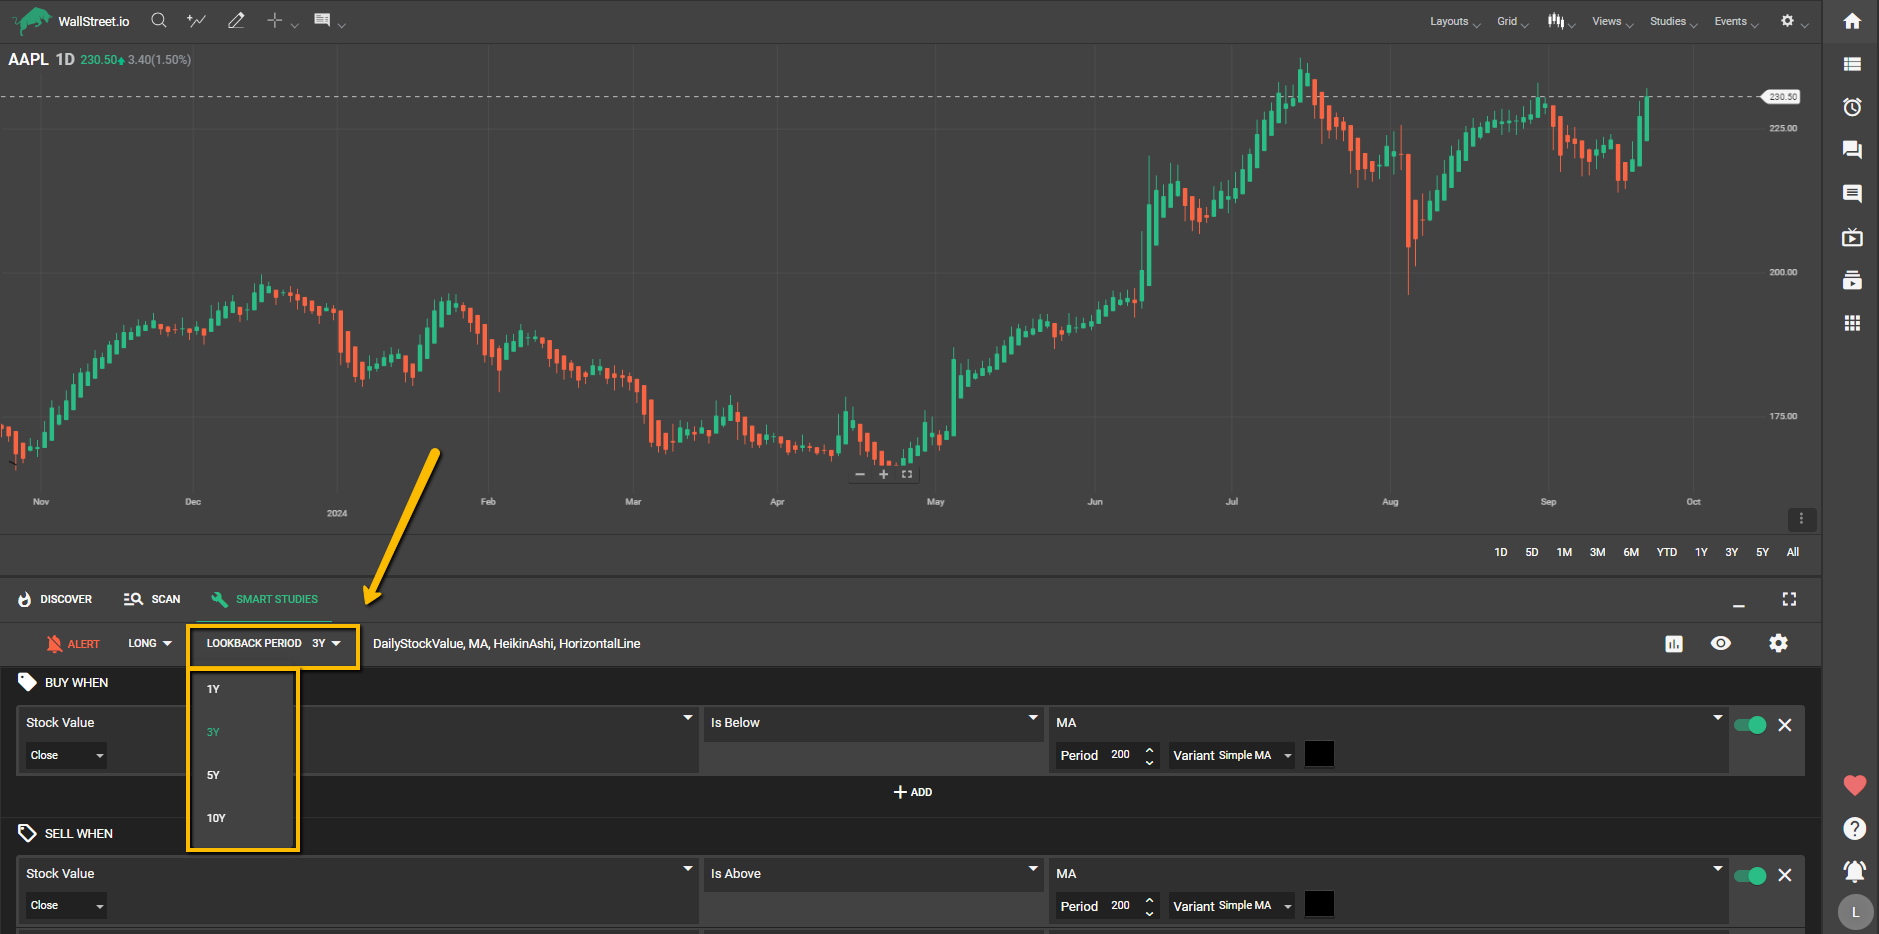
Lookback Period Menu
This menu allows you to select the Lookback Period for the results of the chosen strategy. You can choose to show results from the past 365 days (one year), the past 3 years, 5 years or 10 years.
Strategy Name
After following a strategy, you can name your strategy on our platform to differentiate it from others and easily identify it within your account. Renaming a strategy only changes its name within your account, so you can distinguish it from similar strategies you may be following. Other members will still see the original name of the strategy, which represents the indicators included in that strategy.
View Stats Panel
This panel allows you to view useful information about the selected strategy, offering an overview at a glance but also offering a deep dive into its statistics performance over time:
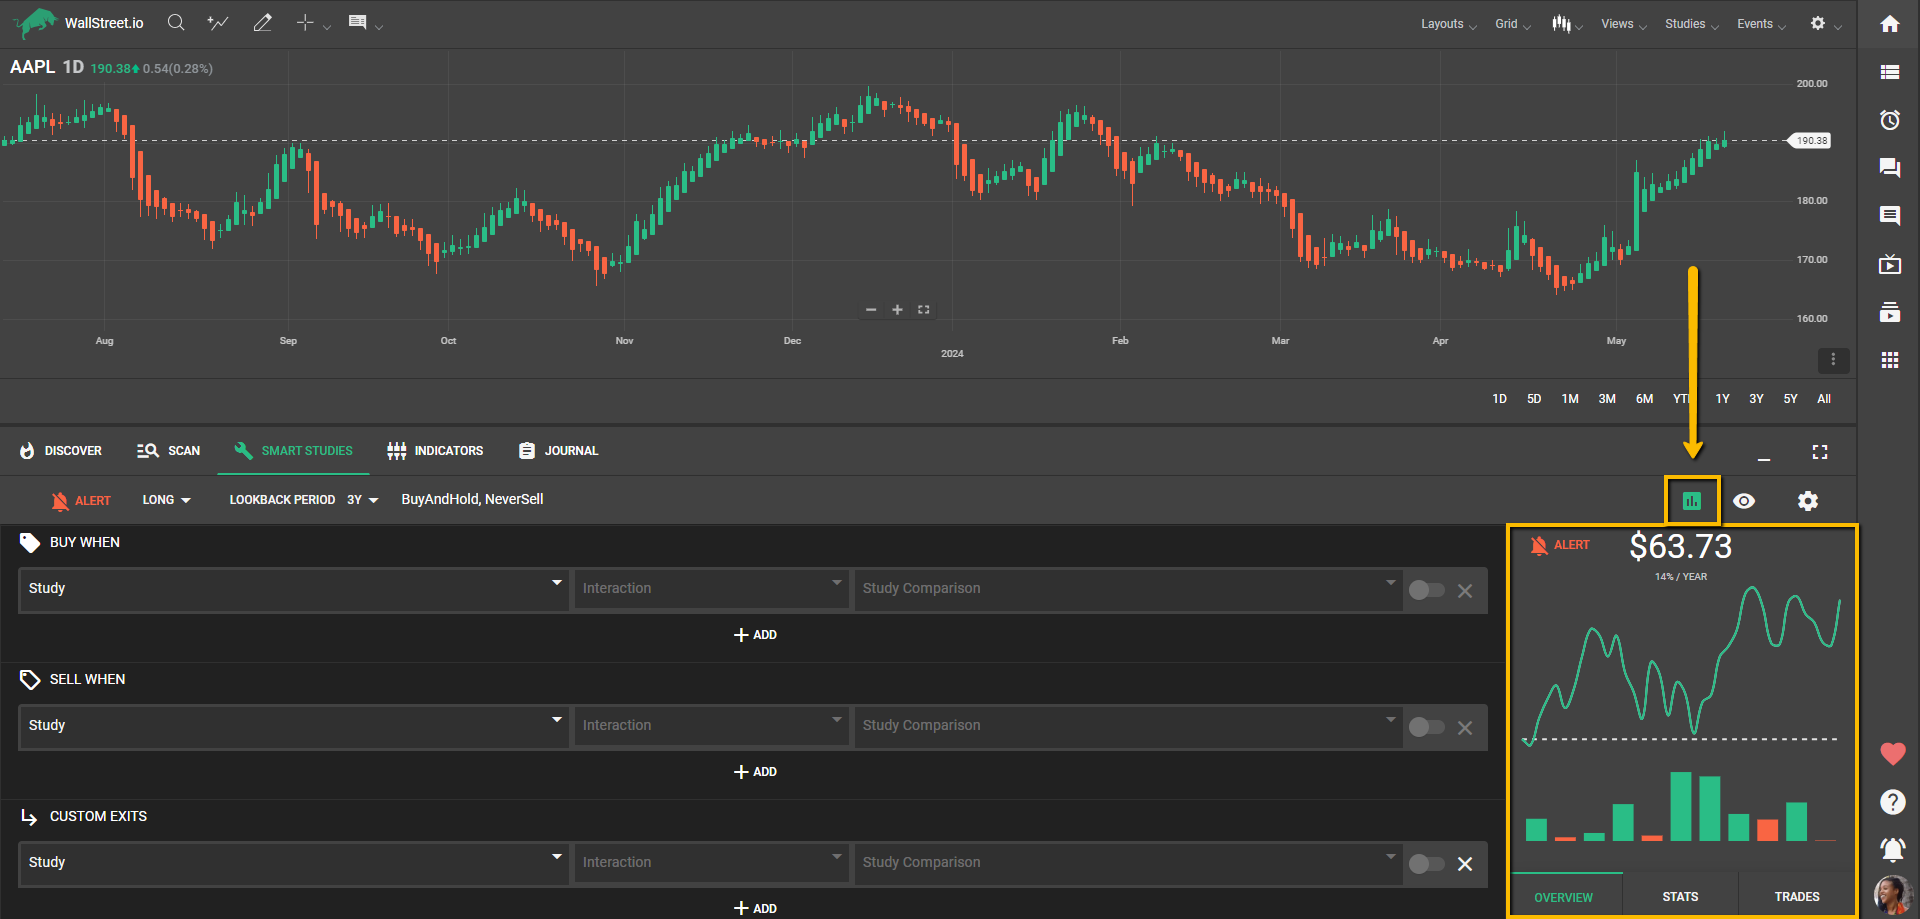
Particularly, the View Stats Panel under the Smart Studies tab will allow you to add Notes and Tags to any strategies, to help you organize and manage them.
Strategy Chart Add-Ons
Show Strategy trades
The first setting allows you to turn strategy shading on and off on the chart, in case you want to see the specific start and stop dates of a trade reflected on the chart (mainly to visualize how well a given strategy caught the desired moves). It can also be turned on and off with a shortcut by clicking Ctrl+V on your keyboard.
Show Strategy studies
The second Strategy setting allows you to show the studies from the loaded strategy on the chart (except the Heikin-Ashi candles, which will need to be manually selected from the Chart Menu Bar above the chart itself).
Show strategy profit line
With this third option, you're able to visualize a strategy profit line, which is calculated according to how much profit or losses you'd get with the strategy in comparison to the actual price action from the chart.
Smart Studies Settings
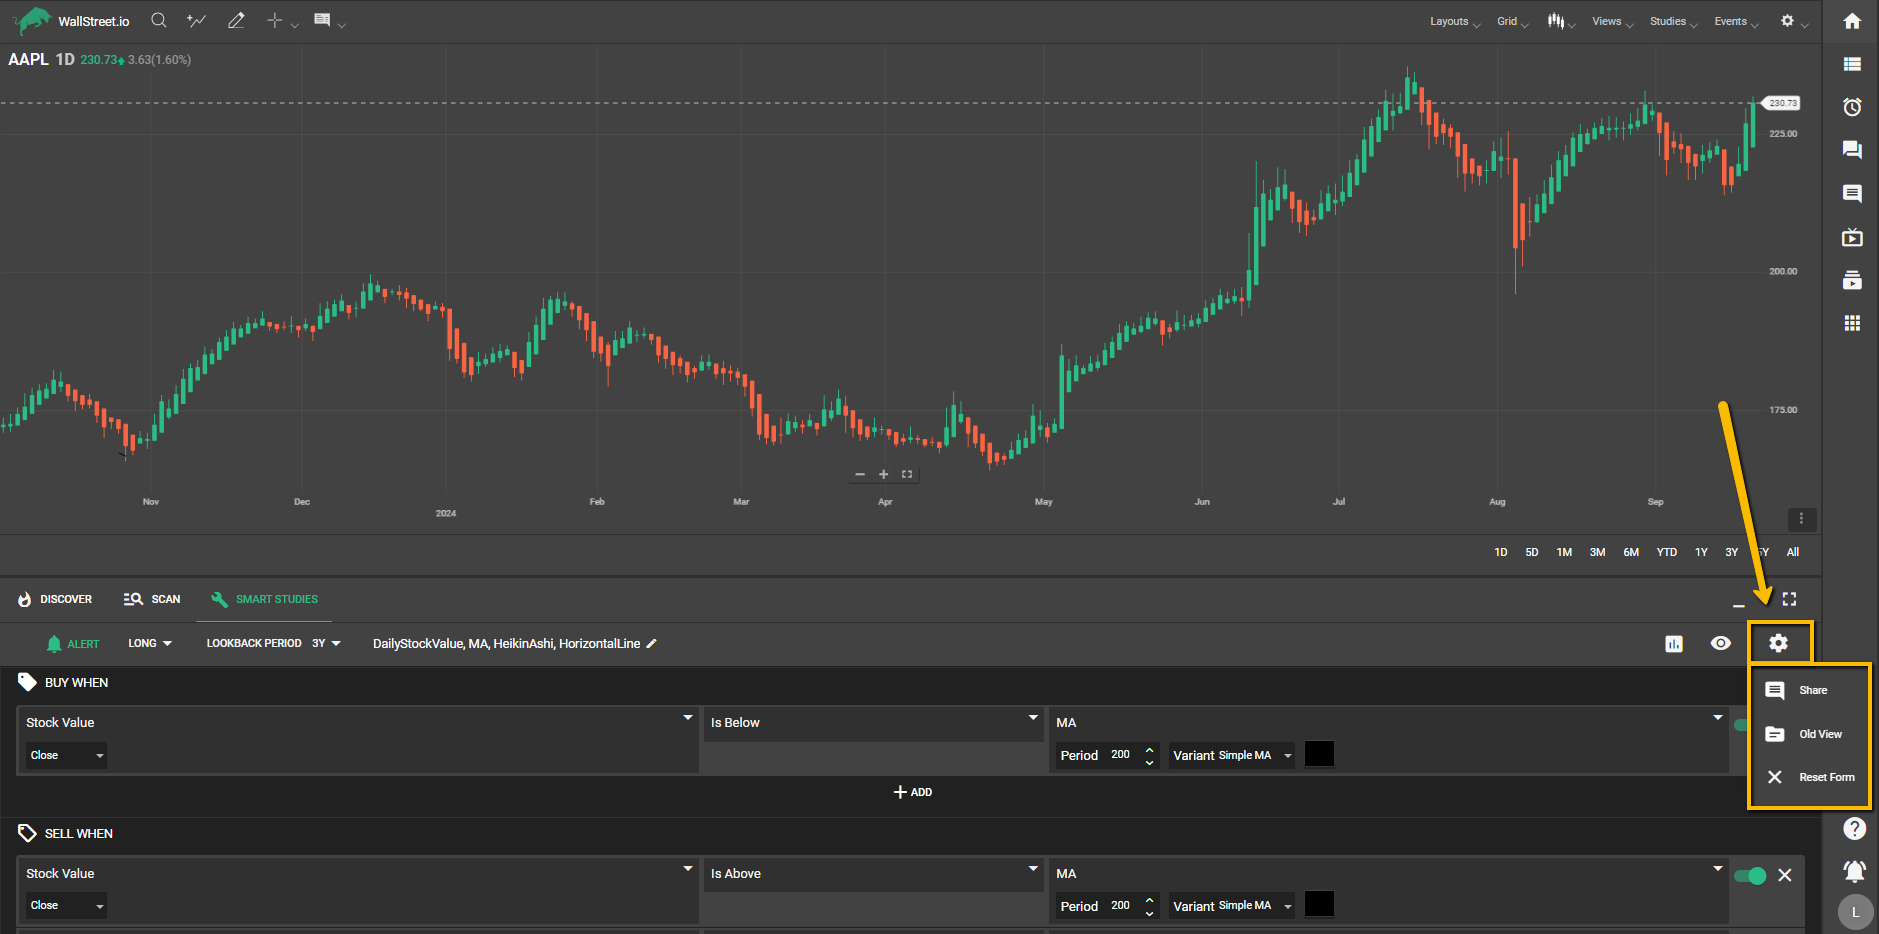
Share
This allows you to share this strategy on a Community Wall post.
Old View
This toggle shows you our Legacy Backtest Tab view.
Reset Form
Deletes all signals and studies to allow you to start over from scratch.