Welcome to the View Stats Panel, an essential tool that helps our members dissect, analyze, and understand the performance of selected trading strategies. This robust feature is housed within both the Scan Tab and the Smart Studies Tab which empowers you to dive into strategies, uncover insights, and make data-driven decisions, providing a unified and integrated experience.
In the Stats Tab, you'll find an in-depth breakdown of performance metrics, including advanced statistics that allow for precise evaluation.
Overview Tab
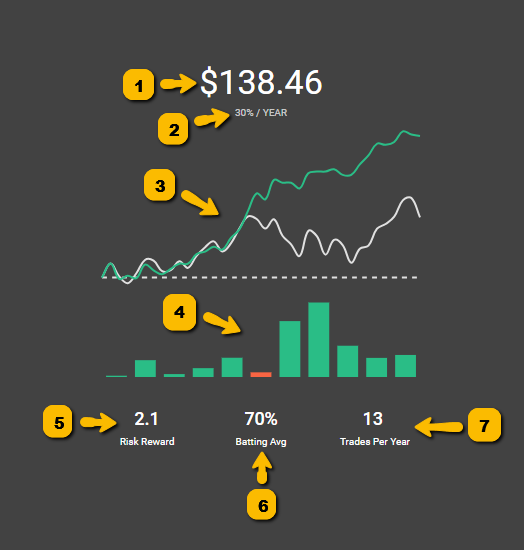 1. Return: The large number at the top center shows you the amount of money you would have made if you bought and sold 1 share of stock using the strategy in the Smart Studies tab.2. Annual Return: This is the net profit from following the strategy, expressed as a compound annual growth rate.3. Line chart: The Line Chart has two lines. The green line represents the strategy, and the grey line represents buying and holding the stock. This allows you to quickly compare the strategy to buying and holding the stock. at a glance.4. Annual Profit and Loss bars: This shows the performance of the strategy and the Buy & Hold for each year, calculated as the return over that year’s opening price. Hovering your cursor will reveal the stock’s ticker and the specific return value. This ensures more accurate year-by-year comparisons between the strategy and simply holding the stock.5. Risk/Reward: is calculated using the average win and the average loss. If you average win is 5% and your average loss is 2.5% your risk reward will be 2.6. Batting Average: is calculated by dividing your total wins by the total amount of trades. If you made 100 trades and 71 were wins your batting average would be 71%.7. Trades Per Year: shows you the average amount of times the strategy happened in a given year. This is helpful to find out a strategy's frequency. You can imagine a strategy with 14 trades a year will probably give you a trade a little more than once a month.
Stats Tab
The Stats Tab in the View Stats Panel provides you with in-depth information on the performance of the chosen strategy, including annual return, average gain and loss, maximum drawdown, risk-reward ratio, and batting average.
It also includes advanced statistics such as daily gain percent, buy and hold alpha, efficiency, median positive and negative delta, and median delta ratio. Additionally, this is where you can see who created the strategy and when, along with the number of community members following the strategy.
Strategy Overview
• The Status will tell you whether the strategy is Starting, Ending, Day x (active) or Inactive.• The Type will tell you if the strategy buys to open or sells to open otherwise know as Long or Short.• The Stock will show you the symbol that the strategy is using.• The Conditions will give you a quick view of the indicators that make up the strategy in the Backtest tab.General Strategy stats
• The Rating is a Wallstreet.io's proprietary 10-factor weighting system for evaluating strategies. An "A" strategy being better than a "B", etc.• The Sharpe Ratio measures the risk-adjusted return of an investment by comparing its excess return (above the risk-free rate) to its volatility. A higher Sharpe Ratio indicates a better risk-adjusted performance, helping investors assess whether higher returns are due to smart investment choices or excessive risk-taking.• The Sharpe Samples represent the number of time periods used to calculate the Sharpe Ratio. For example, an annual Sharpe Ratio over five years has five samples, while a monthly Sharpe Ratio over five years has 60 samples. More samples lead to a more reliable Sharpe Ratio, as they reduce the impact of short-term fluctuations and provide a clearer picture of long-term performance.• The Trades shows you the total amount of times the strategy started in the time frame selected.• The Wins for a Long type of strategy happen when a trade bought to open lower than it sold to close. For short strategies, a win will be when a trade sold to open higher than it it bought to close.• The Losses for a Long type of strategy happen when a trade bought to open higher than it sold to close. For short strategies, a loss will be when a trade sold to open lower than it it bought to close.Profit & Loss
• Return: The large number at the top center shows you the amount of money you would have made if you bought and sold 1 share of stock using the strategy in the Smart Studies tab.• Annual Return: This is the net profit from following the strategy, expressed as a compound annual growth rate.• Average Gain: Simple average for the net percentage gain (per win of the strategy) over the course of the selected time period. This is calculated by adding all the wins up by percentage value and then dividing the total by the number of wins in the timeframe.• Average Loss: Simple average for the net percentage loss (per loss of the strategy) over the course of the selected time period. This is calculated by adding all the losses up by percentage value and then dividing the total by the number of losses in the timeframe.• Biggest Win: This is the biggest win earned by the strategy, in terms of percentages.• Biggest Loss: This is the biggest loss earned by the strategy, in terms of percentages.• Average Drawdown: This is the total percentage value of all peak-to trough declines within the selected time period, divided by the total number of drawdowns within the same selected time.• Max Drawdown: The maximum observed loss from a peak to a trough of a portfolio, before a new peak is reached.Ratios
• Risk-Reward ratio: The risk-reward ratio in trading refers to the potential profit (reward) a trader expects to gain compared to the potential loss (risk) they are willing to take on a particular trade. A higher risk-reward ratio typically indicates a potentially more favorable trade setup.• Batting Average: Refers to the percentage of winning trades out of the total number of trades executed by a trader. It is a measure of trading performance and reflects the trader's ability to generate profits. A higher batting average indicates a higher percentage of successful trades, while a lower batting average suggests a lower success rate.Durations
• Trade Length: Refers to the duration of time between the entry and exit of a trade. It measures how long a trader holds a position before closing it.• Win Length: Refers to the average duration of time of winning trades.• Loss Length: Refers to the average duration of time of losing trades.Advanced
• Average Return: The average return per trade in a given strategy.• Daily Gain Percent: Net profit, expressed as a percent, for the entire strategy divided by the total number of days the strategy was 'active' or 'in a trade' (i.e. the average progress achieved daily).It is not to be thought of as a "literal" amount of change to expect at any given point in a trade, e.g., if you are in a trade for a strategy with a "daily gain percent" of 0.5% and 4 days later the stock is not 2% higher (0.5% x 4 days = 2%), then it is not a sign the trade will fail. It's a generally expected slope or angle to trending prices within a given trade for a strategy.
Practically, it could be a quick way to guess what kinds of returns to expect near the end of a trade, e.g., if you are in a trade for a strategy with a "daily gain percent" of 0.5% and 12 days later the trade is ending, then you might expect the stock to be within some variance +/- of a 6% gain (0.5% x 12 = 6%). It may also imply the trendiness of a strategy.
• Buy and Hold Alpha: This refers to a multiple of strategy gains compared to the gains achieved through buying and holding over a period.A value close to 1 indicates no difference between Buy And Hold vs trading the strategy over a period.
For example: if Buy & Hold Gains equal $100 and the "Buy and Hold Alpha" equals 1, then 1 x $100 = $100 Strategy Gains.
Another example: if "Buy and Hold Alpha" equals 1.83 and "Buy & Hold Gains” equal $100, then 1.83 x $100 Buy & Hold Gains = $183 Strategy Gains.
The higher the number is above 1, the more a strategy has outperformed Buy and Hold.
• Efficiency: A measure of noise*.Noise is the erratic movement that makes up the pattern of any price series [price action]. High noise is good for mean-reverting and arbitrage strategies [neutral strategies]. Low noise favors trend following.
To find this ratio, take the net change in price from the start to the end of the trade, and divide it by the sum of absolute price changes (always a positive number) from period to period.
The values range from 0 to 1. A "Relatively" High-Efficiency value = Low Noise (*.)
• Median Positive Delta: From the opening price of a trade to the highest price achieved during that trade. A median is calculated from every trade within the period of the strategy.• Median Negative Delta: From the opening price of a trade to the lowest price achieved during that trade. A median is calculated from every trade within the period of the strategy.• Median Delta Ratio: Considering the total range of Median Max Positive & Negative Delta's, how much of it is made up of Median Max Positive Delta? Values range from 0 - 1: values near 0.5 = price action is generally neutral, values near 0 = price action skews bearish, and values near 1 = price action skews bullish.Followers
This shows you the number of community members following the strategy and the profile pictures of some of these community members.
Lastly, at the very bottom, it shows the discovered date of the strategy and the username of the community member who discovered it.
Trades Tab
This tab is where you’ll find the Trades List tab, the Strategy Tags tab and the Strategy Notes tab.
Trades List (or “Trades”)
The Trades List shows you a list of the trades triggered by the strategy loaded on the Smart Studies tab. On each trade, at a glance, you’ll find the following information:
• opening instrument price• date of the initial opening trade signal• closing instrument price • date of the closing trade signal• profit/losses percentage during the trade• net profit during the trade (in dollar terms) • time length the trade was open. You’ll be able to sort the Trades List by opening date, closing date, and the P/L amount.
By clicking on a trade, it expands a panel underneath showing you the stats for that particular trade:
• return (in $)• net return (in %)• opening price • closing price• highest price• lowest price• trade length• drawdown• efficiency• delta• positive delta• negative delta• open date• close date• entry triggers• exit triggersTags List (or “Tags”)
This is where you’ll find the list of Strategy Tags added to the strategy. You’ll be able to sort the Strategy Tags list by Name or Date added. It also includes the option to remove any unwanted tags by clicking on the three-dot icon to the right.
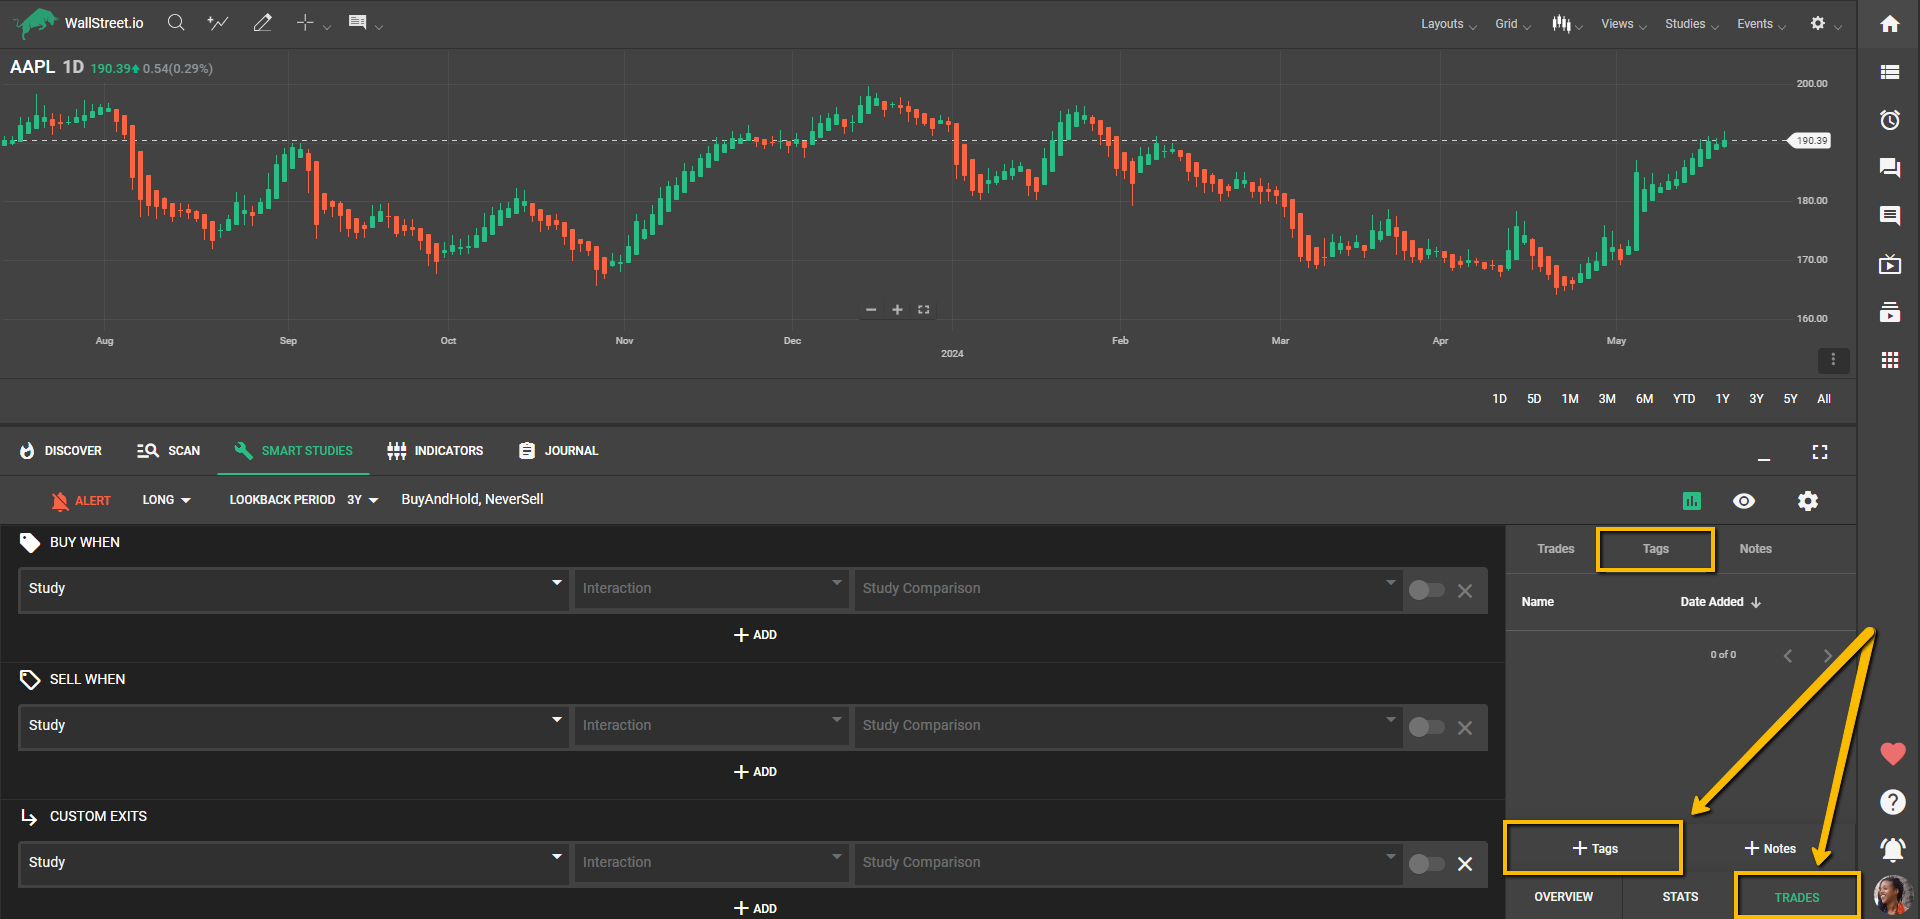
You can add Strategy Tags to any strategies through the View Stats panel under the Smart Studies Tab. Here’s how:
- Open the View Stats panel, then click on “Trades” and then “Tags:
- Click on it and enter the tags you want to associate with the strategy, either new or existing ones. You can add multiple tags to a single strategy for better organization.
Note: Strategy Tags help you organize your strategies, but remember that tagging a strategy does not mean you are following it. However, you can receive a daily email Digest about the status change of these tagged strategies even if you are not following them.
Notes List (or “Notes”)
• This is where you’ll find the list of Notes you added to the strategy. For your ease, you’re always able to add Strategy Tags or Notes while on any of these three List tabs by clicking on the “+Tags” or “+Notes” buttons, respectively.