Smart Studies How-To Guide
How to use the Smart Studies Tab
Welcome to Wallstreet.io's Smart Studies How-To Guide, your gateway to innovative trading strategies. If you're a beginner, this guide offers a step-by-step walkthrough of the Smart Studies Tab, easing you into the world of trading by teaching you how to create, backtest, and optimize strategies.
Experienced traders will also find advanced tools and instructions that allow for the crafting of intricate and tailored strategies, providing more control and insights.
Beginner users
Understanding the Smart Studies Tab
The Smart Studies Tab, previously known as the Backtest Tab, is a tool on Wallstreet.io that allows you to create and backtest trading strategies. It enables you to combine different studies using Interactions to create Conditions, which lead to Signals and ultimately Strategies.
A Strategy is a probability model derived from a set group of Entry Signals and Exit Signals applied to a financial instrument over a period of time.
Step 1: Create a Strategy by Building Entry and Exit Signals
In the Smart Studies Tab, a Signal denotes a specific trading action. It is comprised of one or more Studies or market conditions connected through Interactions.
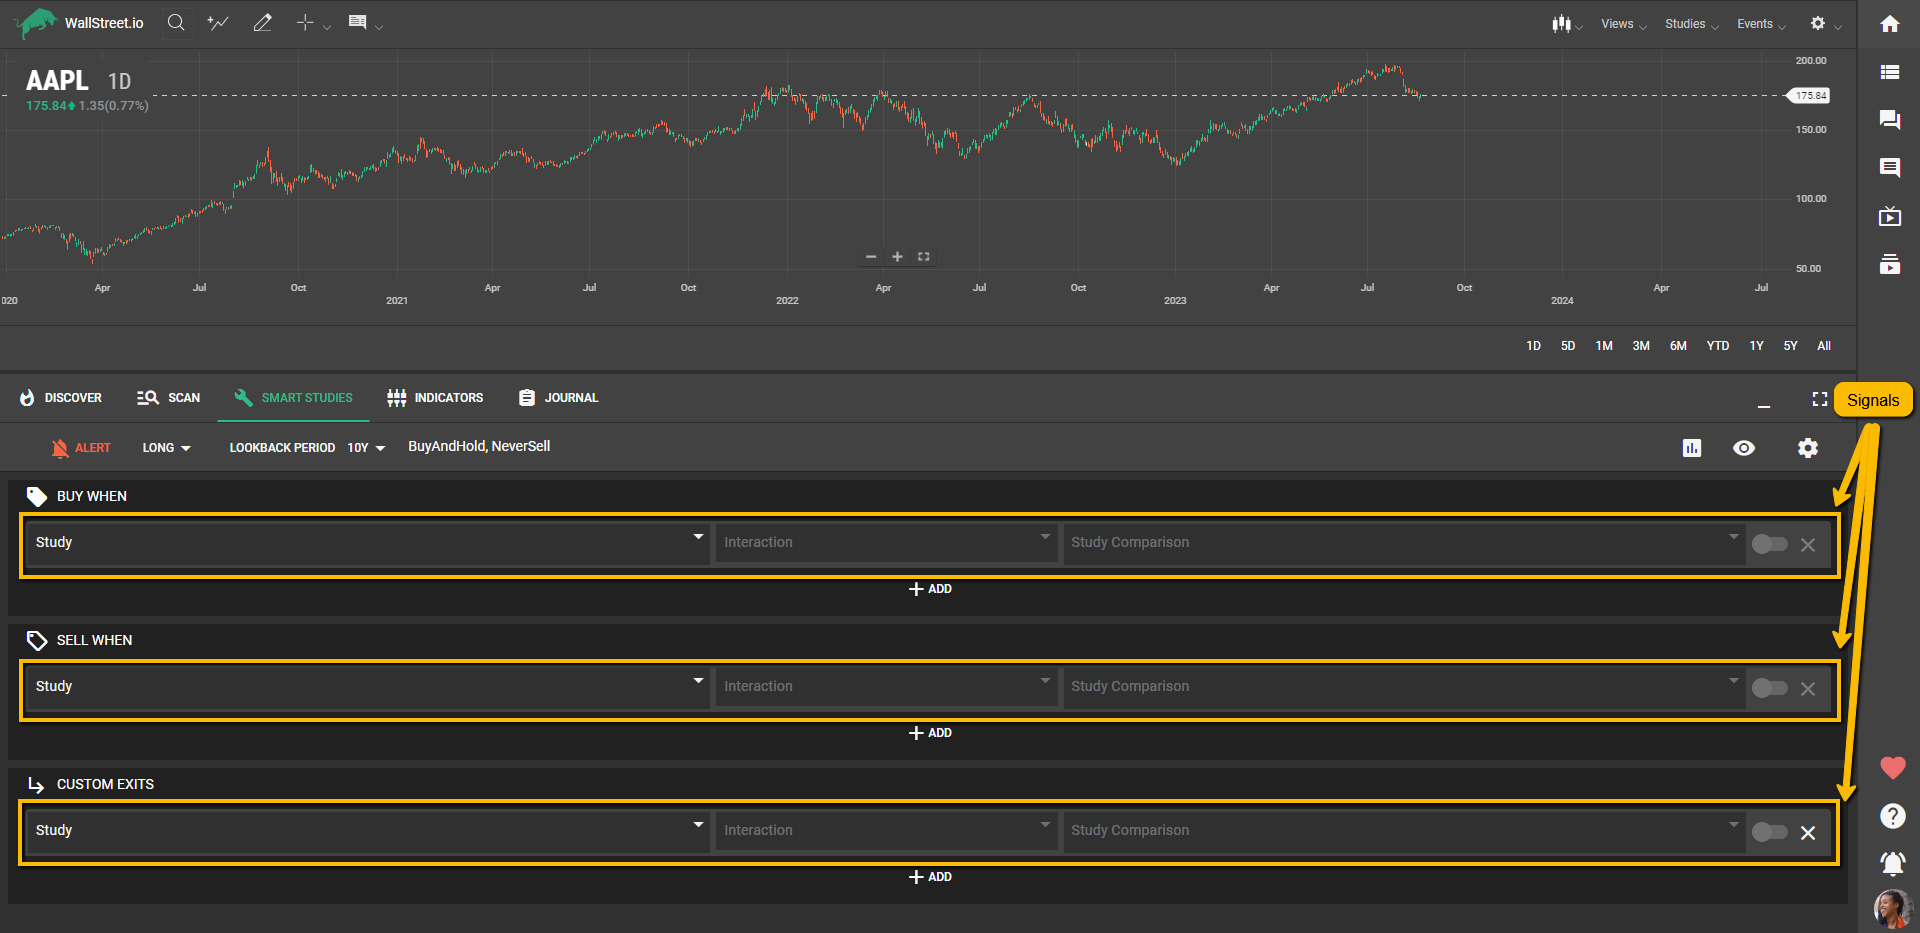
For bullish/long strategies, the “Buy When” is an Entry Signal, and the “Sell When” or “Custom Exit” are Exit Signals. Conversely, for bearish/short strategies, the “Sell When” is an Entry Signal, and the “Buy When” or “Custom Exit” are Exit Signals.
Step 2: Setting Up Conditions
In order to create a Signal, you need to establish one or many Conditions. You can add more Conditions to any Signals and treat the Conditions in each group as conjunctive ("and") Conditions. Alternatively, you can add more Groups to any Signals and include many Conditions within them. Groups of Conditions within each Signal are treated as disjunctive ("or").
Step 3: Selecting Studies, Interactions, and Threshold Values
You will see three dropdown menus next to each other on each Signal type.
In the first dropdown menu, select one of the available Studies, such as Moving Averages (MA), MACD, Bollinger Bands, etc. You can also select “Stock Value” if you’re looking to build a Signal that’s triggered when the instrument price behaves in a certain way (is above or below a set threshold, equals a set price, etc.) or interacts with a Study (crosses above a Moving Average, is below the Bollinger Bands, etc.)
Once you've selected a Study, a smaller menu will appear below where you can specify your preferred criteria for your chosen Study, such as Variant, Period, etc. For the Stock Value option, you can select Open, High, Low, or Close.
For your convenience, the first Study you select at the beginning of a Signal will duplicate on the opposite Signal, but you can delete them by clicking on the “X” at the end of the Signal, or simply changing the Study where you need to.
In the second dropdown menu, select an Interaction, such as Converges with, Crosses below, Crosses above, Diverges from, etc.
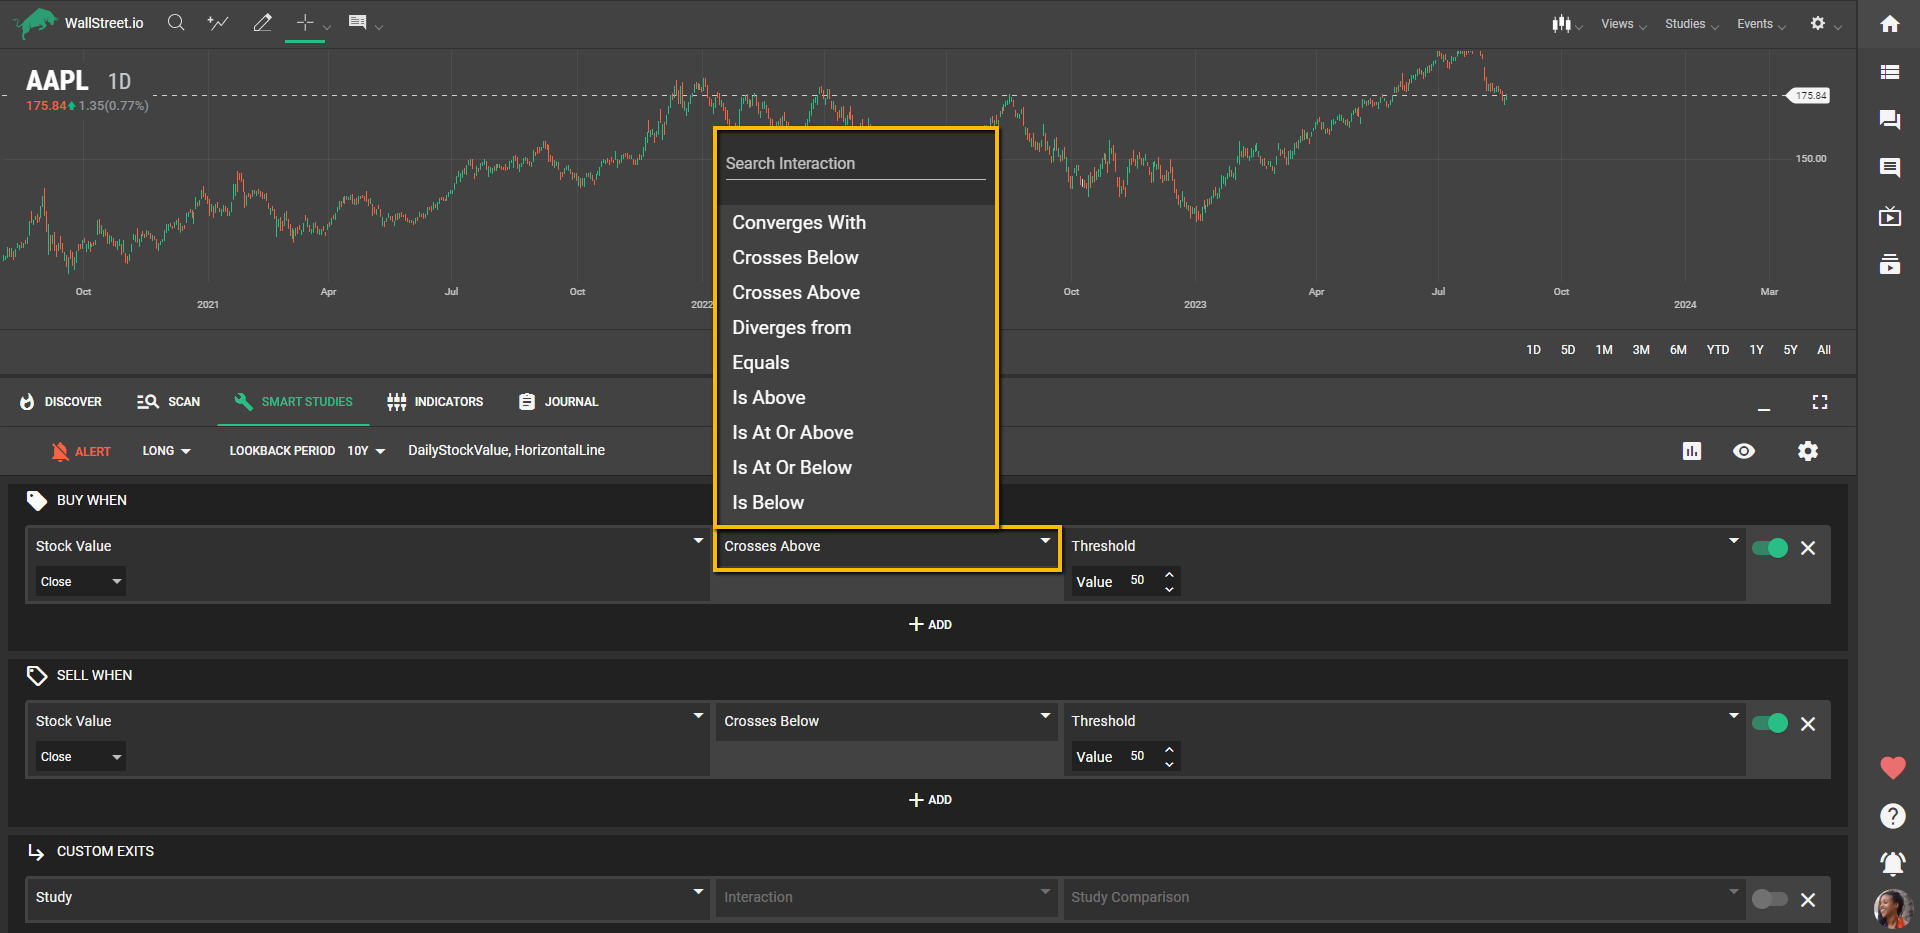
In the third dropdown menu, select a measure to test your chosen Study against, options include many other Studies, Threshold Value or Stock Value when applicable.
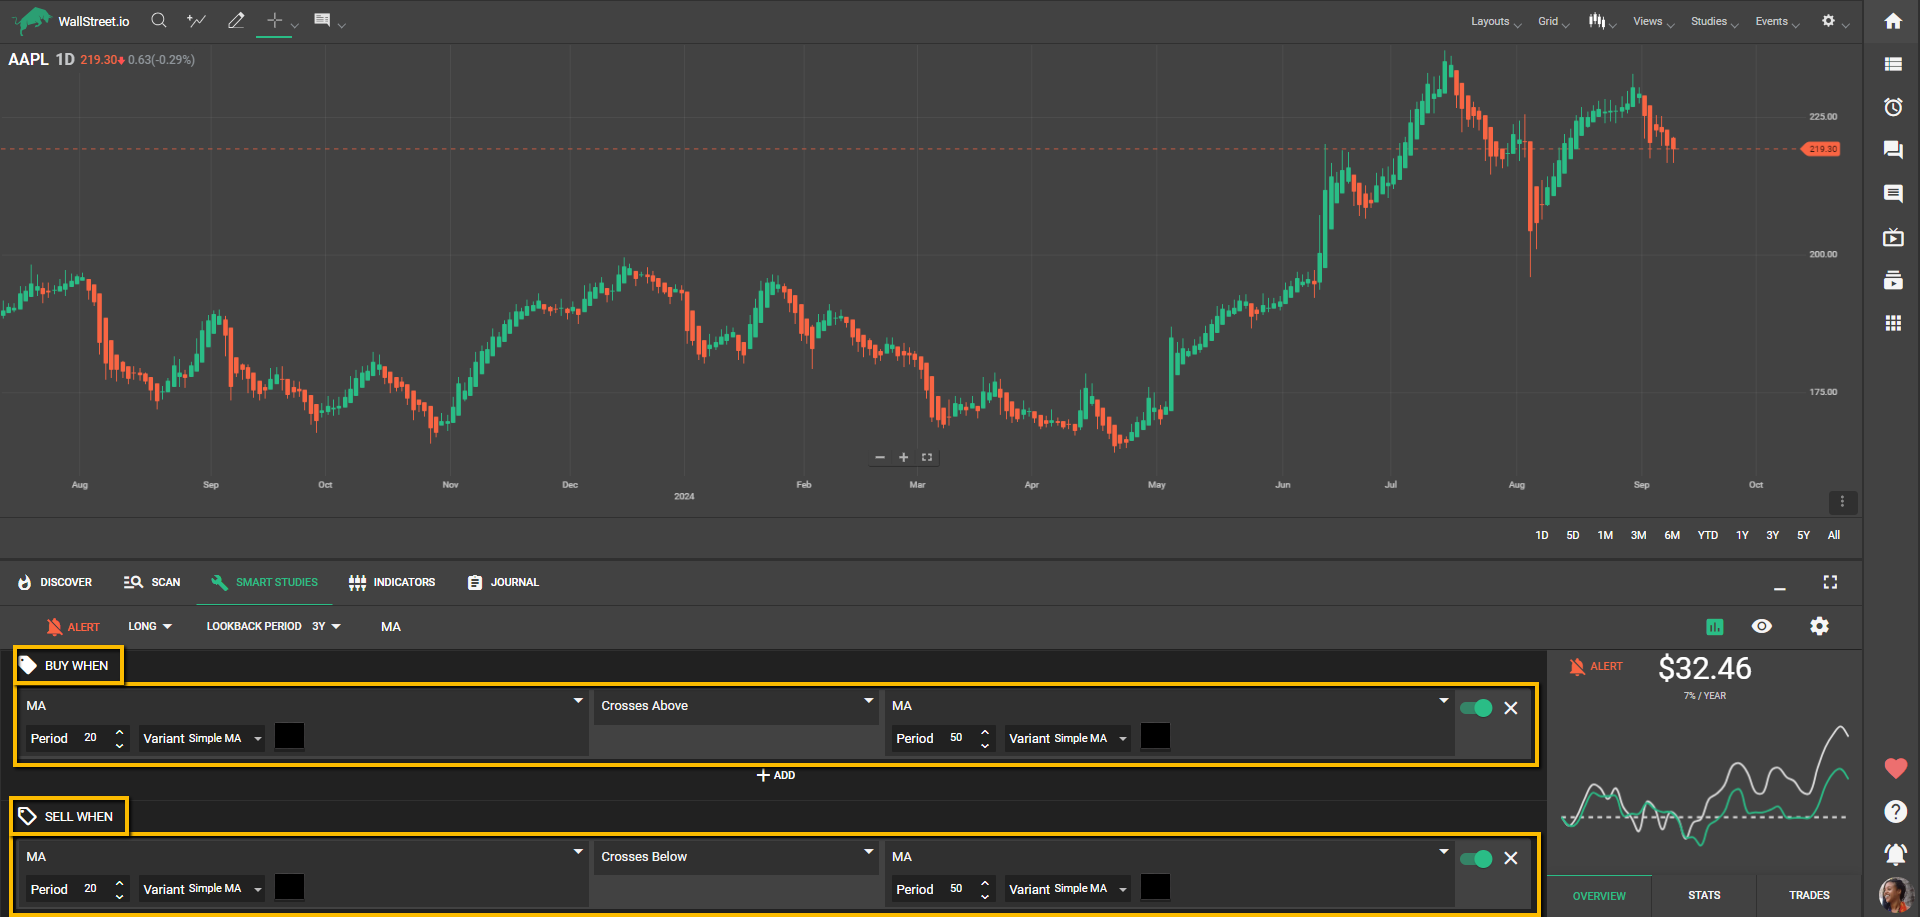
For example, let's create a basic strategy using Moving Averages:
For the "Buy When" Entry Signal, select "Moving Averages" from the first dropdown menu, specify a period of "20" days from the smaller menu that appears below (representing a 20-day moving average), select "Crosses above" from the second dropdown, and select "Moving Averages" in the third dropdown, setting a period of "50" days (representing a 50-day moving average) for it.
For the "Sell When" Exit Signal, reverse the conditions: choose "Moving Averages" from the first dropdown, specify a period of "20" days from the smaller menu, select "Crosses below" from the second dropdown, and choose "Moving Averages" in the third dropdown, setting a period of "50" days for it.
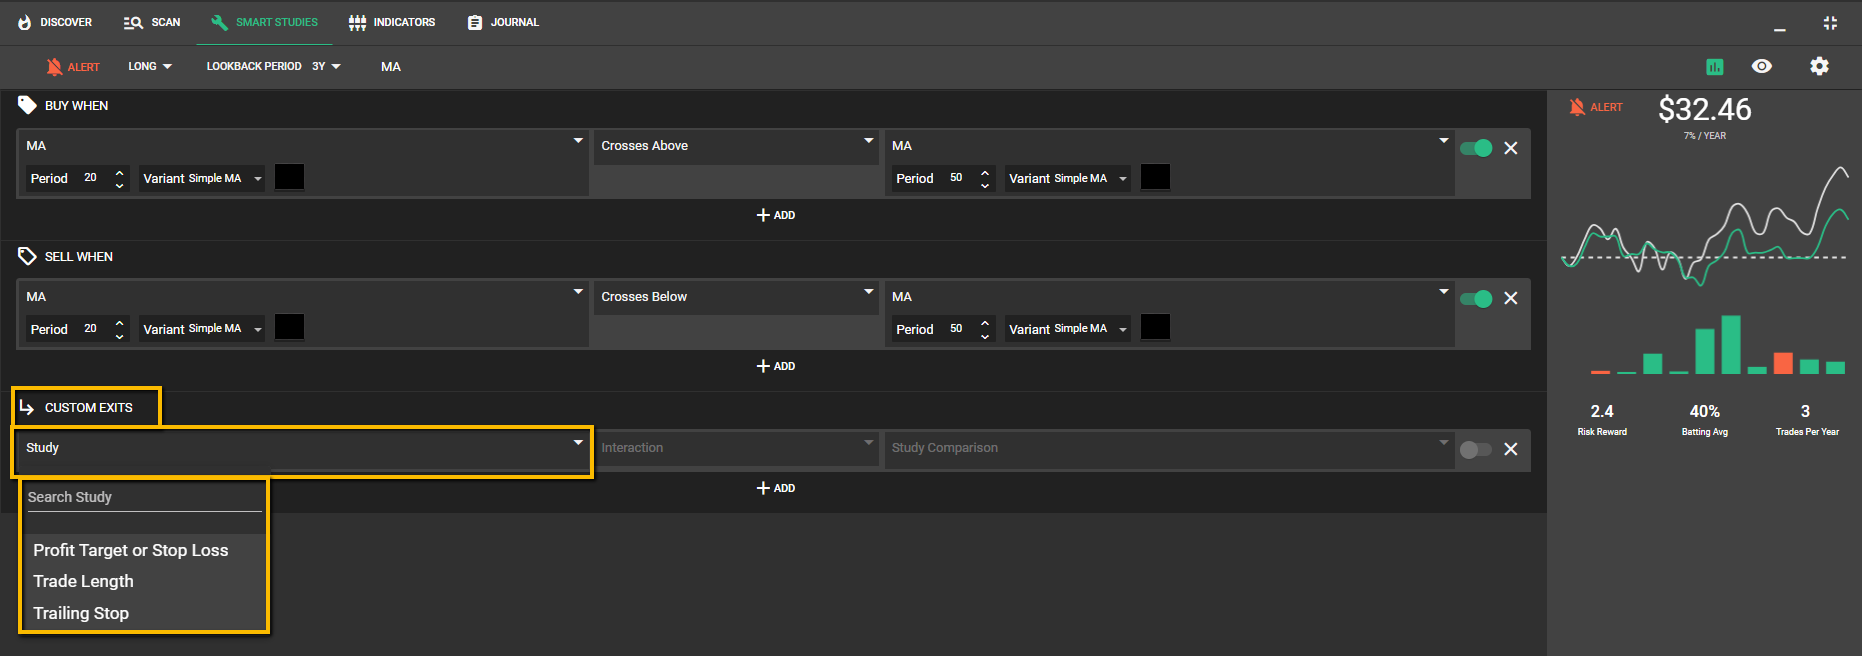
Step 3.5: Utilizing Custom Exit Signals
In the Signal selection, you will also notice a category called "Custom Exit". Here, you can specify additional conditions for when you want to exit a trade. This gives you more control and helps optimize your strategy for your specific goals.
Two commonly used Custom Exit Signals are:
To set a Custom Exit, select the type of exit from the dropdown menu, and then specify the required parameters (such as the profit target price or the trailing stop distance).
Step 4: Backtesting your Strategy
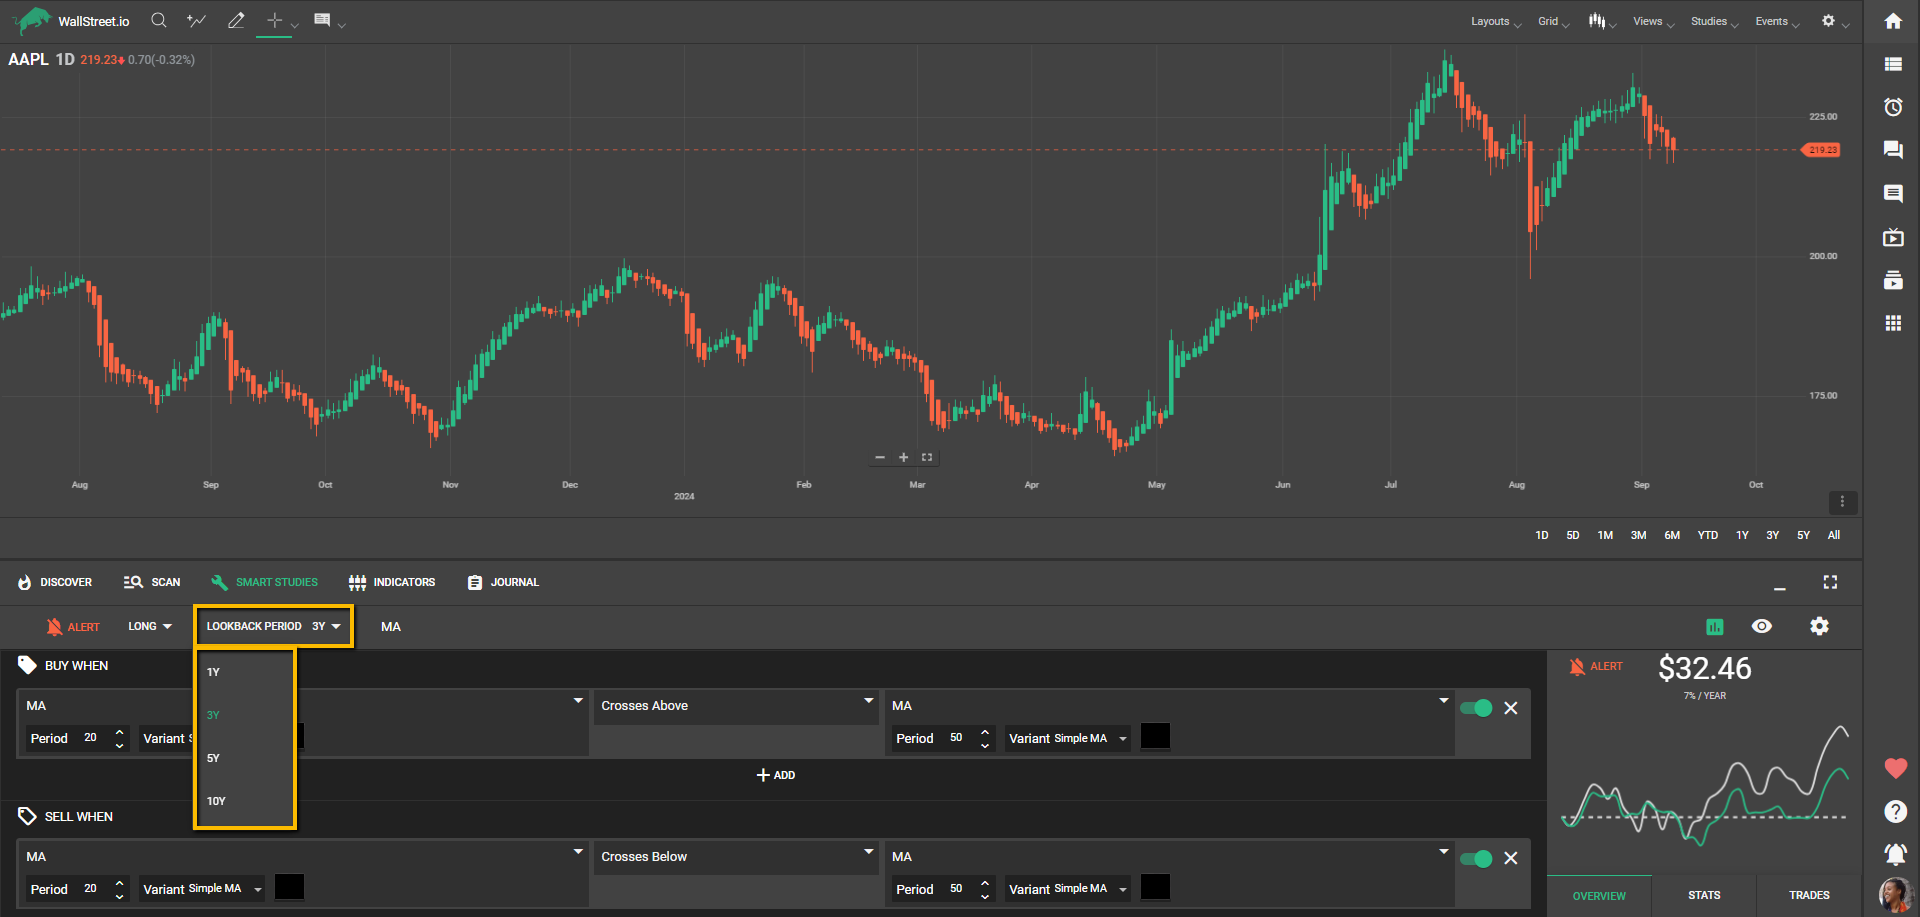
As soon as you set up the needed Signals for your Strategy, you’ll see the View Stats panel at the left automatically populating the Strategy performance statistics and information. You can also select your Lookback Period from the available options in the dropdown menu: past 365 days (1Y), past 3 years, past 5 years, or past 10 years.
Step 5: Reviewing your Strategy's Performance
After setting up a Strategy, the View Stats panel will allow you to view useful information about the selected Strategy. It offers an overview at a glance but also offers a deep dive into its statistical performance over time. Examine these results closely and tweak your strategy as needed to update them.
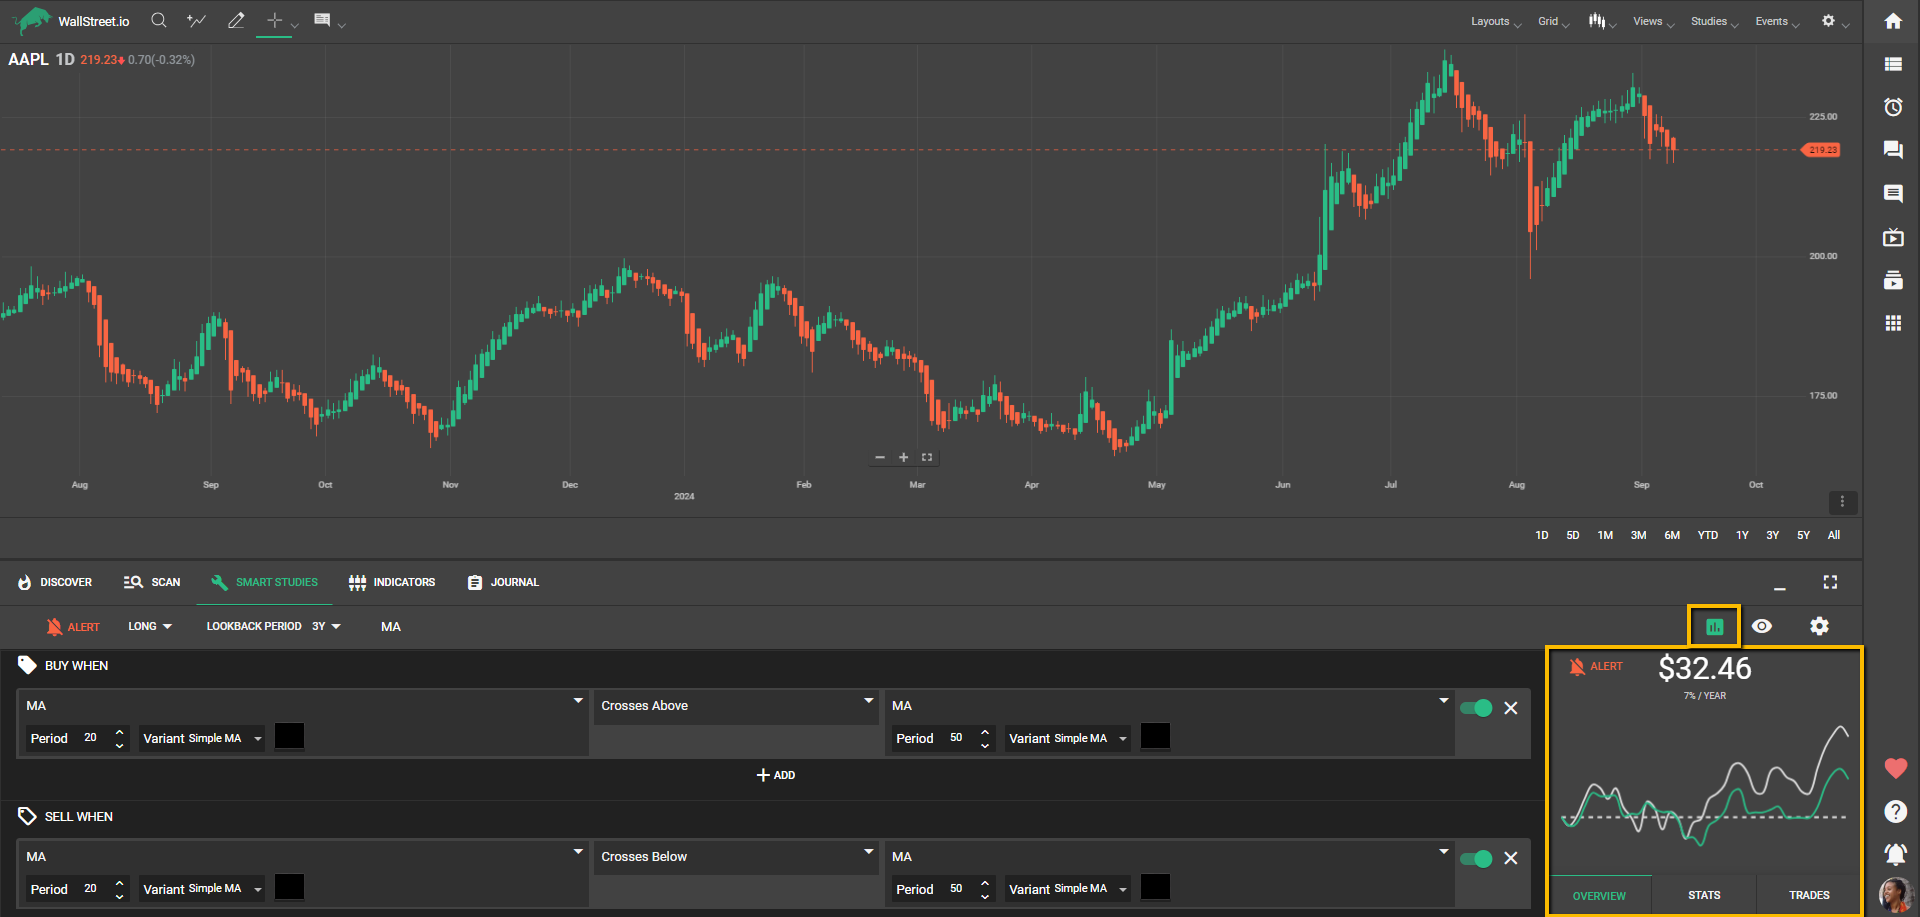
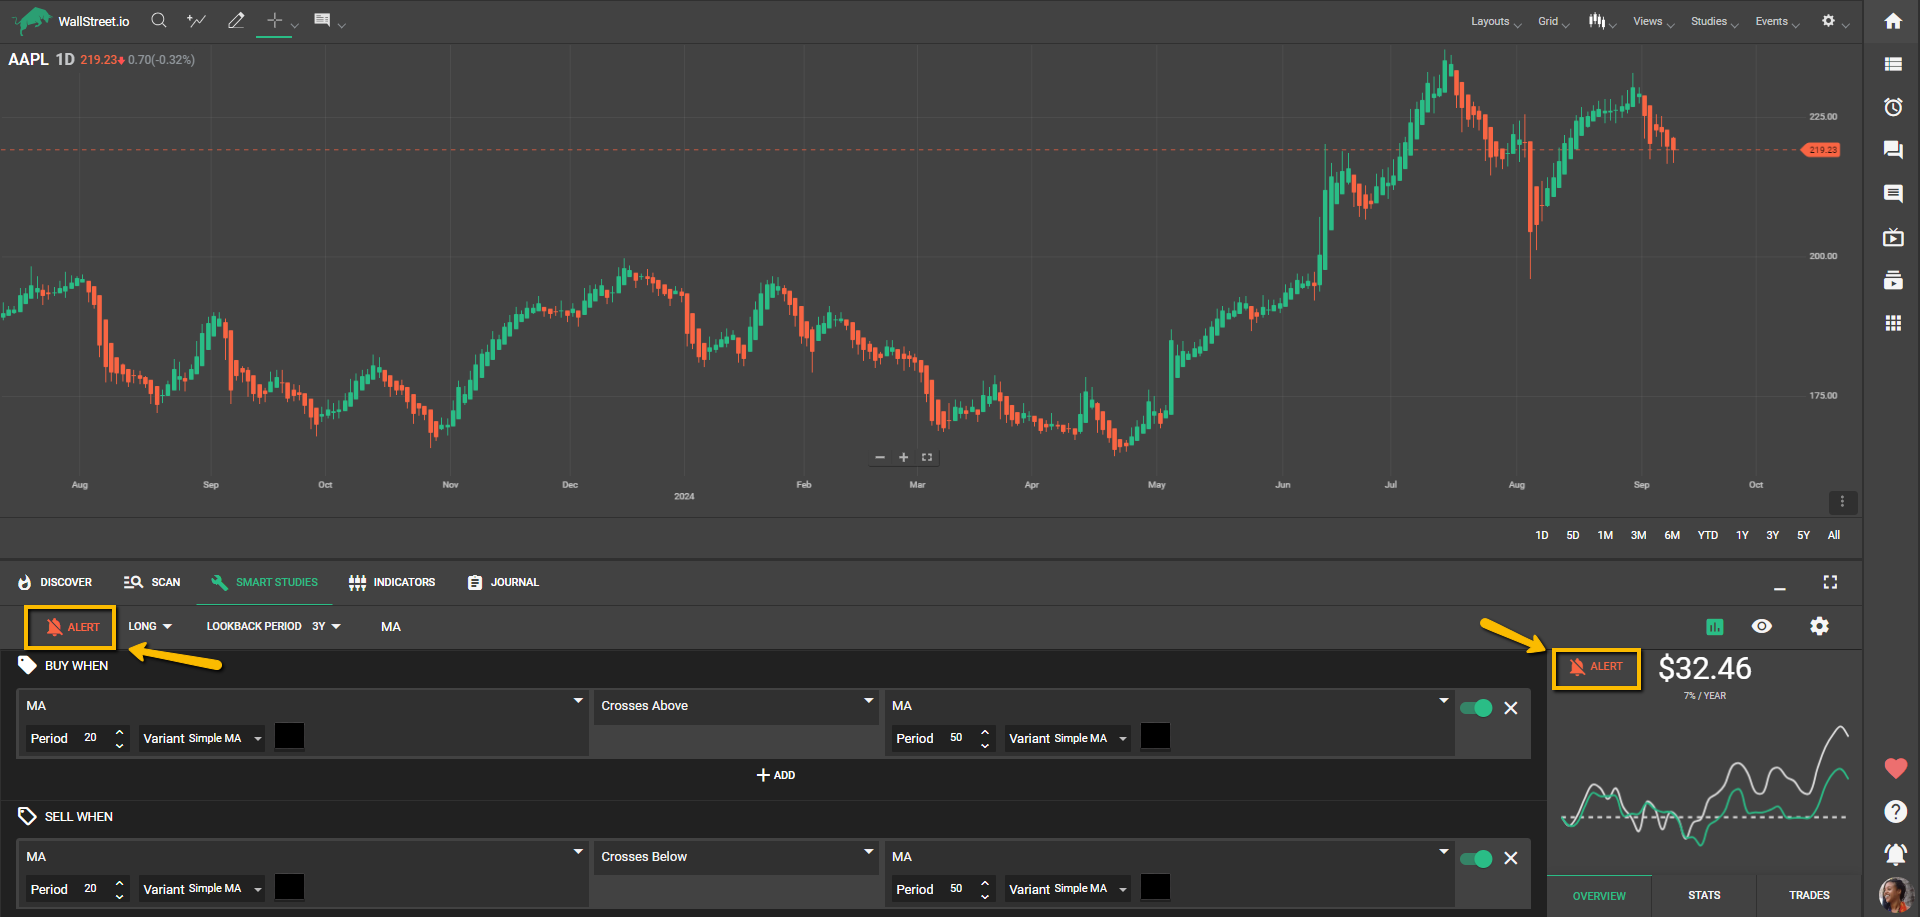
Step 6: Setting Alerts
Once you're satisfied with your Strategy, you can set up Alerts to be notified by email of the ongoing status of your Strategy. This proactive Strategy Notification email system will keep you informed and engaged with your chosen trading Strategies.
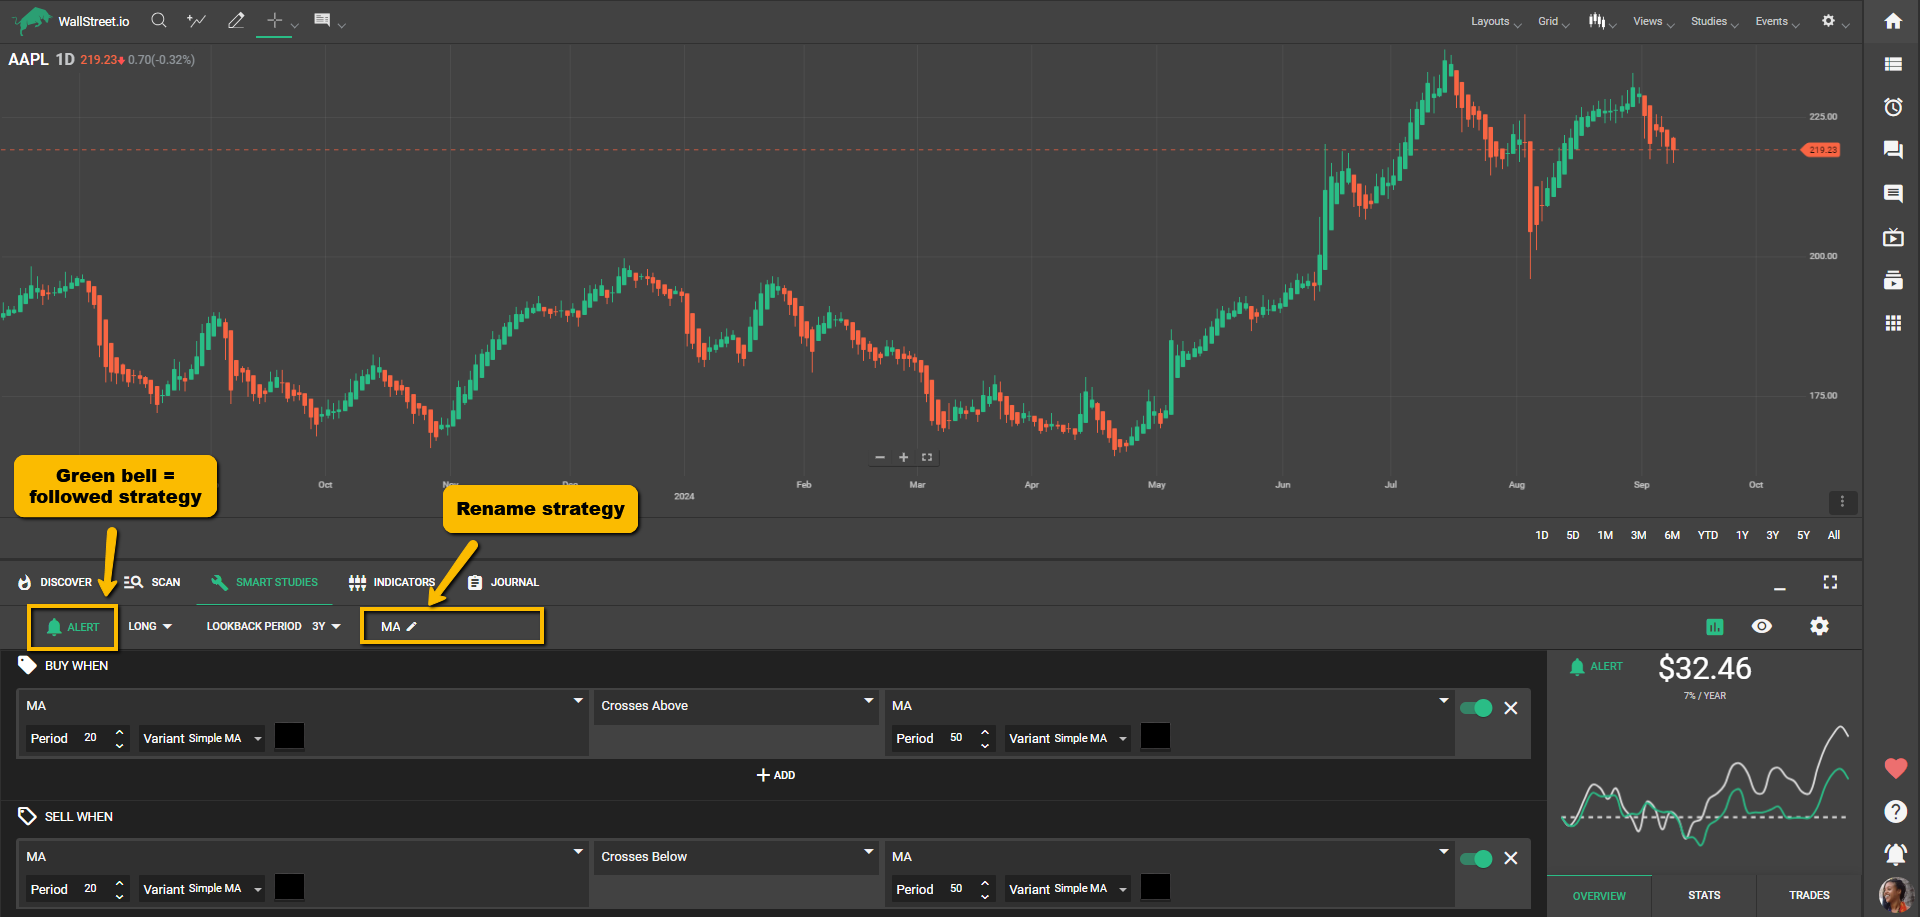
Step 7: Renaming your Strategy
If you set an Alert for a Strategy, you can choose to rename that Strategy to distinguish it from others and easily identify it within your account, by clicking on the pencil icon below the Smart Studies tab. This renaming is for your convenience and doesn't change the strategy's name for other members.
Tips for Beginners:
In addition to the above instructions, it's beneficial to familiarize yourself with the available technical Studies and what they represent. This understanding will assist in creating more effective and nuanced trading signals.
Remember, that Smart Studies is a tool for testing trading strategies based on historical data, so past results are not a guarantee of future results. Always use the Smart Studies tab as part of a broader, well-rounded strategy, and not the sole determinant.
Experienced Users
For intermediate users with some trading experience and familiarity with Wallstreet.io, the Smart Studies Tab provides a powerful suite of tools to build, test, and optimize custom trading strategies.
Step 1: Building a Comprehensive Strategy
Navigate to the Smart Studies Tab. Here, you'll build your strategy using a combination of Entry and Exit Signals. Remember, each Signal is based on a Condition or multiple Conditions.
For each Condition, you'll select a Study, an Interaction, and a Comparative Measure or a Threshold Value. Depending on your chosen Study, you can also specify additional parameters, such as Period, Channel, Standard Deviation, Variant, etc.
Step 2: Complex Conditions and Groups
Create complex Conditions by adding more conditions to a Signal, treating them as "and" Conditions. Alternatively, create additional Condition Groups within a Signal, treating them as "or" Conditions. This allows for nuanced strategies that can adapt to a variety of market situations.
Step 3: Custom Exit Signals
Use Custom Exit Signals for more precise control over your strategy. This is especially useful for managing risk and locking in profits. Custom Exits include:
Step 4: Backtest Across Different Timeframes
Run your strategy across different timeframes to gauge its effectiveness under different market conditions. You can select from 1-year, 3-years, 5-years, and 10-years timeframes.
Step 5: Deep Dive into Strategy Performance
In the View Stats panel, take a deep dive into your strategy's performance metrics. Beyond basic stats, examine metrics such as winning rate, average gain, and average loss. Adjust your strategy based on these metrics to improve its effectiveness.
Step 6: Utilize Alerts for Proactive Strategy Management
Enable alerts for your strategy. You can set up alerts to be triggered at the start, during, or at the end of your strategy. This allows you to stay informed and make timely decisions.
Step 7: Organize Your Strategies with Custom Names
To better organize your strategies, give each one a unique name. This is especially helpful when you're running multiple strategies concurrently.
Remember, the Smart Studies Tab is a tool to assist you in your trading journey, but it's not a guarantee for future success. Always manage your risks and make trading decisions based on a comprehensive analysis.