Definition:
The Detrended Price Oscillator calculates the difference between a past price and a moving average to identify cycles and overbought/oversold conditions. It filters out the larger trends to help you zero in on shorter-term patterns.
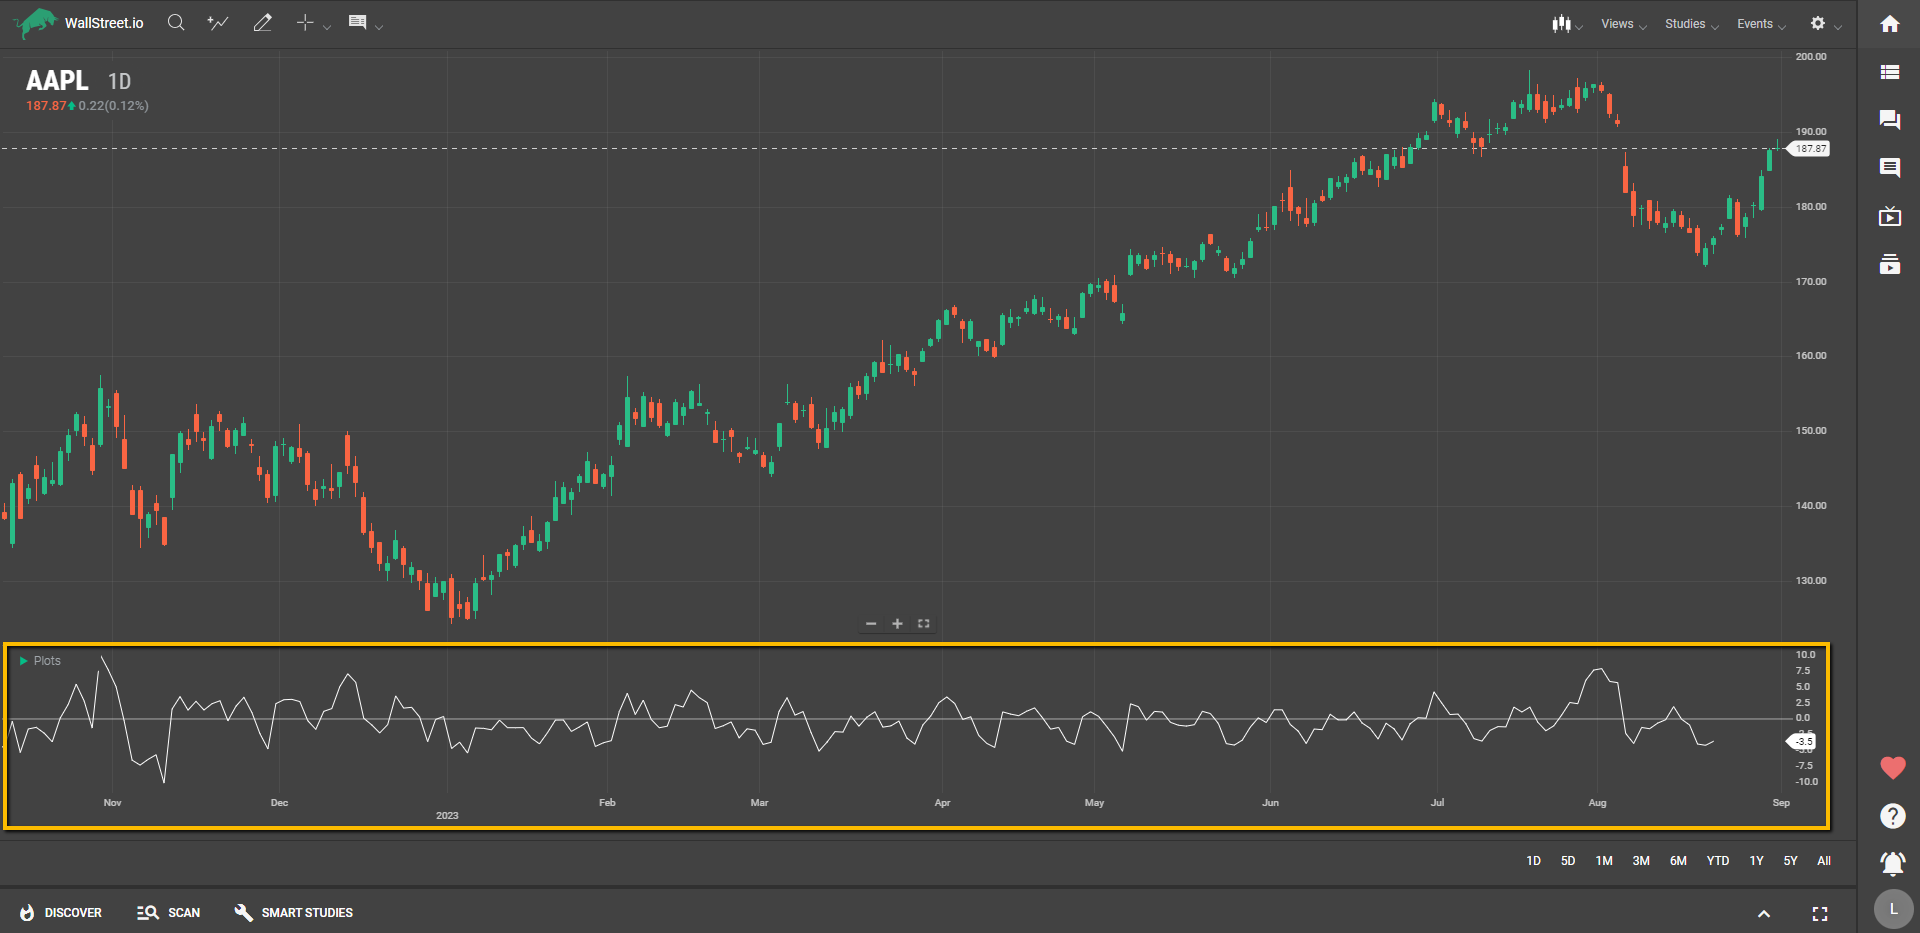
By comparing a shifted moving average to the current closing price, the DPO gives you a cleaner look at a stock's oscillations above and below its average price.
Suggested Trading Use:
So, how can the DPO benefit your trading journey? Let's dive in:
Spot Cycles: Use the DPO to identify regular peaks and troughs in a stock's price. These could represent buying or selling opportunities.Compare and Contrast: Since the DPO can be applied to other studies using the Field parameter, you can use it to examine how other indicators behave when the general trend is removed. This can offer a unique angle on commonly used indicators like the Relative Strength Index (RSI) or Moving Average Convergence Divergence (MACD).Timing: When the DPO moves above zero, it may indicate a bullish phase, while movement below zero could signal a bearish phase. Keep an eye on these movements to time your entry and exit points.Short-term Focus: Remember, the DPO is more concerned with short-term fluctuations than with capturing long-term trends. Use it when you're interested in making quicker trades based on shorter cycles.By using the DPO, you can gain a nuanced understanding of short-term price movements while filtering out the noise of larger trends. This can make it easier to identify key moments to buy or sell, enhancing your trading experience.