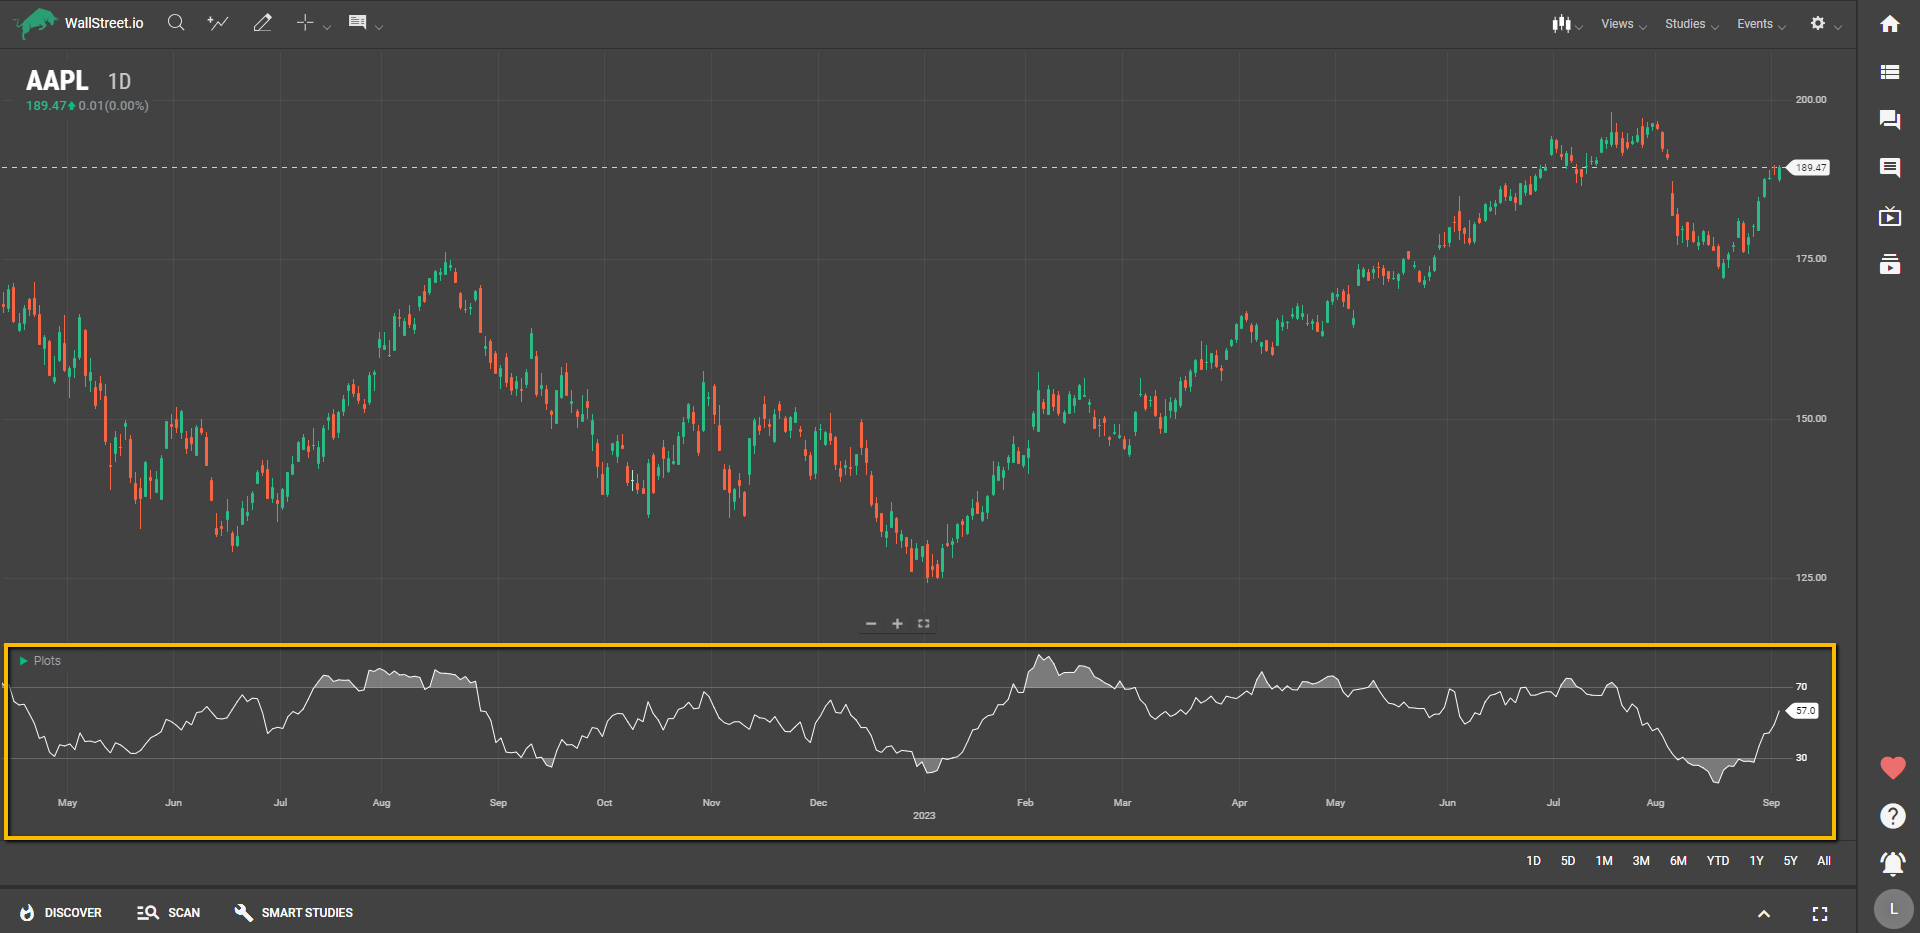
Intraday Momentum Index
Definition
The Intraday Momentum Index (IMI) is an oscillator that measures the strength of a trend based on the range between the close and open prices over a specified period. This indicator moves between 0 and 100 and includes Overbought (OB) and Oversold (OS) levels to help you gauge market conditions.
Suggested Trading Use:
Just like the Relative Strength Indicator (RSI), the IMI can signal when an asset might be overbought or oversold. An IMI value above a certain threshold (commonly 70) often suggests that the asset is overbought, and you might want to think about selling or exiting a long position. Conversely, a value below a different threshold (usually 30) could indicate that the asset is oversold, which could be a buying opportunity.
The major distinction between the IMI and RSI is that IMI focuses on intraday price changes, making it particularly useful for traders interested in shorter time frames. If you're an intraday trader, the IMI can offer valuable insights into immediate trend strength or weakness, helping you make quicker decisions.