Doji Screener Reference Guide
Overview
The Doji Screener is a specialized tool within the WallStreet.io platform that identifies potential trade entry points by detecting Doji candlestick patterns on Heikin-Ashi charts. These patterns often signify the beginning of a PayDay Cycle, making them strategic moments for trade initiation.
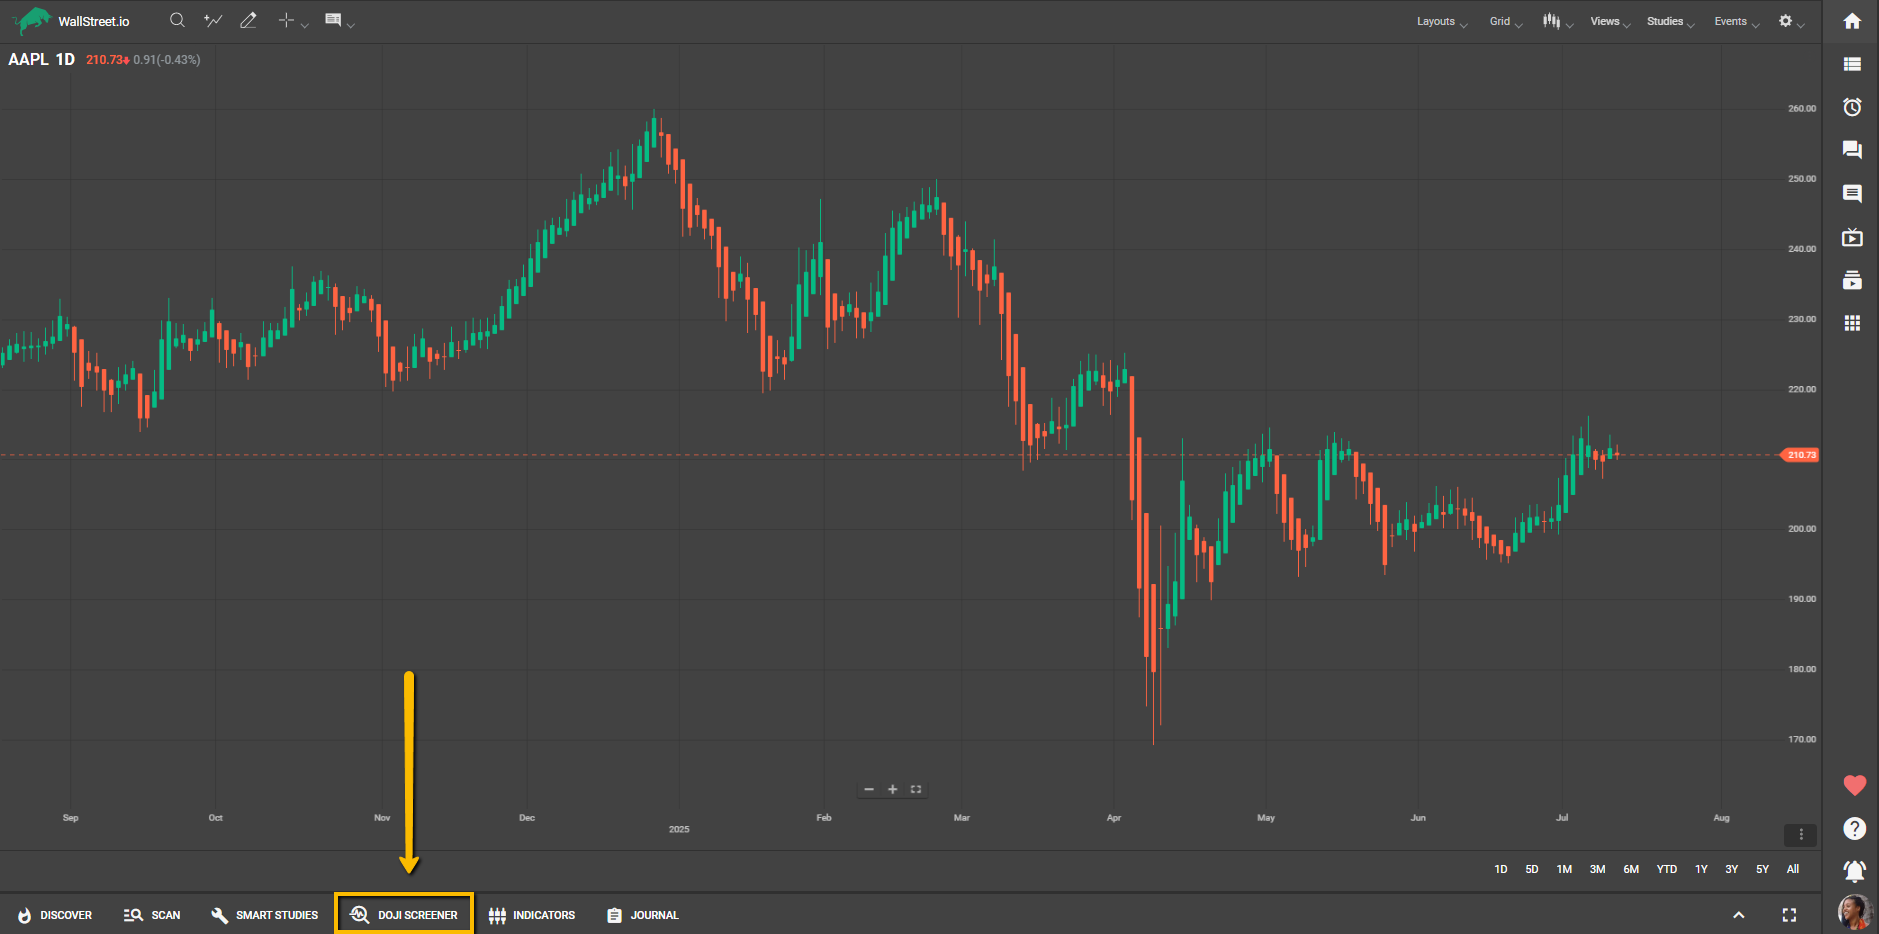
Interface Overview
At the top of the Doji Screener, users will find:
Filter Dropdown Menus (Top-Left)
Stock Universe Filter
Located on the left side of the toolbar (default: All Stocks):
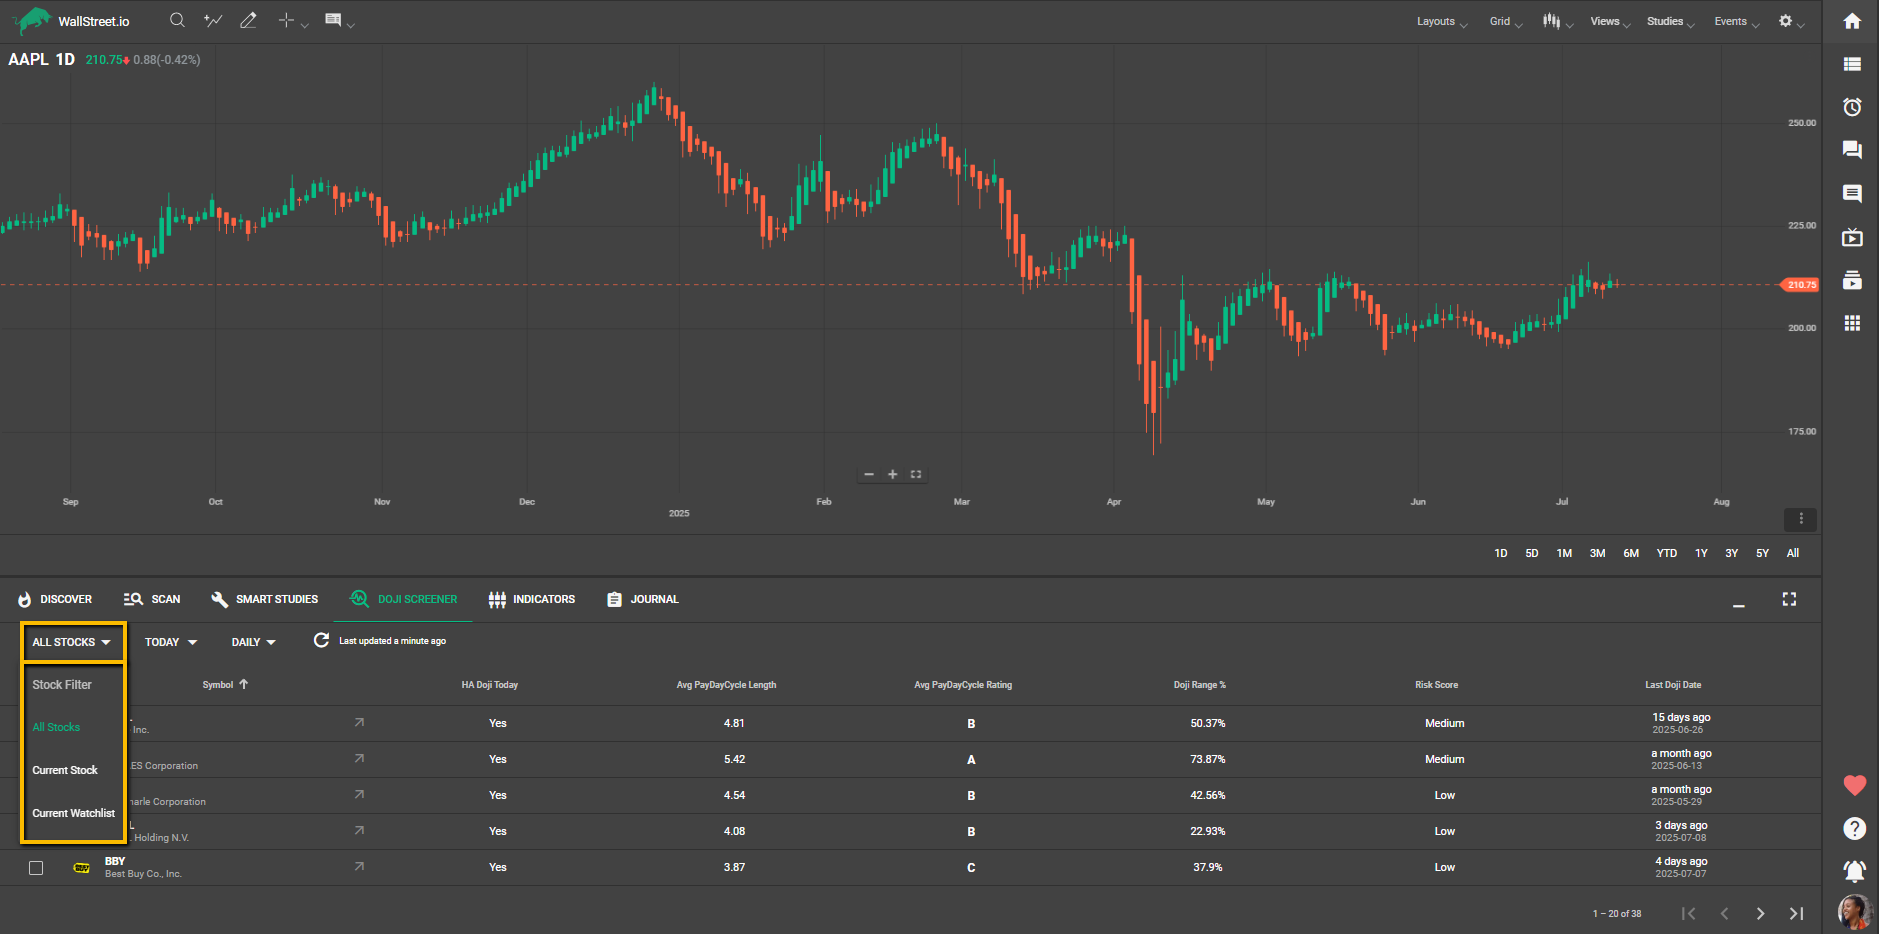
Allows users to narrow the screener results to:
• All Stocks: Includes
• Current Watchlist: Displays only stocks from your active personal Watchlist.
• Current Stock: Displays only the chart currently selected in the main view.
Periodicity Filter + Date-Range Picker
Located next to the stock filter (default: Today and Daily).
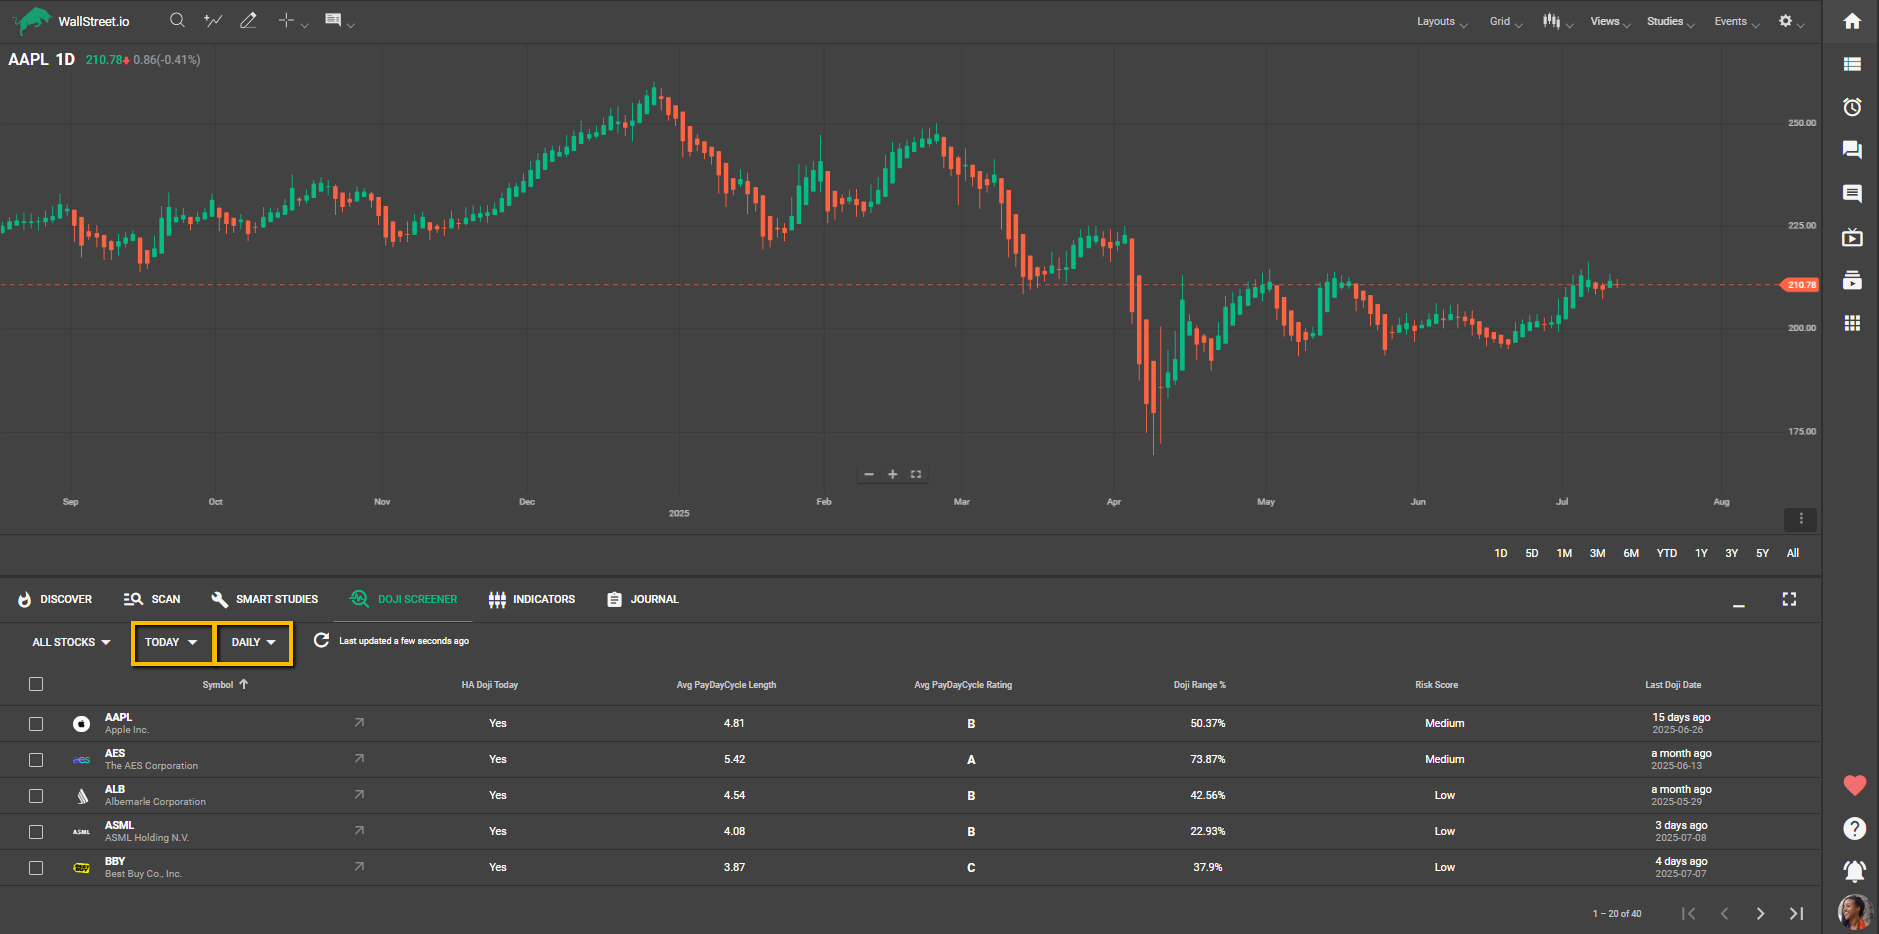
This combined control allows you to:
Choose Time Unit:
Select a Date Range: Tailored to the selected time unit.
For Daily, options include:
For Weekly, options include:
Switching time units (Daily ⇄ Weekly) will automatically reset the date filter to Today, ensuring a clean, relevant starting point.
Screener Layout and Columns
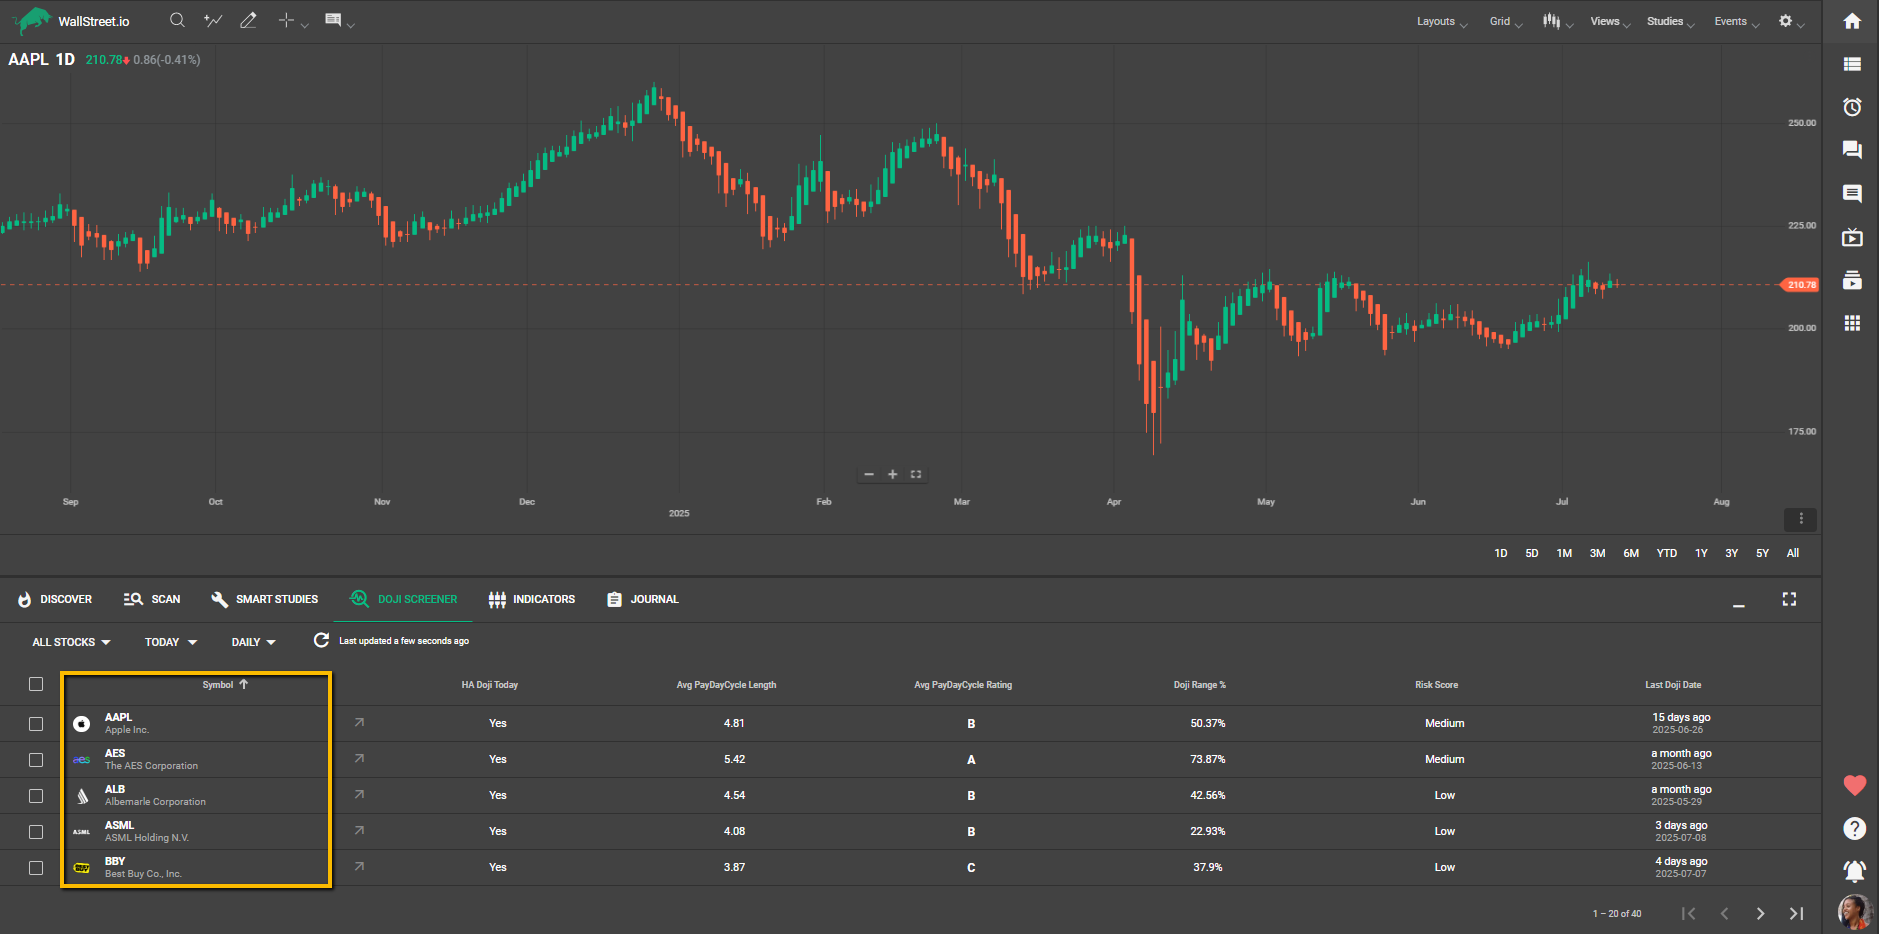
Each row in the Doji Screener represents a stock where a Heikin Ashi Doji has recently occurred. The columns describe key metrics to help evaluate the quality and risk of a potential setup:
Symbol
• Displays the stock’s ticker symbol and company name.
• Clicking the symbol will open the full chart view for that stock.
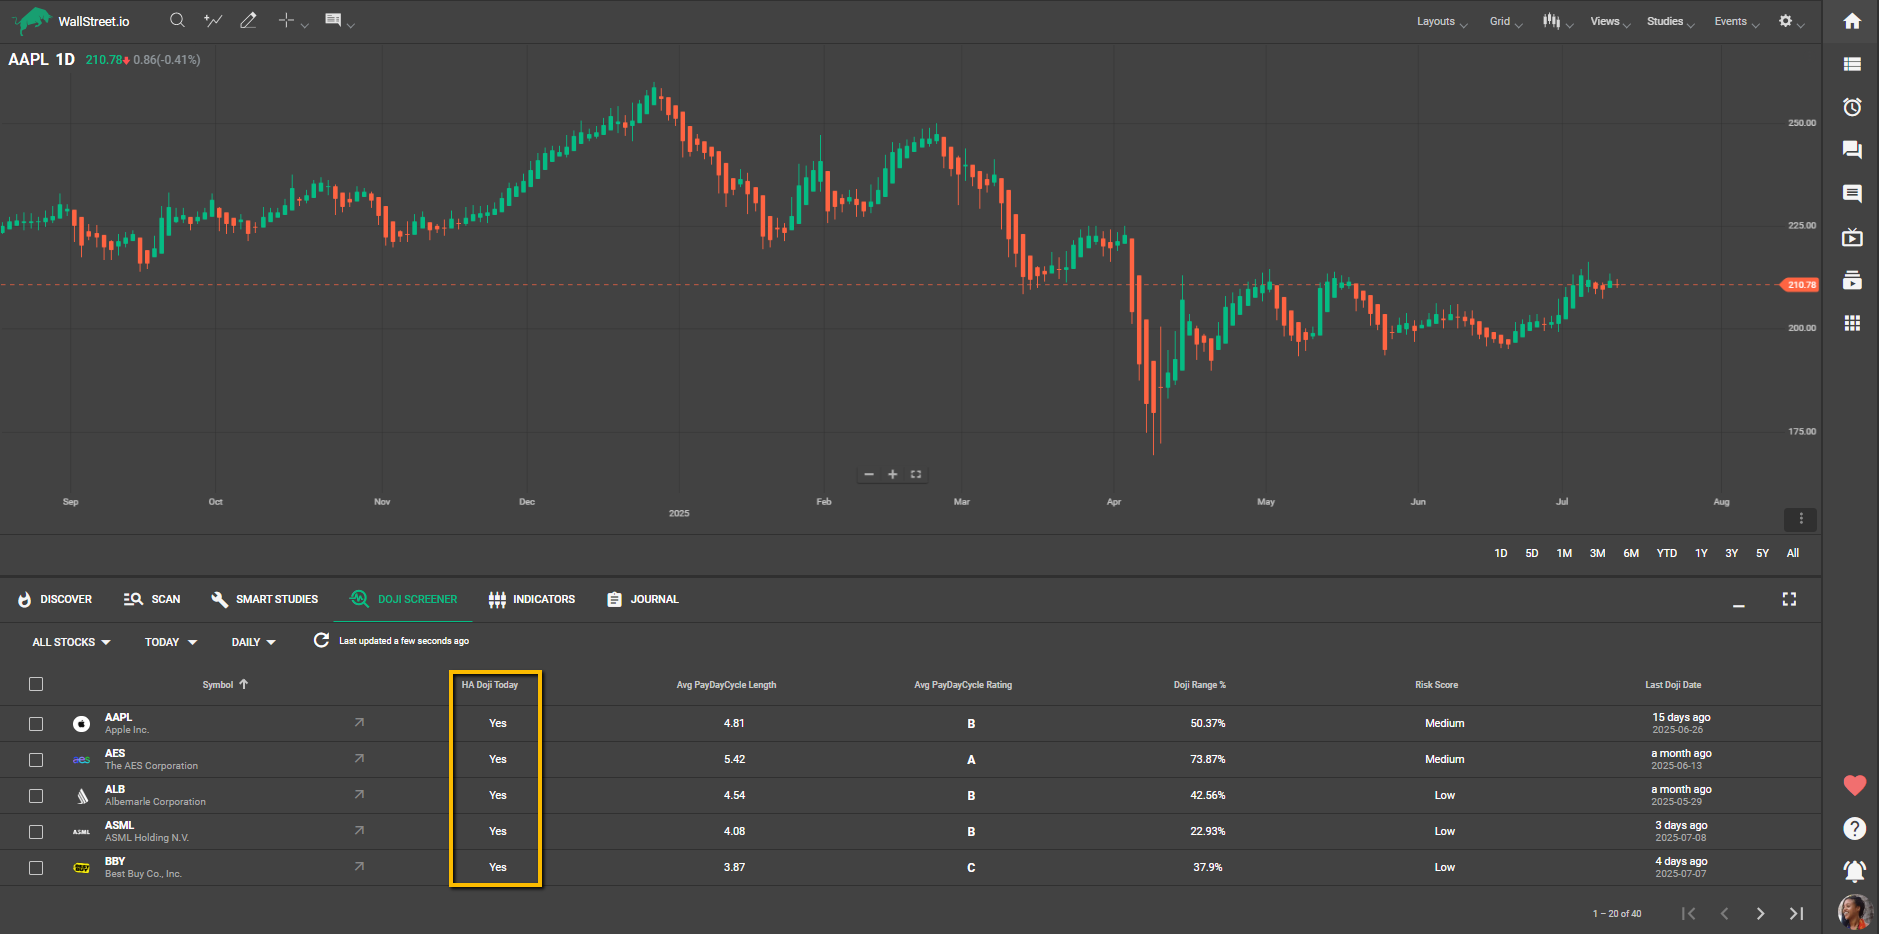
HA Doji Today
Yes means a Heikin Ashi Doji has formed during the current trading session.
• Note: This status is real-time/intraday and may not yet be reflected in the Last Doji Date, which only updates after confirmation.
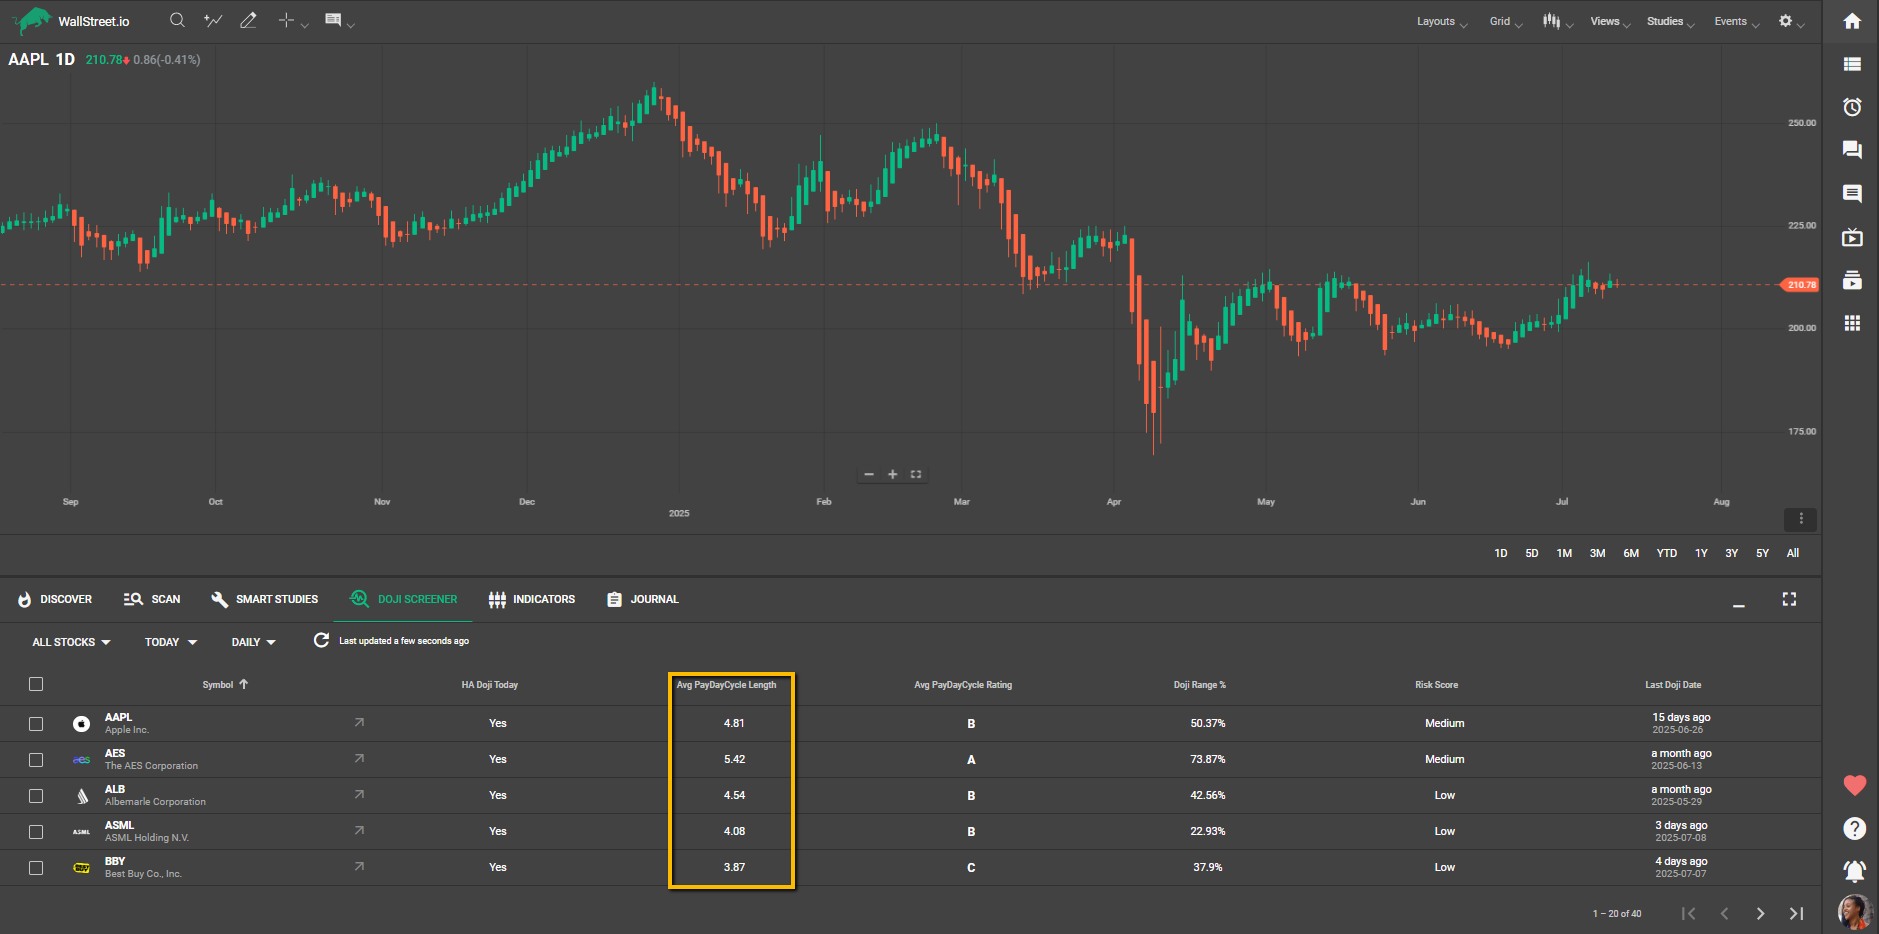
Avg PayDay Cycle Length
• Shows the historical average length (in trading days) of PayDay Cycles that begin after a Doji for this stock.
• This helps users understand how long a bullish move typically lasts after these setups.
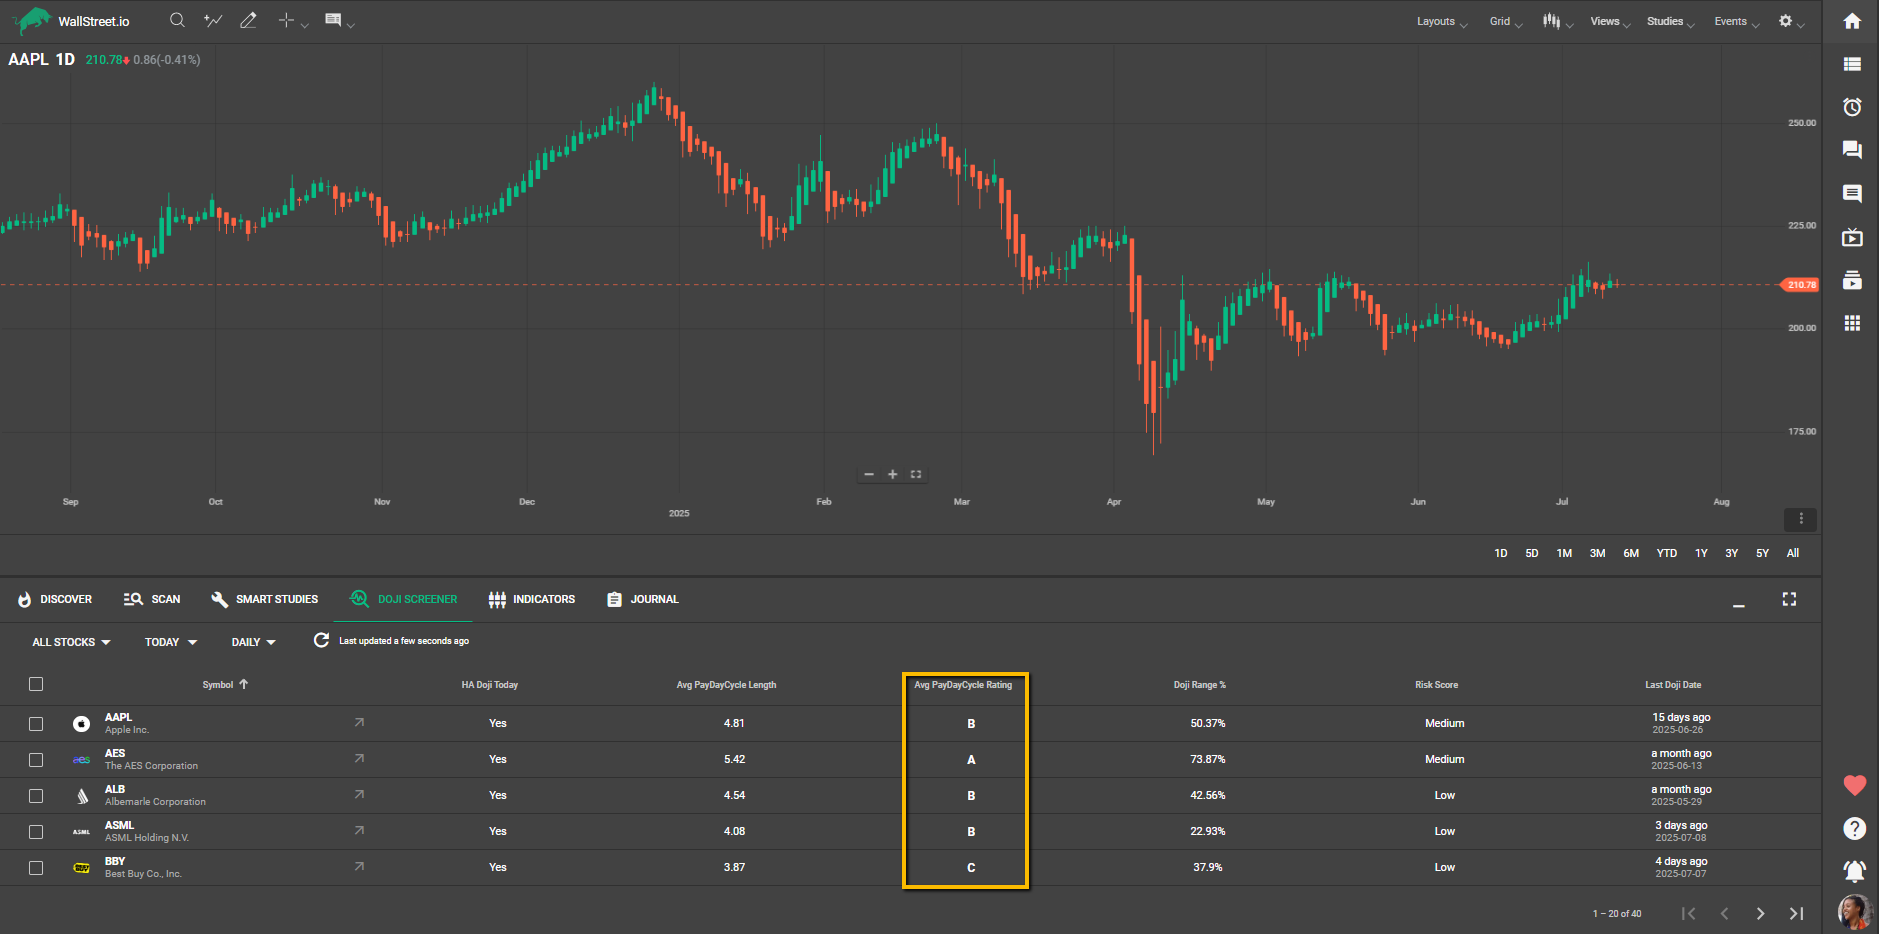
PayDay Cycle Rating
• Description: Assigns a grade to each detected Doji pattern based on the anticipated strength and duration of the ensuing PayDay Cycle.
• Grades:
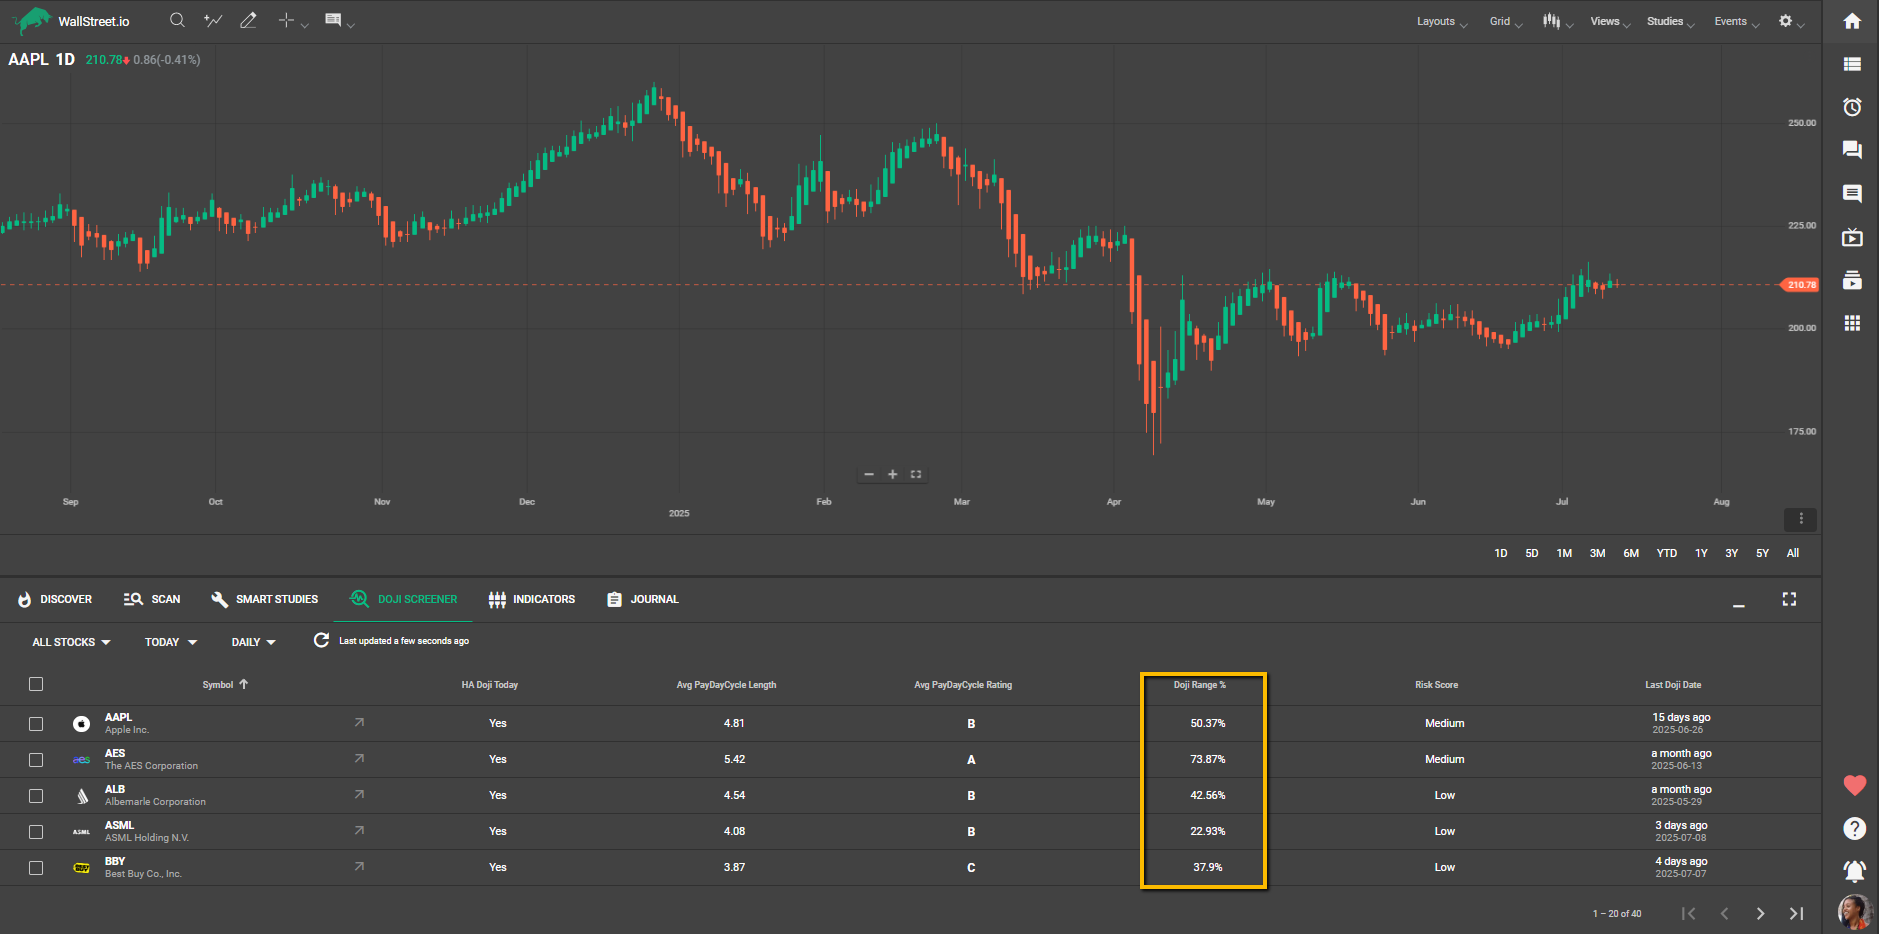
Doji Range %
Represents the size of the Doji candle as a percentage of the stock’s recent Average True Range (ATR). A high percentage may suggest increased volatility; a smaller percentage implies tighter, potentially lower-risk entries.
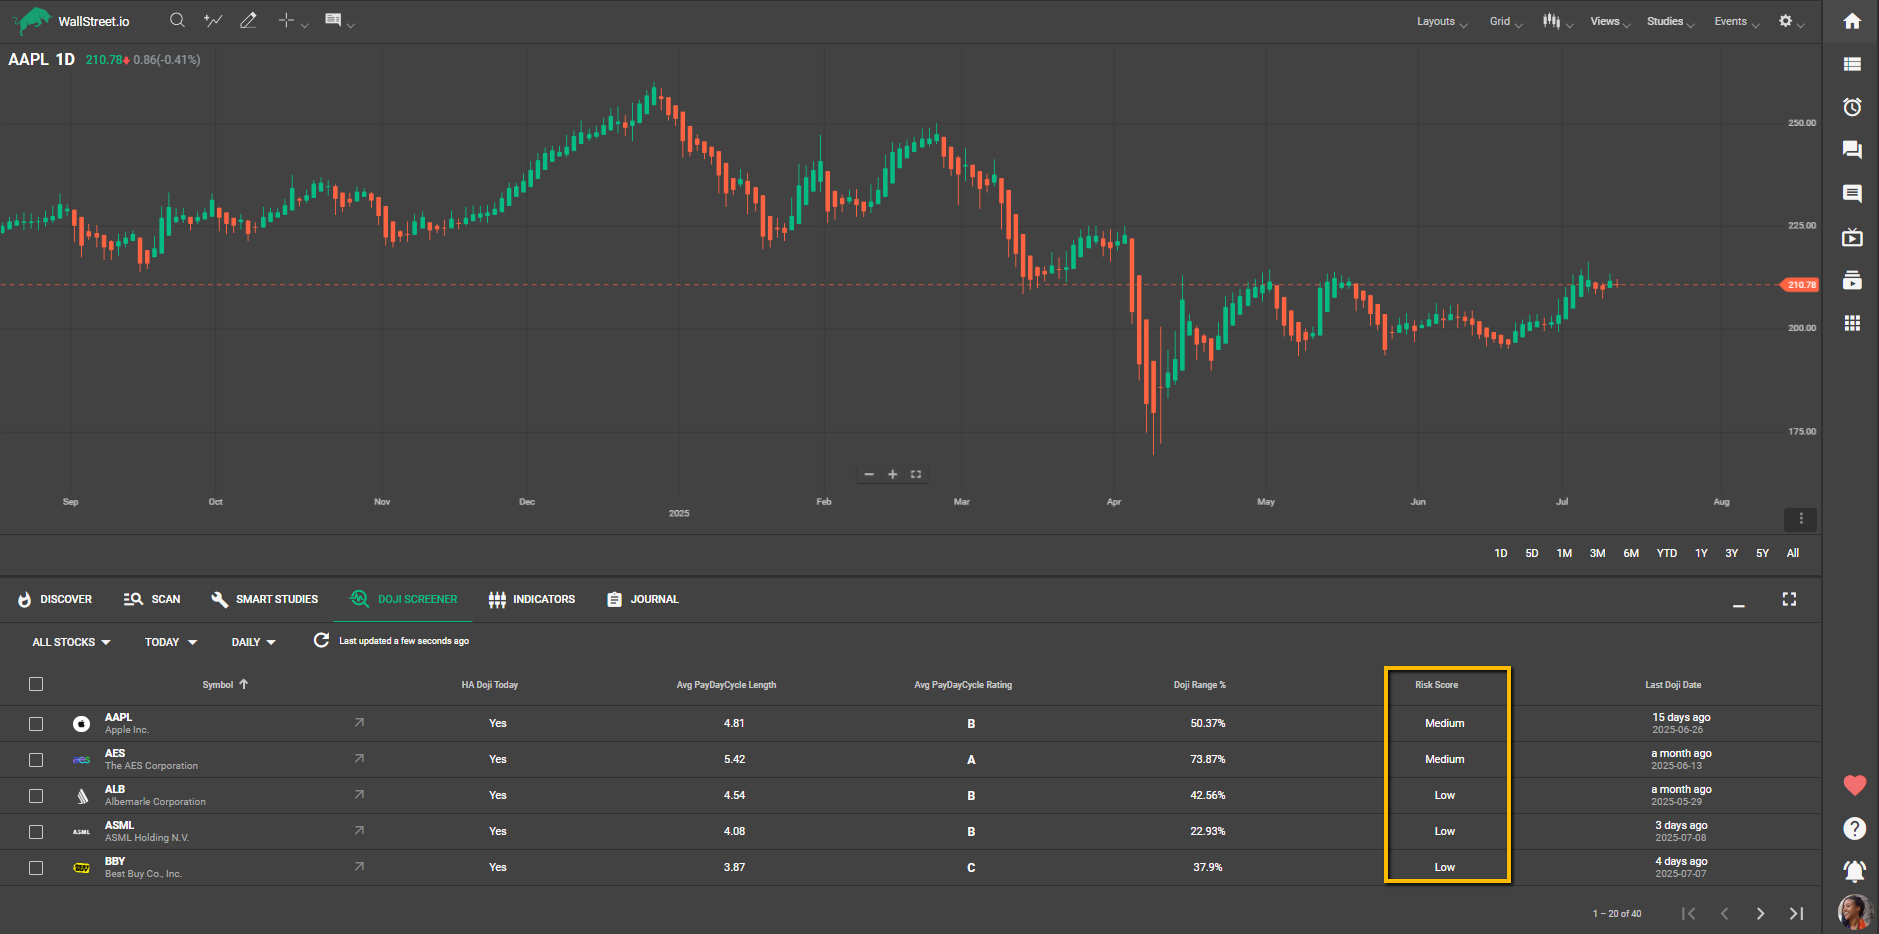
Doji Risk Score
• Purpose: Evaluates the risk associated with each Doji setup.
• Calculation: Considers the size of the Doji relative to the stock's 14-day Average True Range (ATR) and categorizes the setup's relative risk level:
• Benefit: Allows you to prioritize setups with favorable risk-reward profiles, focusing on low-risk, high-upside opportunities.
Last Doji Date
• Displays the most recent confirmed Doji date for each stock.
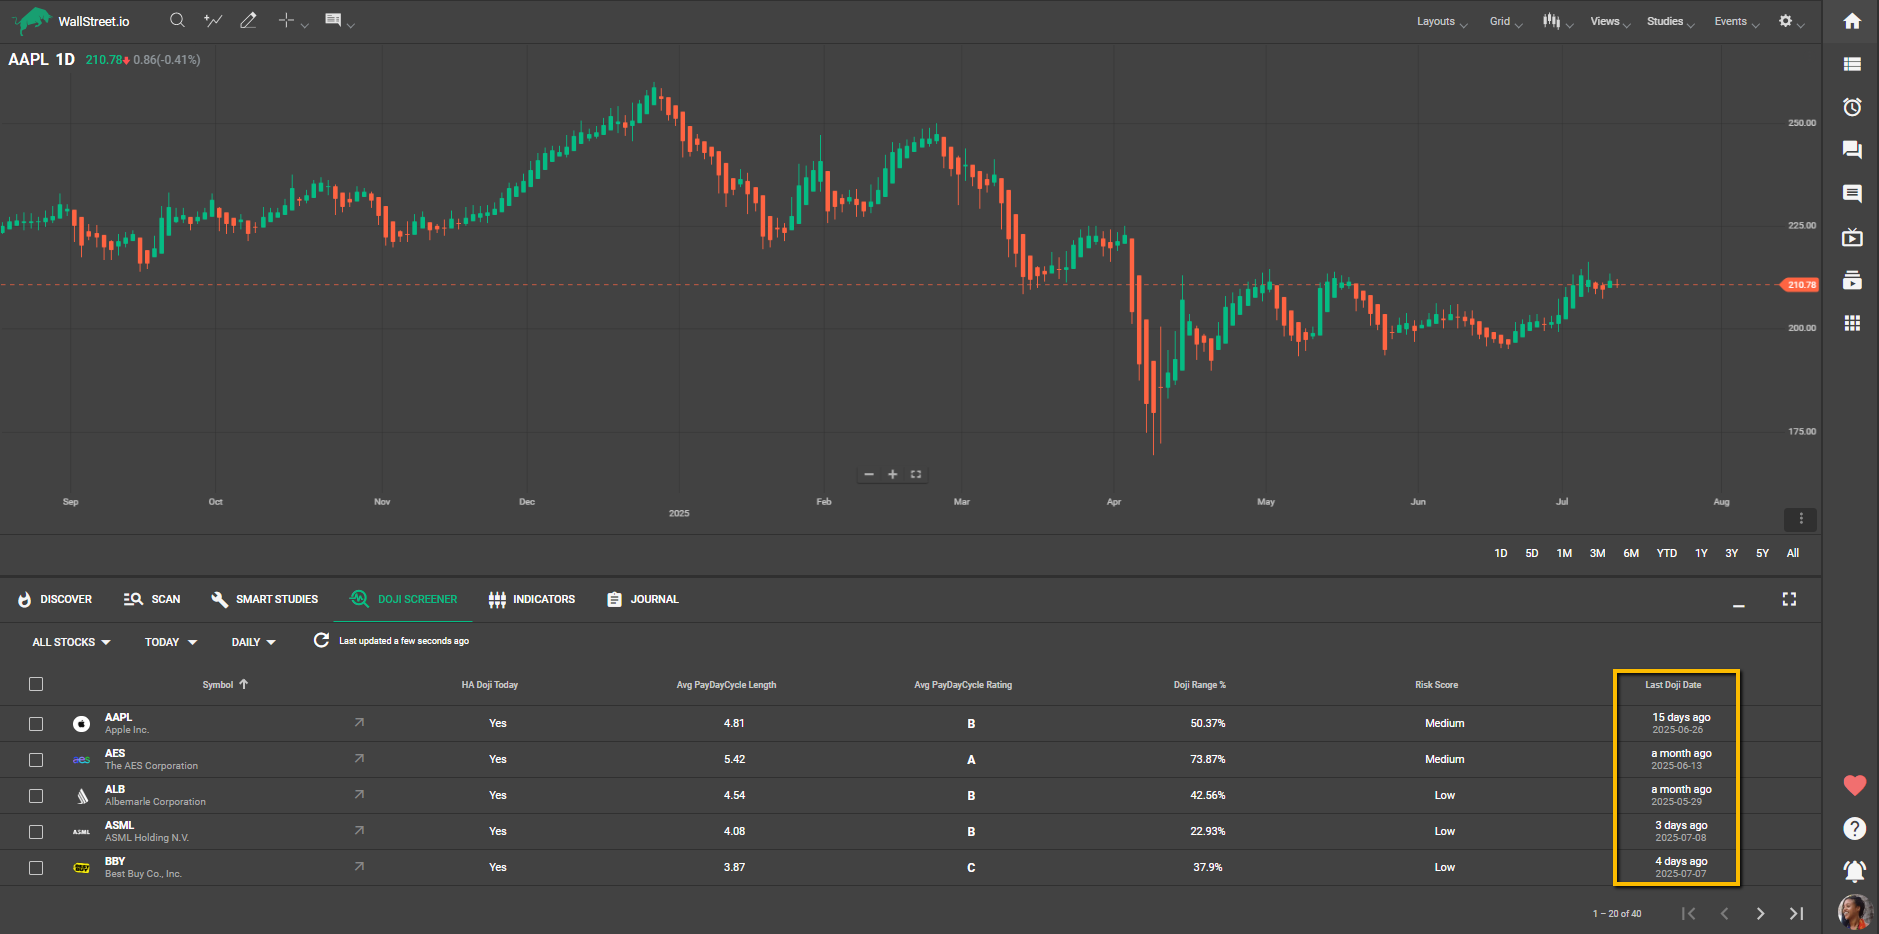
Important: This column only updates after the market has closed (i.e. after-hours). This means if HA Doji Today = Yes, the Last Doji Date will still reflect the most recently confirmed Doji prior to today, until today's candle is confirmed after market close.
Sorting the Screener
Users can sort the results by any column by clicking on the column header. For example:
• Click “Risk Score” to group trades from Low to High risk.
• Click “Doji Range %” to rank setups by volatility.
• Click “Avg PayDay Cycle Rating” to prioritize higher-rated opportunities.
The sort order toggles between ascending and descending with each click.
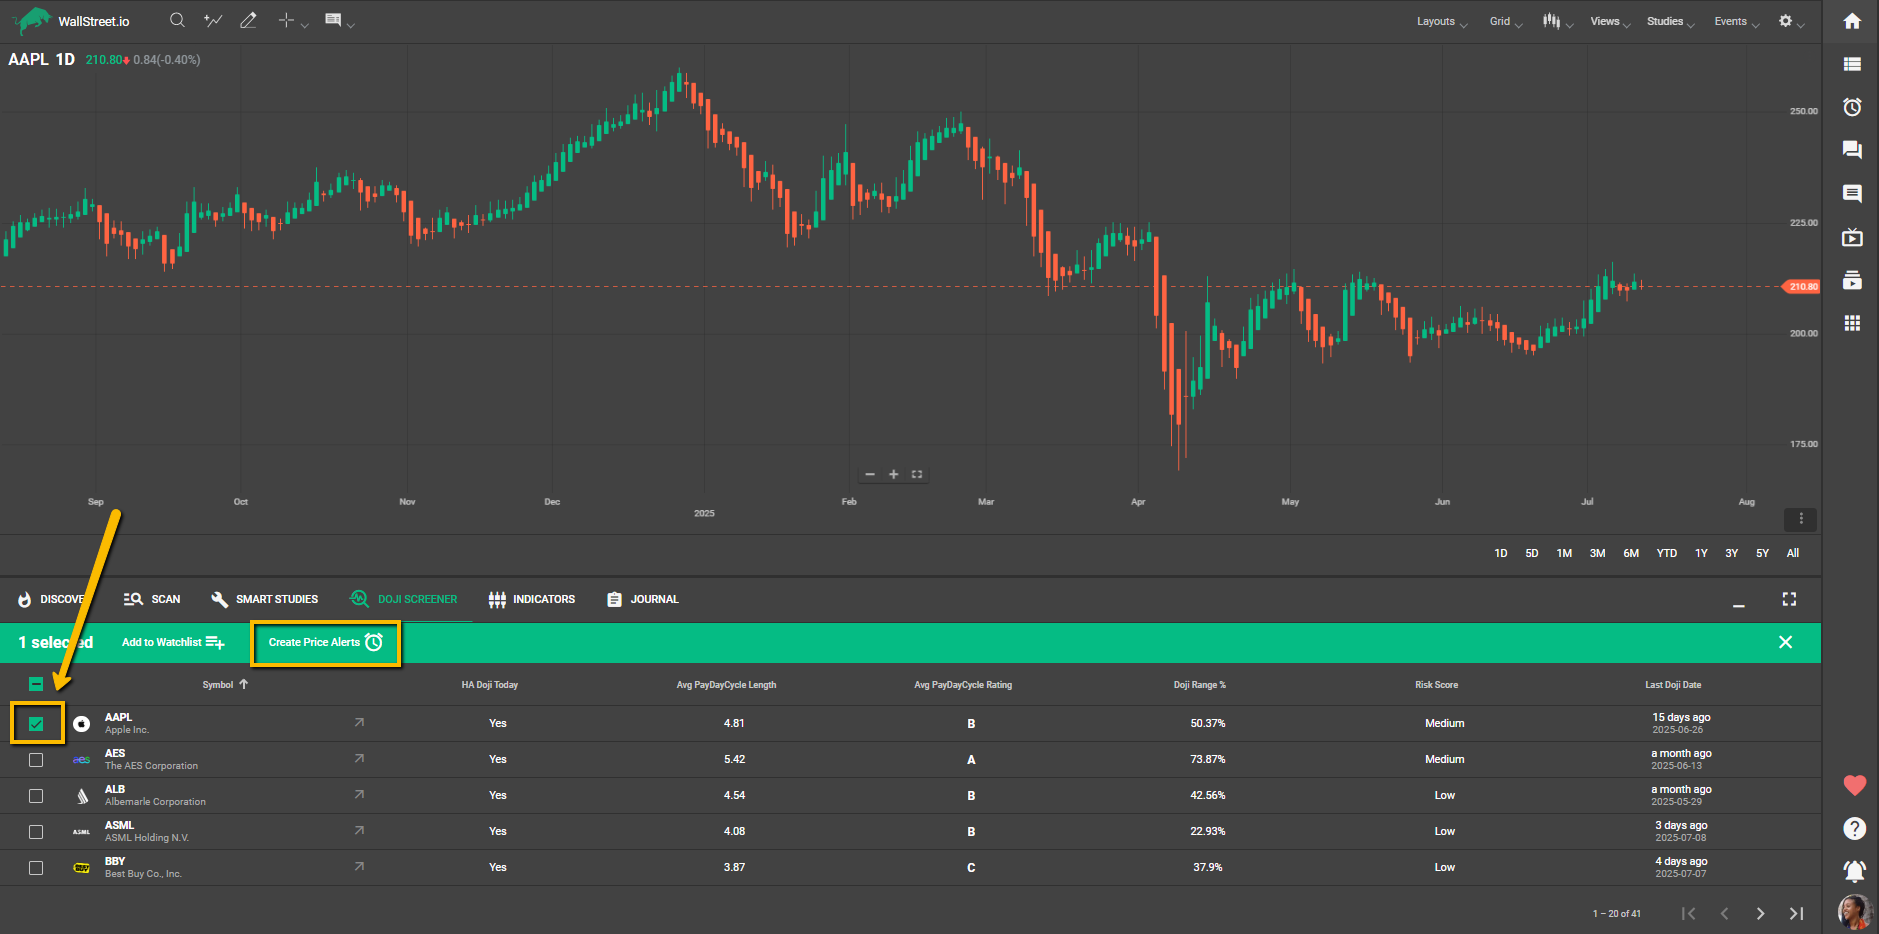
One-Click Doji Alerts
WallStreet.io’s One-Click Doji Alert system makes it easy to monitor potential breakout moves after a Doji.
How It Works
Timeframe Matching
Alert Limits and Behavior
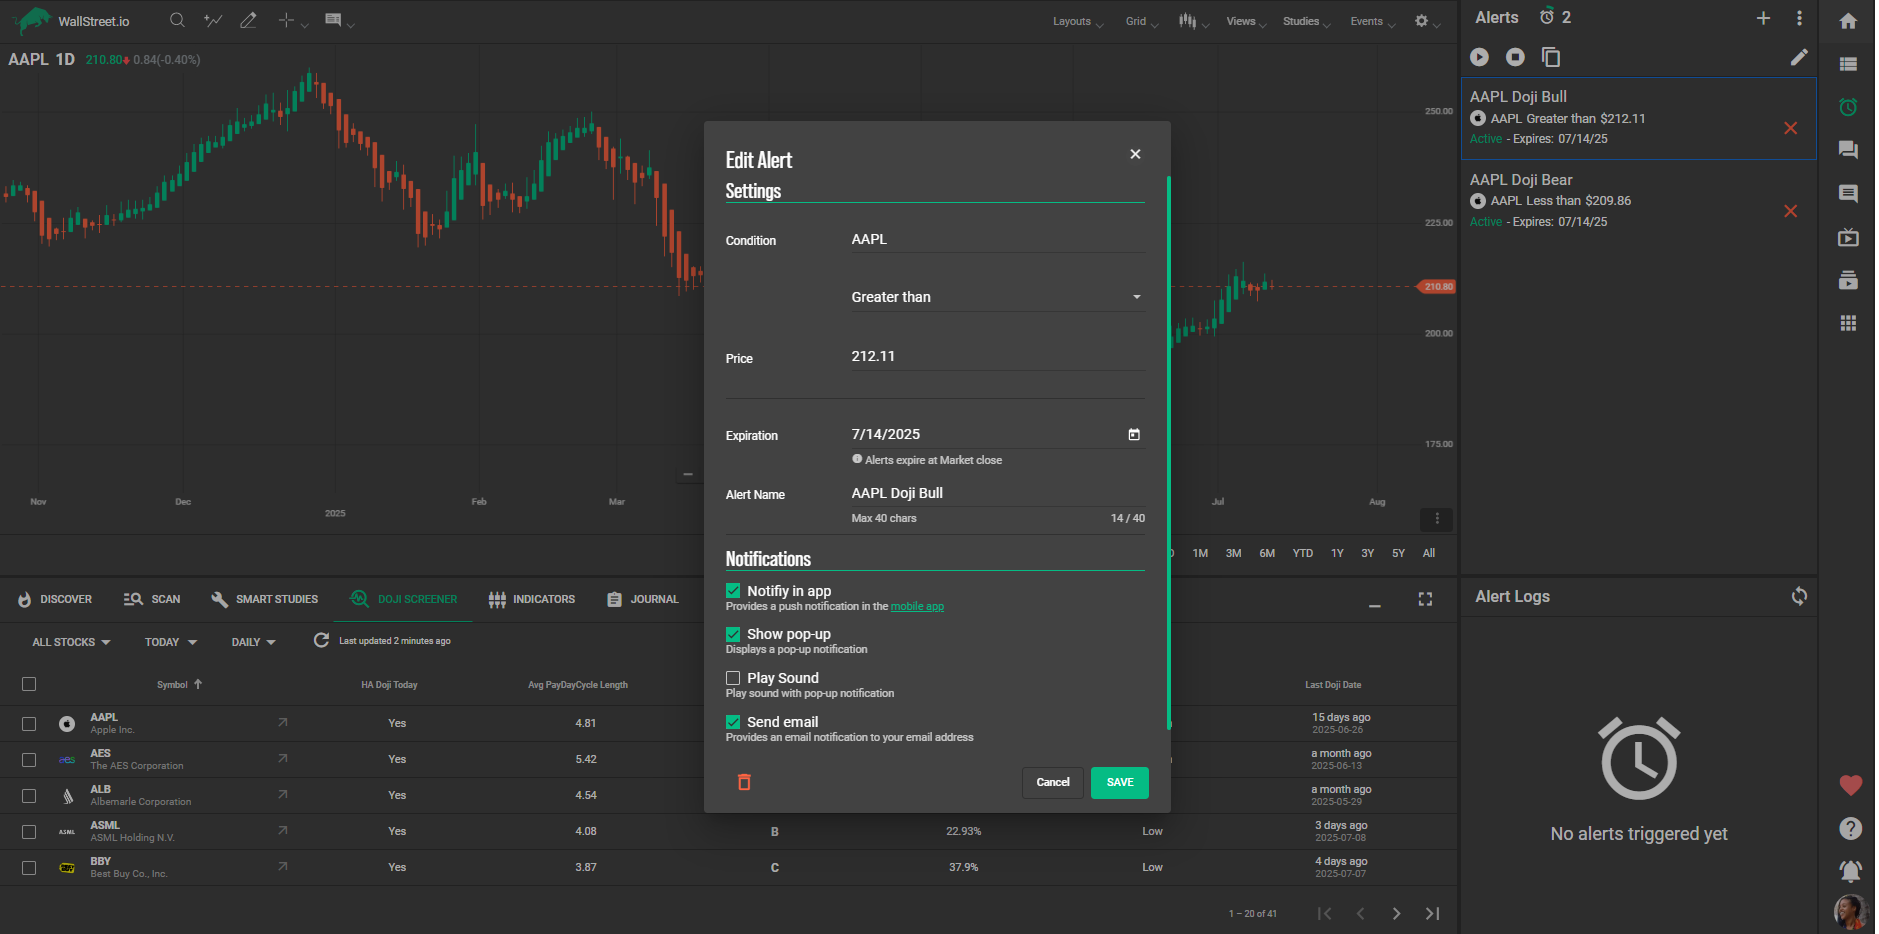
When you create a Doji Alert, you’re really creating two alerts: one for bullish, one for bearish, using Heikin Ashi logic.
If you’ve reached your alert limit, a notice will appear. To free up alert slots, you may delete old alerts.
Default Notification Settings
To speed up the process, alerts are created with default notifications:
Managing Alerts
To review or delete existing alerts:
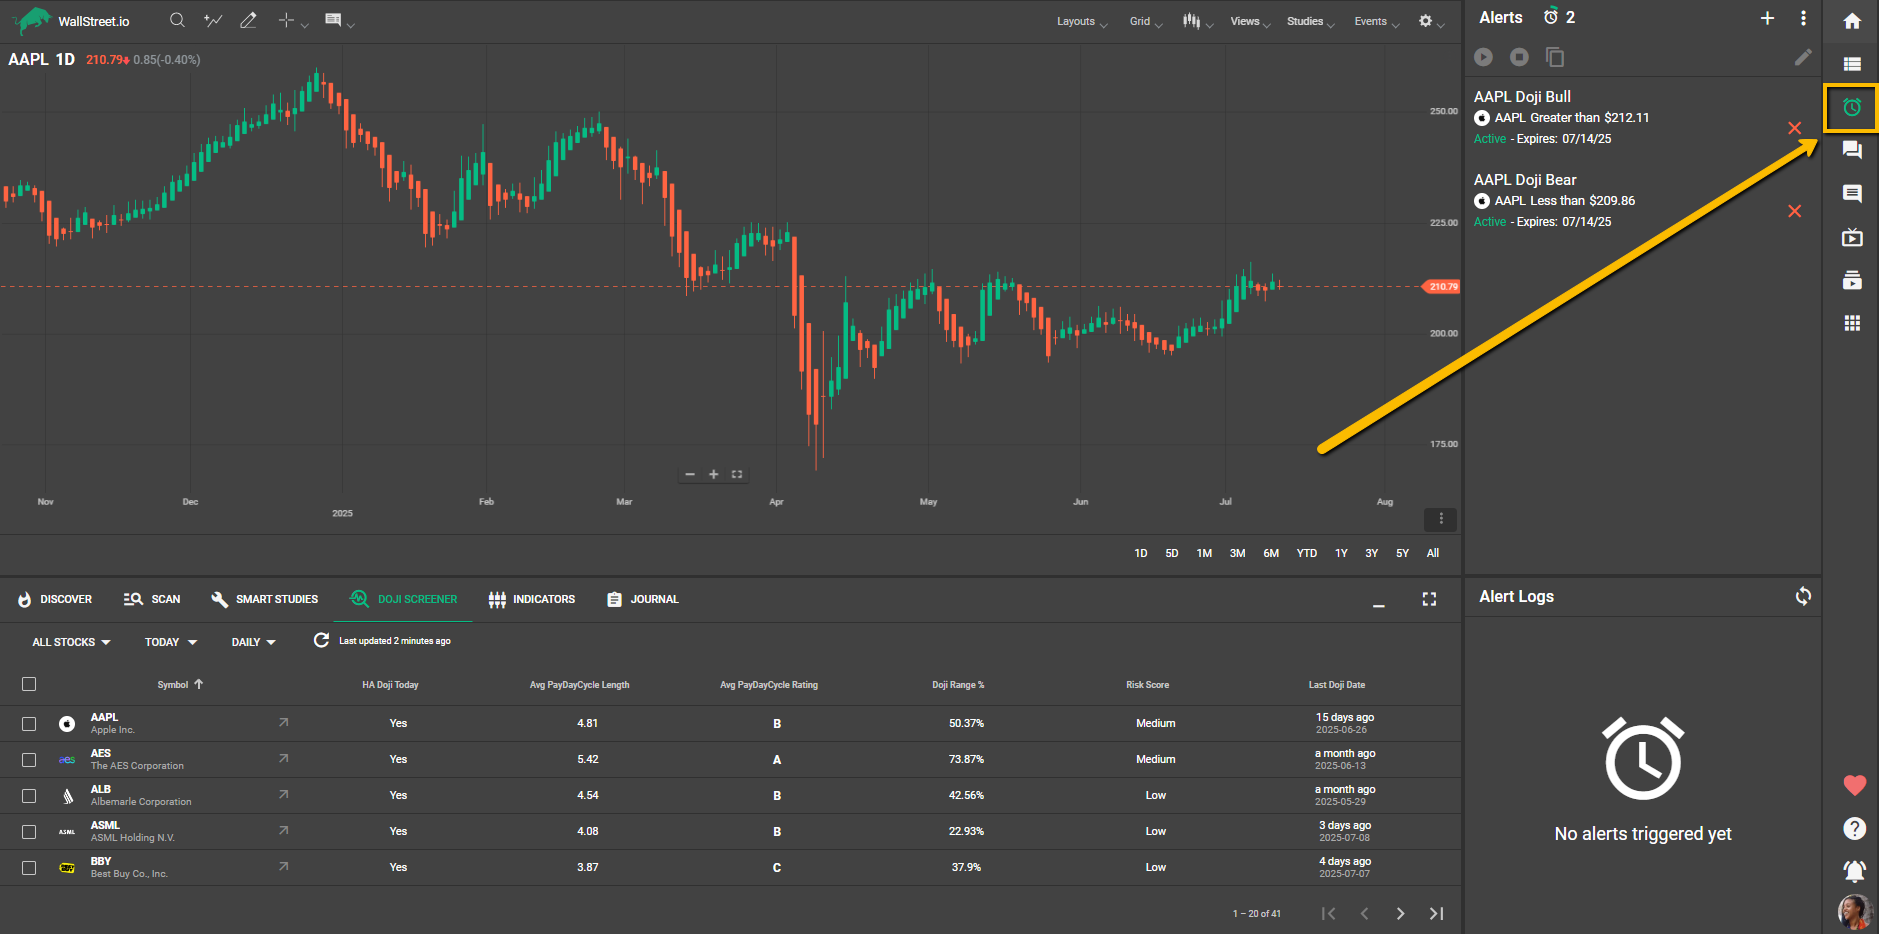
You can edit an alert afterward to: