What are PayDay Cycles?
So what are PayDay Cycles?
Truth is, the PayDay Cycle is more of a concept than a direct strategy.
Simply put, these are strategies resulting from stacking bullish and bearish signals from the Heikin-Ashi and MACD studies to either buy or sell. These result in natural and easily identifiable 4 to 8-day trends in an instrument.
Sometimes it can be a little longer, but most PayDay Cycles end before the eighth day. Using the Heikin-Ashi candlestick chart and the MACD as studies, you can get incredibly profitable strategies.
How do I find PayDay Cycle strategies on Wallstreet.io?
There are two ways of finding PayDay Cycle strategies on our platform: via the Discover Tab or the Scan Tab.
PayDay Cycle on the Discover Tab
The three dropdown menus on the Discover Tab will allow you to choose what strategies you’re looking for:
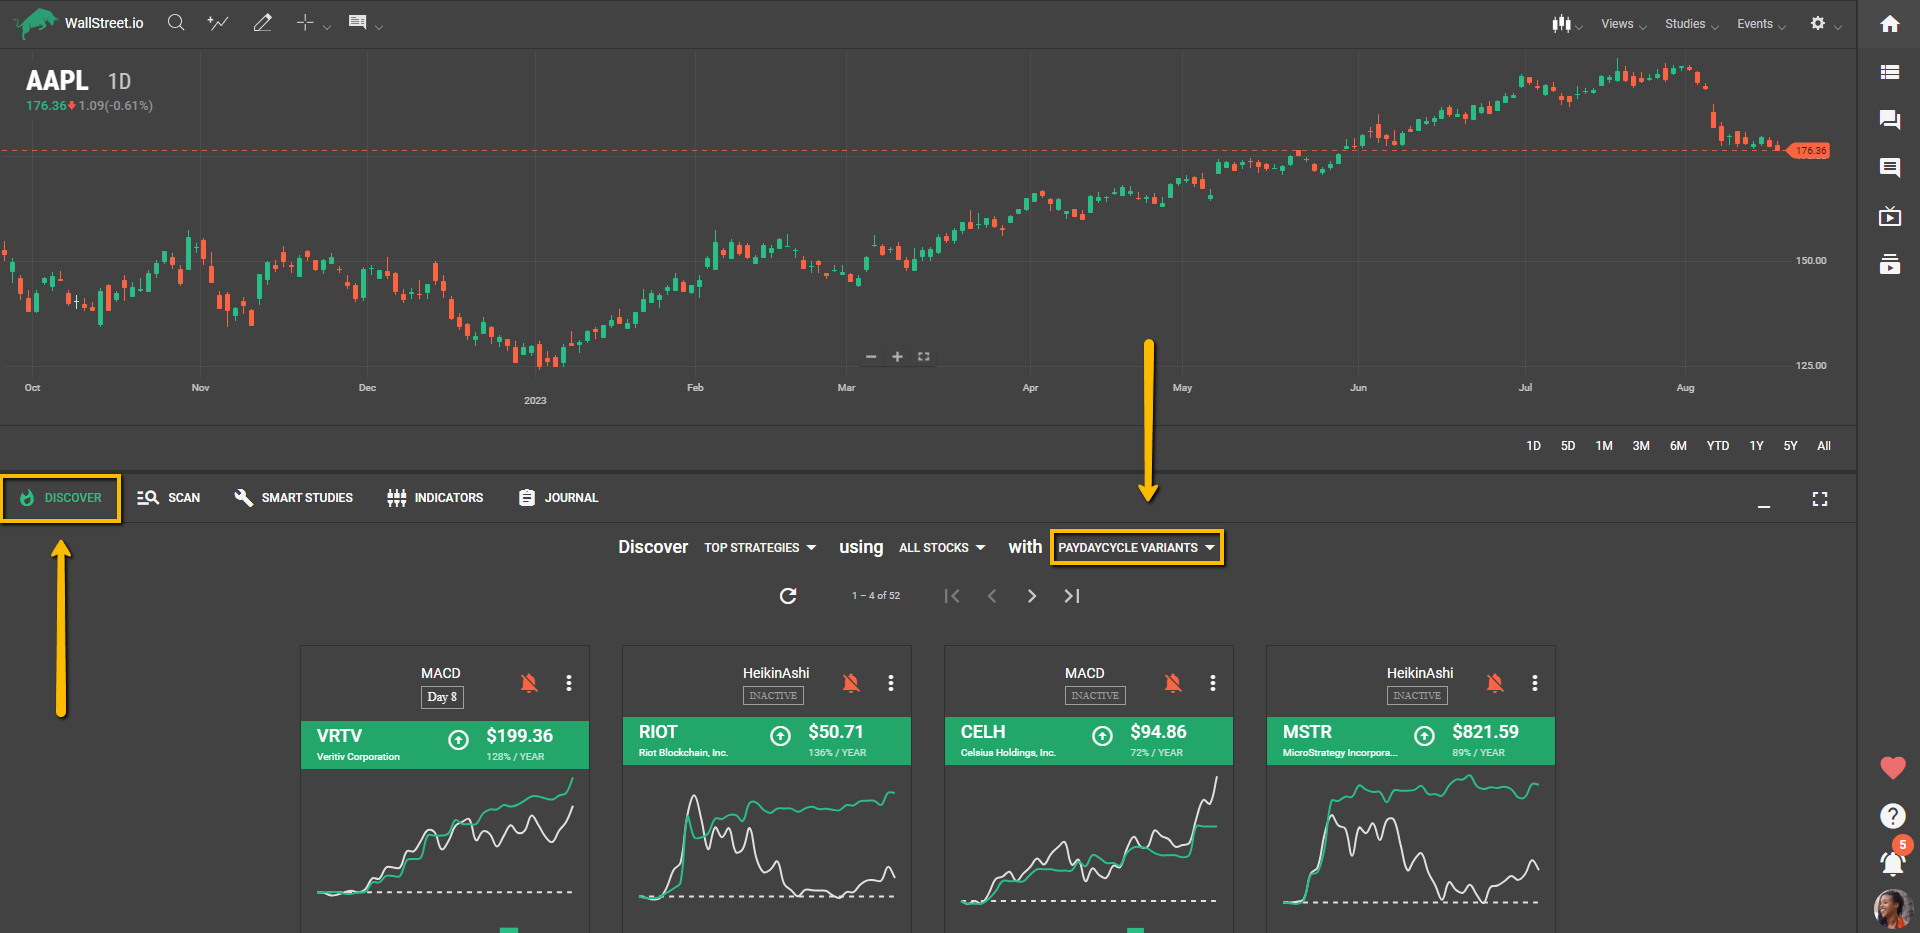
This method is best suited for beginner traders, who want to look for the Top Strategies using this trading concept with a few clicks. However, the Discover Tab works with very strict and proprietary criteria, which depending on market conditions, might not always retrieve results.
PayDay Cycle on the Scan Tab
After getting familiarized with its rules in our PayDay Cycle Masterclass (exclusive to Wallstreet.io members), you can use the Scan Tab along with the Filter tool to look for PayDay Cycle strategies on your favorite tickers:
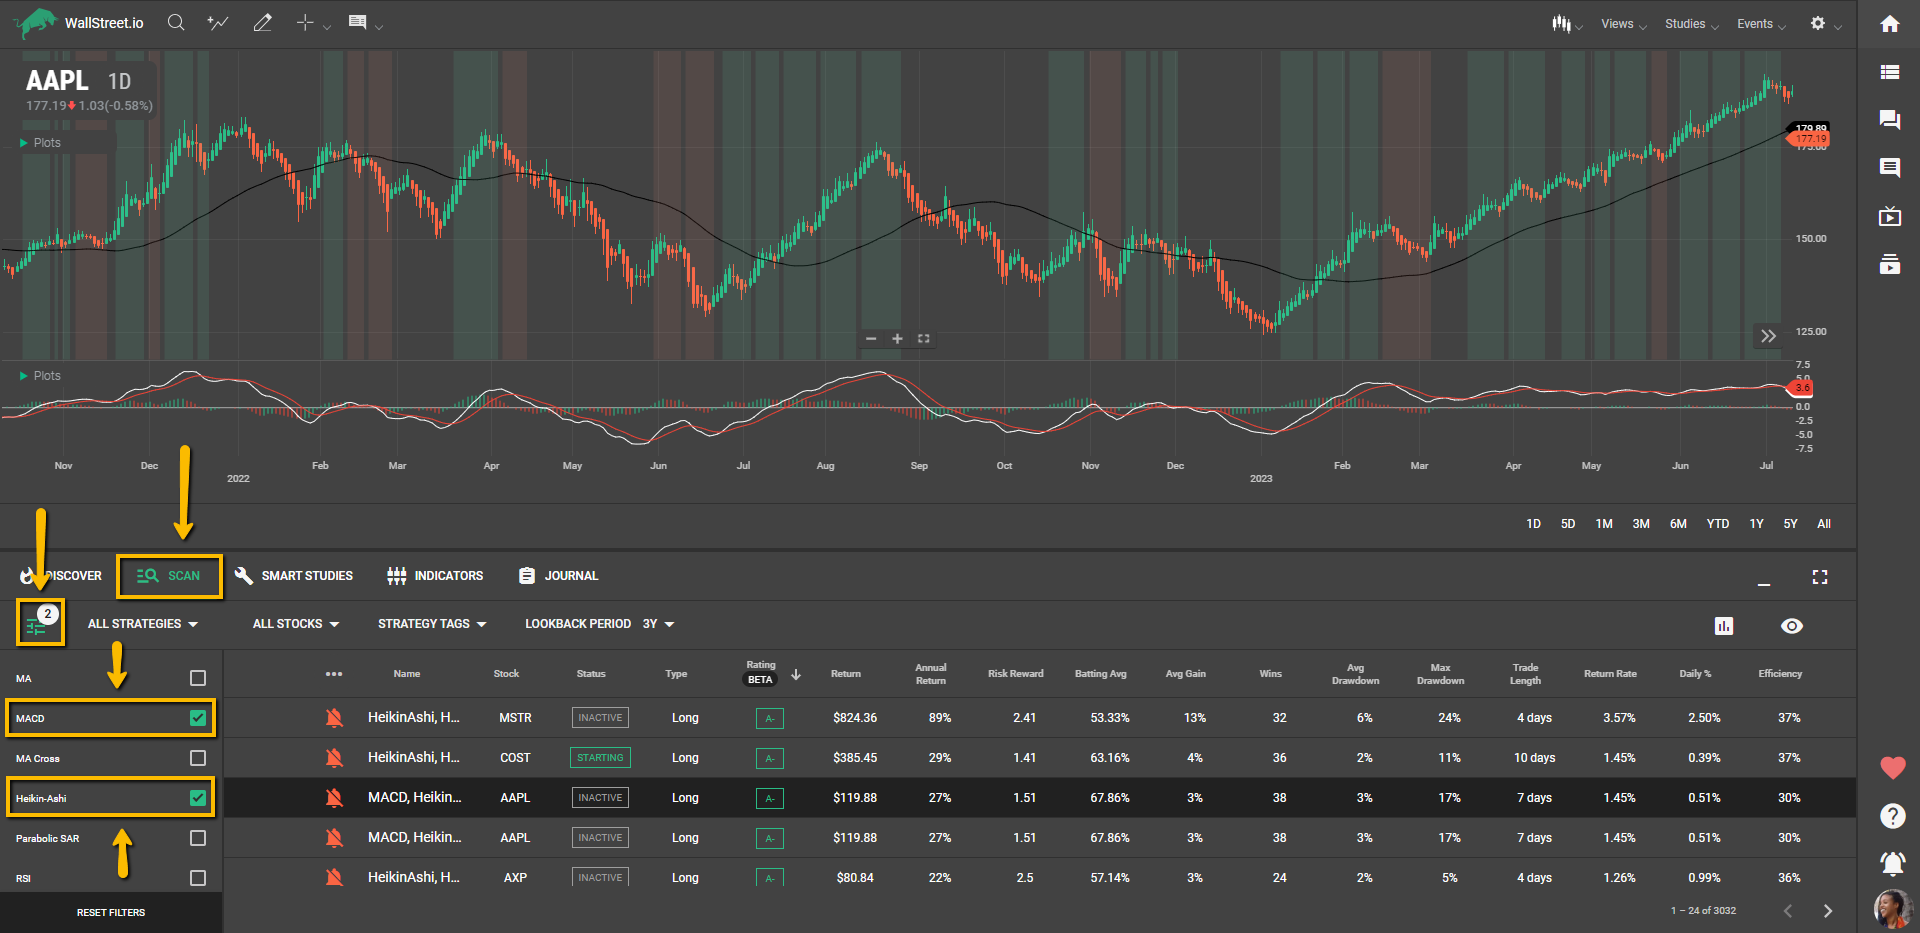
This way, you can review the strategies’ performance on the View Stats panel and decide which ones you want to receive an email alert about.
This other method is best suited for experienced traders who want to customize and experiment with different criteria combinations to maximize profits.
Explore More with the AAPLTrader Newsletter
Interested in elevating your trading strategy with expert insights and targeted recommendations? Our AAPLTrader Newsletter is your gateway to specialized knowledge and actionable strategies focused exclusively on AAPL stock. This premium seasonal add-on is designed to complement your trading experience by providing you with:
Accessible to all our members for an additional fee, the AAPLTrader Newsletter is an excellent resource if you're looking to focus specifically on AAPL or want to upgrade your trading with high-value insights. Combine this with the foundational knowledge from our PayDay Cycle Masterclass included in the All-Access membership, and you're set to refine your strategies and optimize your trading outcomes.
Click on the link below to log in, learn more, and sign up: