Discover Tab
The Discover Tab is an intuitive, user-friendly feature of Wallstreet.io that makes discovering crowd-sourced trading strategies straightforward and accessible. This guide provides an overview of the tab, its functionalities, and how you can best use it to your advantage.
We rank each strategy through a twelve-factor weighted system and pull the top results out of our database of millions of strategies, then display those results sorted by annualized return. Every Strategy shown in the Discovery tool is only the best.
Understanding the Discover Tab
Upon clicking on and opening the Discover Tab, you will be presented with three dropdown menus:
 Top Strategies/Starting Strategies: Choose between the highest-rated strategies on our platform, or the best strategies to get started instantly.All Stocks/Current Stock/Current Watchlist: Tailor your search according to all stocks, a specific stock, or your curated watchlist.All Strategies/PayDay Cycle variants: Explore all the strategies available or specifically focus on variations of the PayDay Cycle - a unique trading concept developed by Micah.
Your search results will be presented as Strategy Cards, giving you a comprehensive, at-a-glance view of each strategy. They include details about each strategy, such as profit graphs, backtesting results, annual seasonality and more.
Let’s take a closer look!
Strategy Cards
Each Strategy Card includes the following information:
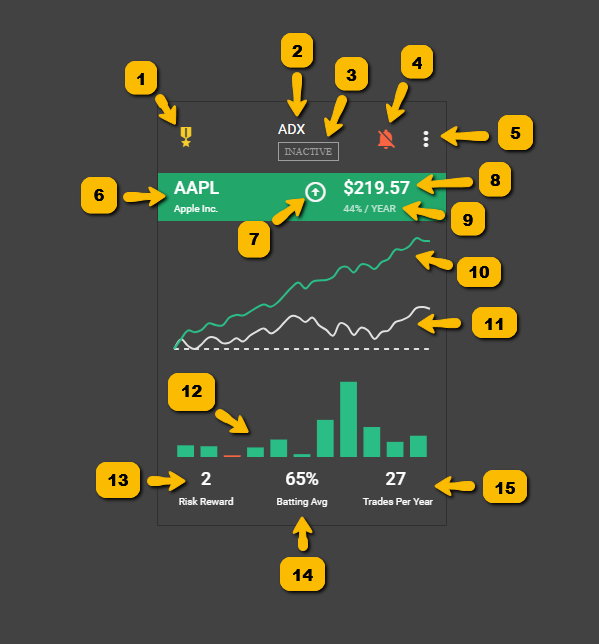 1. Ranking: We use a proprietary twelve-factor weighted system based on various criteria to evaluate and rank each strategy. The medal icons or numbers displayed on the upper-left side of the Strategy Cards indicate the strategy's ranking within all strategies found within our platform.
 A gold medal represents the first rank, silver represents the second rank, and bronze represents the third rank. A number represents the ranking position that’s not within the top three.
2. Strategy’s main Smart Study: This indicates the individual Smart Study or group used to trigger the Entry signal for this strategy. 3. Strategy Status: The status of a Strategy Card represents the current phase of a given trading strategy. Here's a simplified explanation of each status:Starting: This status means the conditions for a buy signal have just been met. The indicators in the strategy are hinting it's an optimal time to consider entering a trade.Active: An active status suggests the strategy is in progress - you have entered the trade and it's now being monitored for an exit signal.Ending: This status indicates that the exit conditions of the strategy have been met. It's potentially the optimal time to sell and exit the trade.Inactive: An inactive status implies that none of the conditions for buying or selling have been met. The strategy is currently not in a position to execute a trade.Each status is dependent on the underlying indicators and their respective conditions. Just as in a traffic signal system, each status guides traders on when to start (enter the trade), continue (hold the position), stop (exit the trade), or do nothing.
4. Strategy Notification Alert Bell: Here you can enable Strategy Notification email alerts that you receive when you follow a strategy. These notifications inform you when the strategy begins and ends.5. Strategy Card menu: By clicking on the three-dot icon at the top-right of the Strategy Card, you’ll access three options:View Signals: This allows you to see the specific Smart Study signals and details of the strategy on the back of that Strategy Card. You can also left-click anywhere in the strategy card and it will turn the card to show you the strategy signals on the reverse side. Click again to return to the main charts.Share Strategy: This allows you to share the strategy on the Community Wall and add a note to initiate a conversation.Go To Strategy: This option loads the strategy into the Smart Studies tab, the Chart page, and displays the results in the View Stats panel. You can also follow the strategy by clicking the alert bell below the Smart Studies Tab.6. Ticker and Symbol name: These identify the financial instrument involved in the strategy. Sometimes, right next to the ticker symbol we also show you how this strategy ranks in terms of all strategies for just the stock, using the medal icon ranking system.7. Strategy Type: This shows you if the Strategy Card belongs to a Long/Bullish strategy or a Short/Bearish strategy.8. Return: This shows you the amount of money you would have made if you bought and sold 1 share of stock using the strategy in the Smart Studies tab.9. Annual Return: This is the net profit from following the strategy, expressed as a compound annual growth rate.10. Smart Studies Results: The performance results of trading one share of the stock or ETF based on the strategy's signals. It is represented by a green line on the Strategy Card. The green line shows you the backtest results of trading one share of the stock or ETF on each starting and ending signal.11. Buy and Hold Results: The performance results of buying and holding one share of the stock or ETF over the same period. It is represented by a grey line on the Strategy Card. The grey line shows the results of buying and holding one share over the same period.12. Annual Seasonality: A bar chart displayed below the graph on the Strategy Card, showing the seasonal performance pattern of the strategy and buy and hold approach over the past 10 years.13. Risk Reward: This provides information about the average percentage win and loss associated with the strategy. If you hold your mouse over the Risk Reward in the lower left corner, it provides you with information about the average percent win and loss.14. Batting Avg: This represents the number of wins and losses associated with the strategy over the past 3 years. If you hold your mouse over the Batting Avg, it displays the number of wins and losses over that period of time.15. Trades Per Year: This indicates the number of trades and the average trade length over the past 3 years. If you hold your mouse over Trades Per Year, it displays the number of trades and trade length over that period of time.
Final thoughts
The strategies shown in the Discover tool are constantly evolving and changing each day. All new strategies added to our system will automatically be evaluated and added if it passes as a top strategy as well as every strategy already in our system is recalculated and checked.
The Discover Tab allows you to explore top-rated strategies or get started with simple strategies instantly. However, its algorithm is designed to maintain a high standard of results, which means you might not always find results for your specific criteria.
If you get a message that no strategies are found for a specific stock, that just means there are no strategies that are in the top strategies category. It does not mean there are no strategies for that stock on the site. For more advanced and customizable search options, consider using our Scan Tab and Filter Tool.