Moving Average Cross
Definition
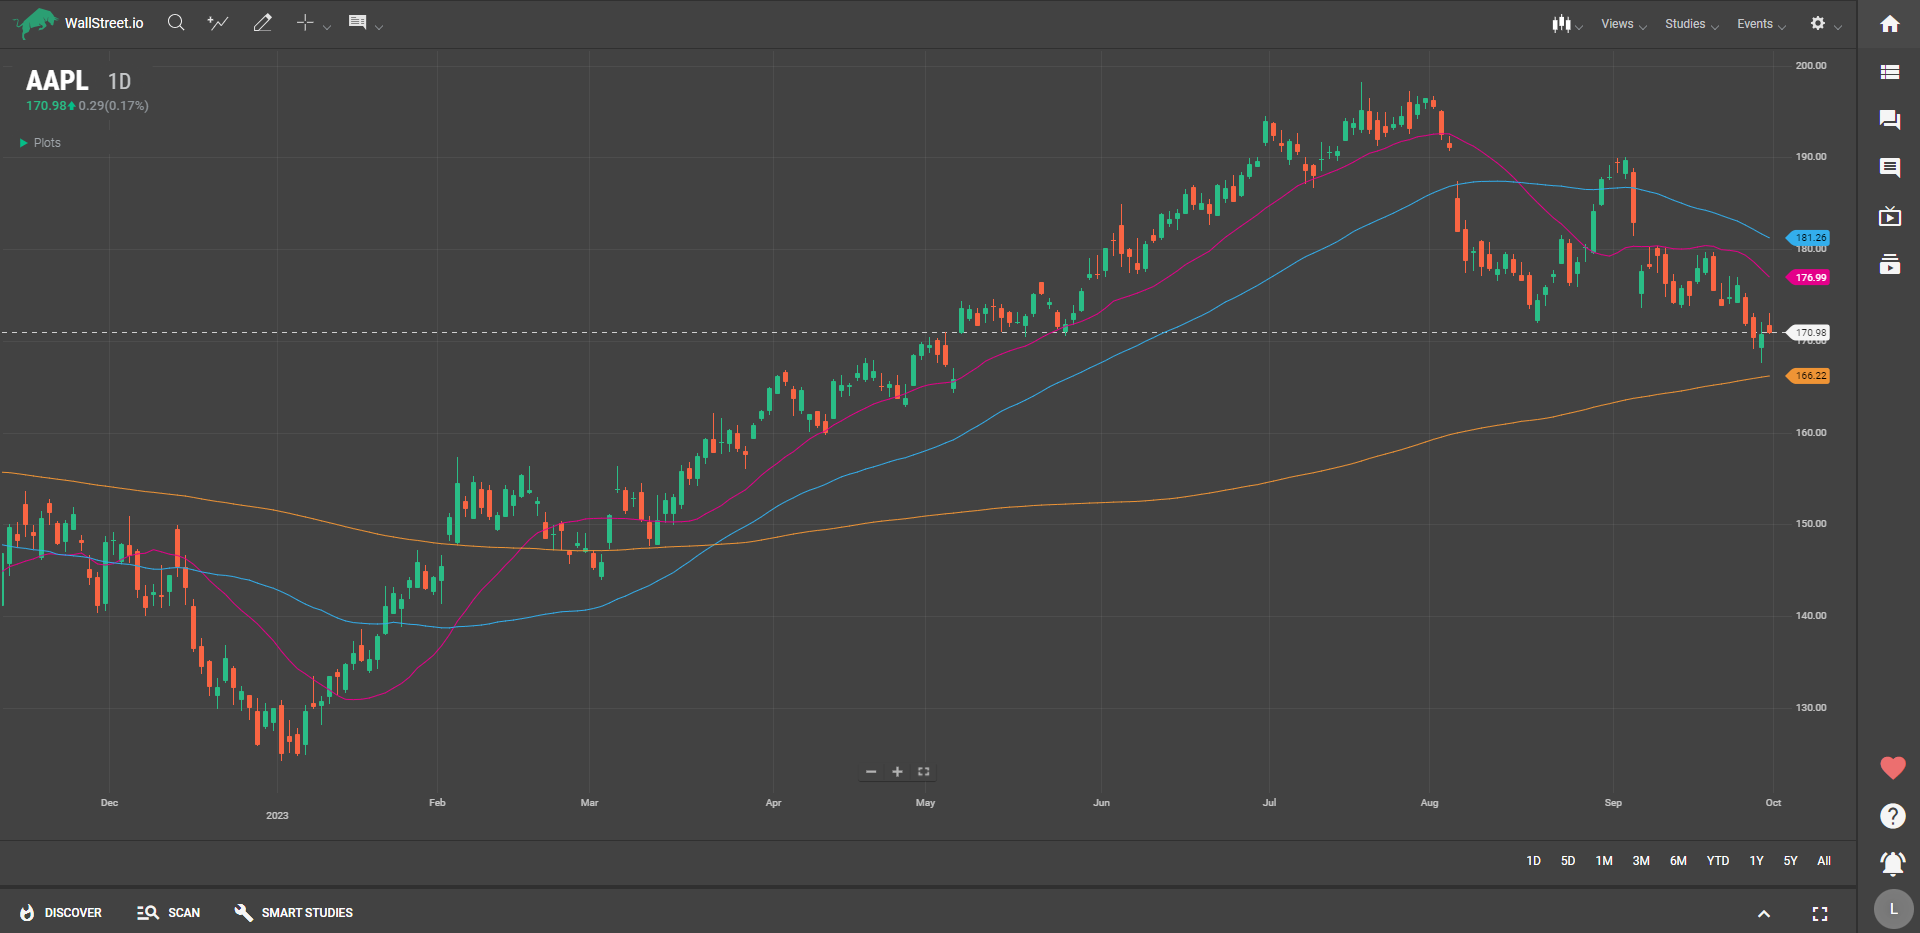
The Moving Average Cross employs three Moving Averages (typically 20, 50, and 200 periods Simple Moving Averages by default) to signal shifts in market trends. When a shorter-term moving average crosses above a longer-term moving average, it often indicates an upward trend, and vice versa.
Suggested Trading Use
Watch for the moments when the shorter moving averages cross the longer ones. If the 20-period moving average crosses above the 50-period or 200-period moving averages, it's often seen as a bullish sign, and you might consider entering a long position. On the flip side, if the 20-period moving average crosses below the longer ones, it could be a bearish signal, suggesting it might be time to sell or enter a short position. Utilize these cross signals to time your entries and exits more effectively.