Strategy Chart Add-Ons Reference Guide
These useful options allow you to visualize data element from the Strategy under the Smart Studies tab on the Chart.
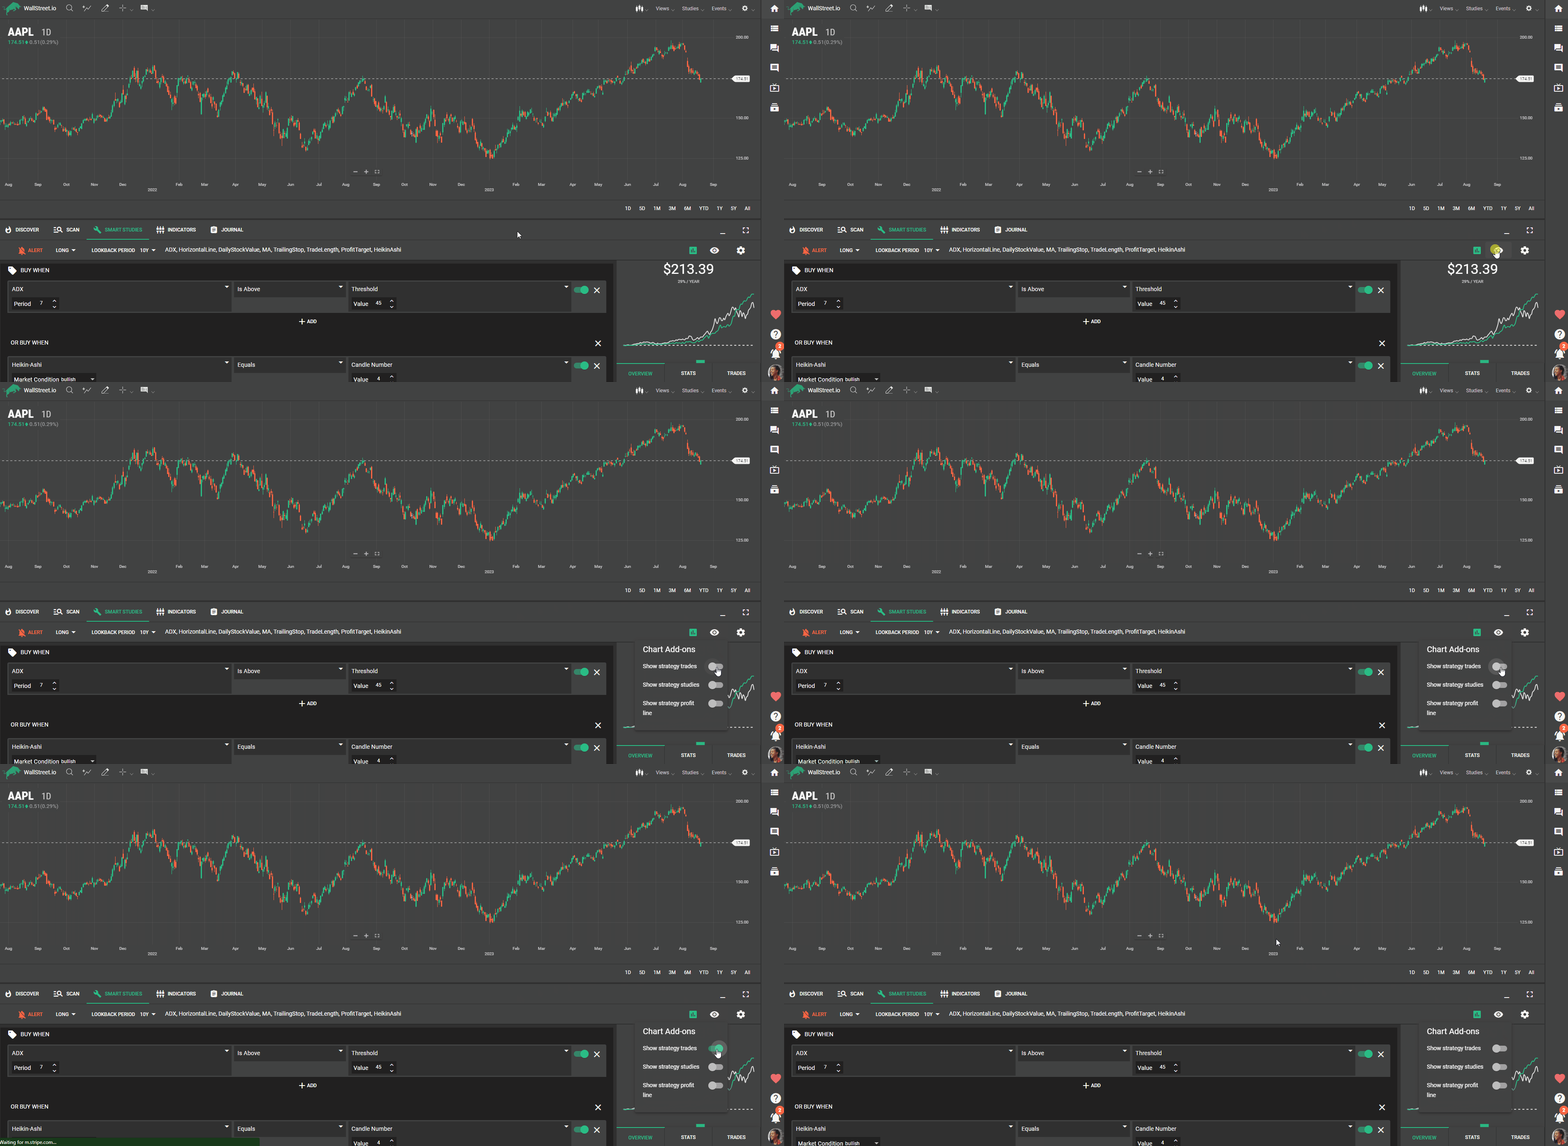
Show strategy trades
The first setting allows you to turn the shading for the Strategy trades on and off on the chart, in case you want to see the specific start and stop dates of the traders reflected on the chart (mainly to visualize how well a given strategy caught the desired moves):

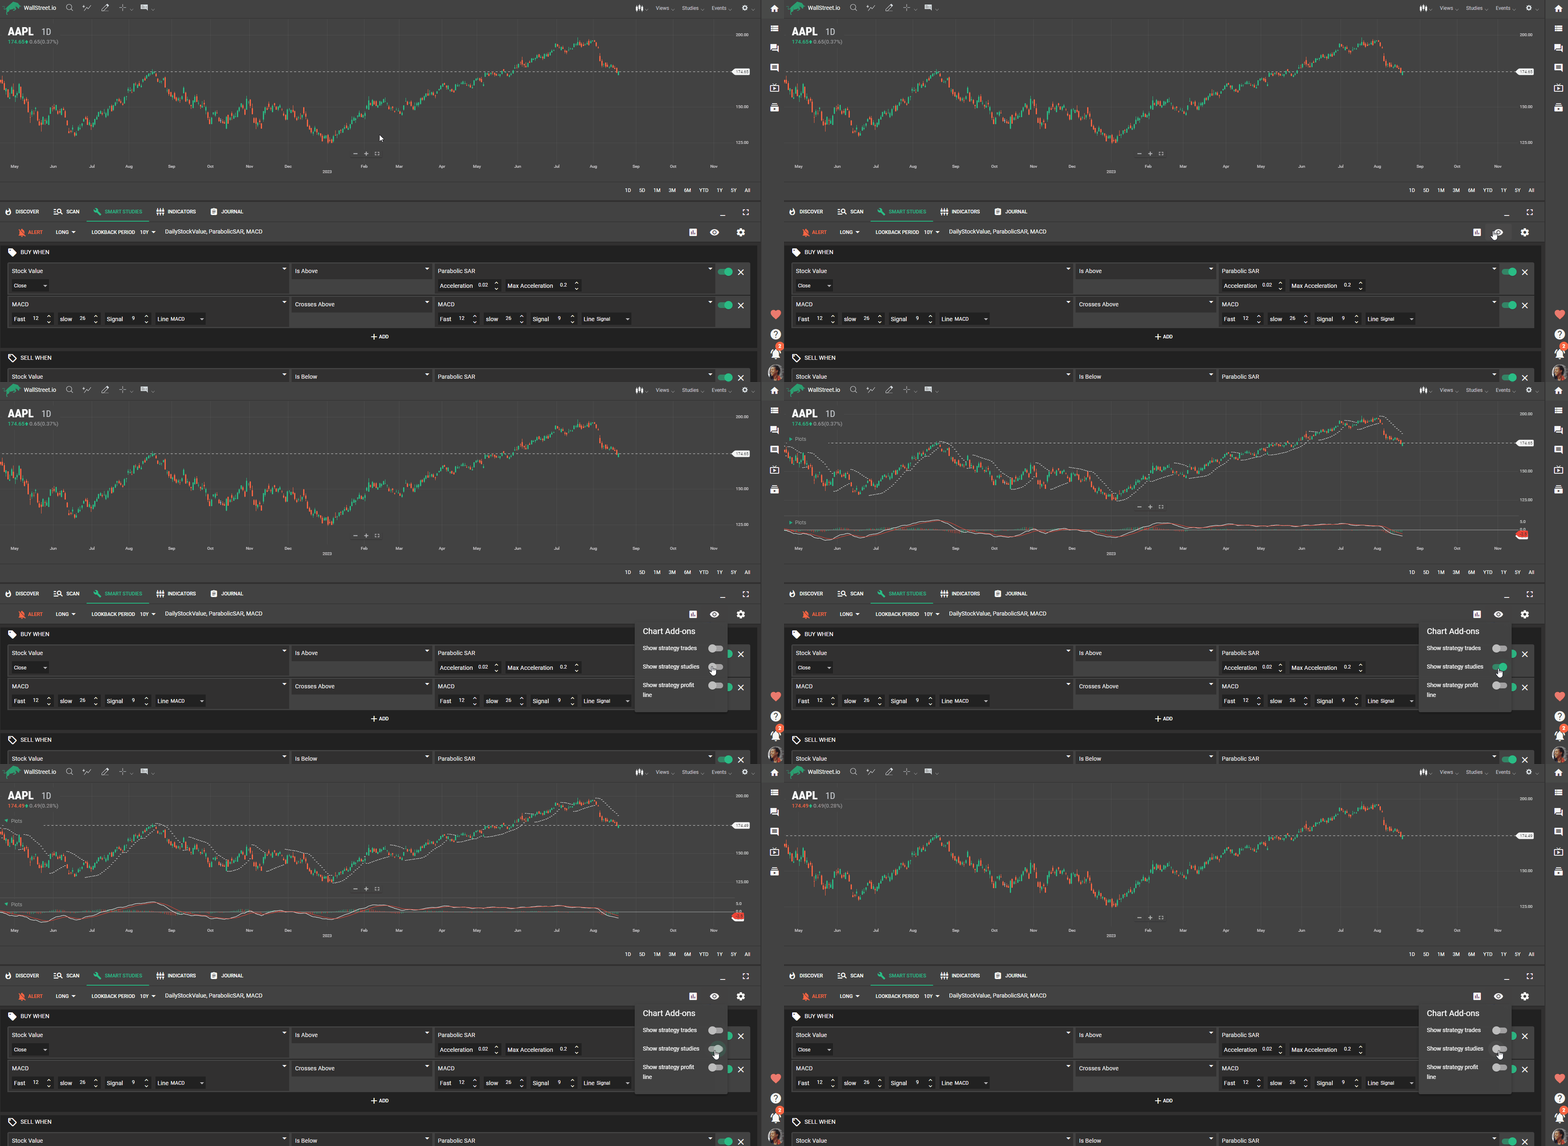
Show strategy studies
The second Strategy setting allows you to show the Studies from the loaded strategy on the chart (except the Heikin-Ashi candles, which will need to be manually selected from the Chart Types menu bar above the chart itself):

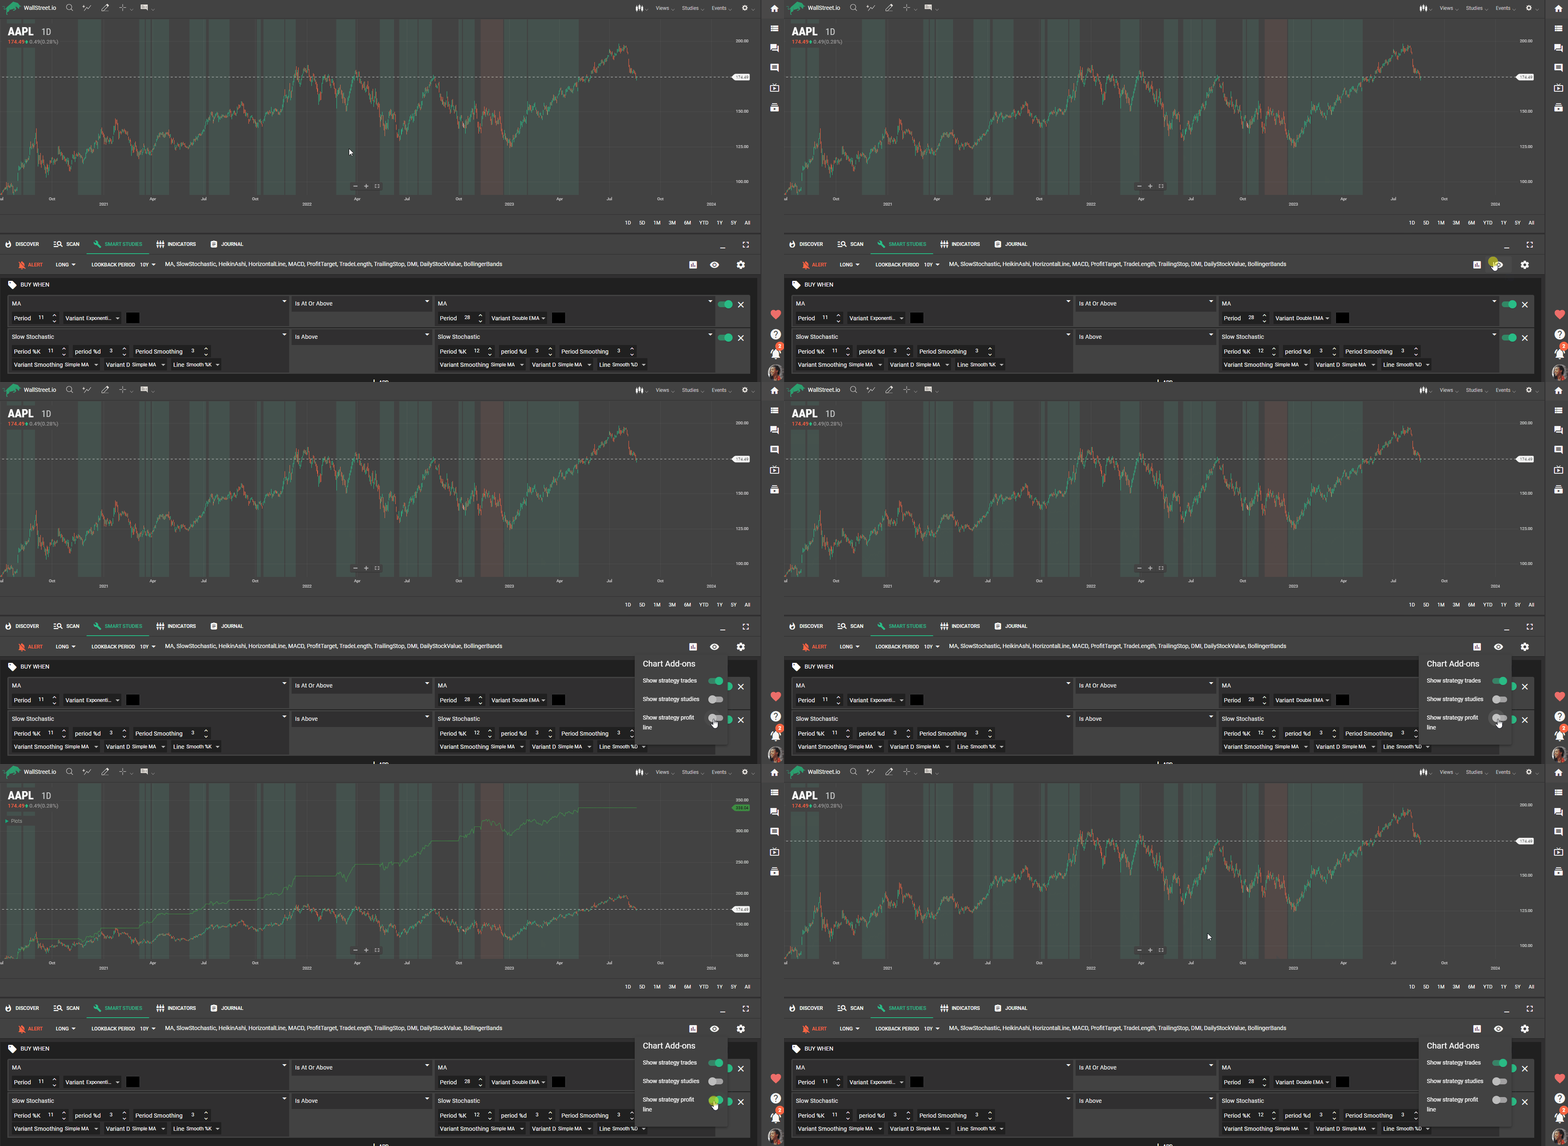
Show strategy profit line
With this third option, you're able to visualize a Strategy profit line, which is calculated according to how much profit or losses you'd get with the strategy in comparison to the actual price action from the chart:


 Discover Tab Reference Guide
 Discover Tab How-To Guide
 Smart Studies How-To Guide
 Smart Studies Reference Guide
 Scan Tab Reference Guide
 Scan Tab How-To Guide
 Watchlists How-To guide
 Watchlists Reference Guide
 Chatrooms Reference Guide
 Community Wall How-To Guide
 Community Wall Reference Guide
 Streams Reference Guide
 Streams How-To Guide