PayDay Cycles & Heikin-Ashi Charts
What this helps you do
This article helps you understand why PayDay Cycles are built on Heikin-Ashi candles, how to read those candles on your chart, and how to recognize when a PayDay Cycle is healthy, tired, or starting to shift. By the end, you should be able to glance at a Heikin-Ashi daily chart on WallStreet.io, spot the current PayDay Cycle, and have a clearer sense of whether you want to be long, short, or in cash around it.
Quick recap: PayDay Cycles in one line
A PayDay Cycle is a short trend in a stock, usually lasting around four to eight trading days, where price moves in one clear direction.
The “PayDay” part is about stacking those moves into a meaningful swing. The “Cycle” part is about recognizing that these runs start, strengthen, slow down, and end, over and over again.
Heikin-Ashi candles are the lens that makes those cycles easy to see.
Why PayDay Cycles use Heikin-Ashi instead of regular candles
If you look at a typical candlestick chart, it often feels choppy. Green, red, gap up, gap down. It can be hard to tell whether the stock is actually trending or just tossing you around.
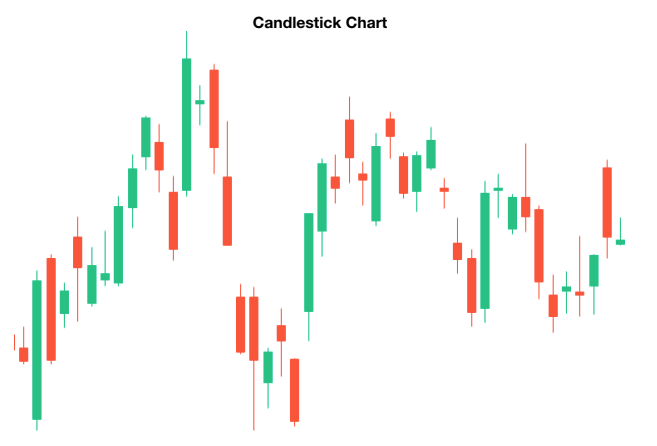
The whole reason for creating the PayDay Cycle framework was to give traders a way to “see” trends more clearly. That is why PayDay Cycles are built on Heikin-Ashi candles instead of regular ones.
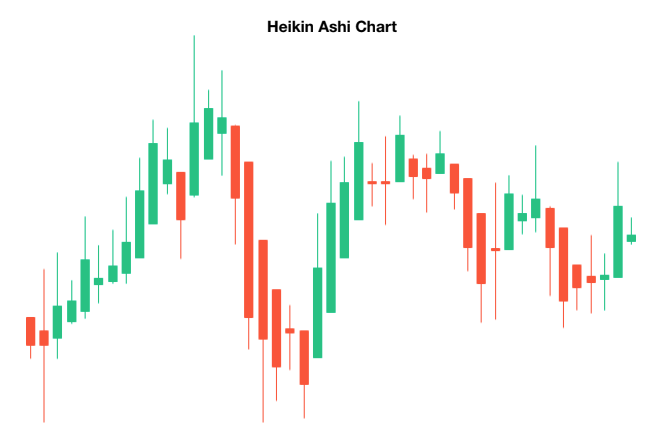
Heikin-Ashi literally means “average bar.” The candle uses an average of the open, high, low, and close to smooth out noise. In practice, that means:
On WallStreet.io, switching your chart to Heikin-Ashi gives you that smoother view so you can count cycles and judge trend quality without fighting every wiggle.
How a PayDay Cycle shows up on a Heikin-Ashi chart
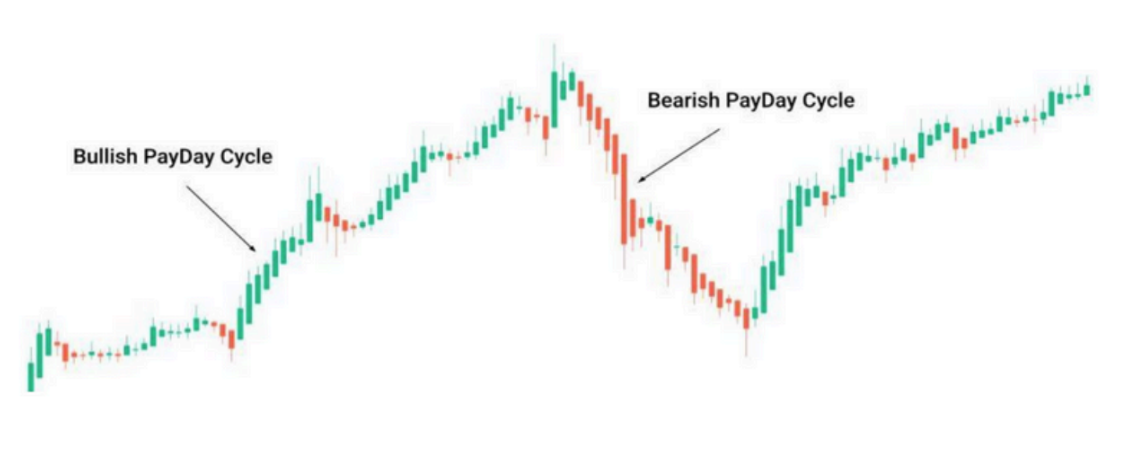
On a Heikin-Ashi chart, a PayDay Cycle is simply a series of same-color candles moving in one direction.
Most of the educational content in the Roadmap works with the daily timeframe, because that is where these four-to-eight-day swings show up cleanly.
When you look at a daily Heikin-Ashi chart through the PayDay Cycle lens, you are basically asking three questions:
The rest of this article is about using candle shape to answer those questions.
Reading “candle health” with Heikin-Ashi
Once you start looking at PayDay Cycles, you quickly realize that not all green or red candles are created equal. Heikin-Ashi candles give you extra clues through body size and wicks.
In general:
In the Roadmap, Micah goes deep into rating individual candles and cycles, but the core takeaway you can use here is simple:
If green candles are growing and stacking, the bullish PayDay Cycle is healthy. If they start shrinking, printing long wicks, or flipping red, the cycle is aging and you may be closer to the “cash, hedge, or take profits” side of the plan.
The same logic applies on the bearish side with red candles.
Expansion vs. compression: when a PayDay Cycle is worth trading
PayDay Cycles do not all feel the same. Some runs are explosive, others are sleepy. Heikin-Ashi makes this difference very visual.
Micah uses two simple ideas here: expansion and compression.
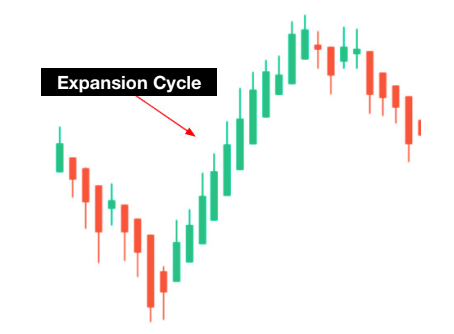
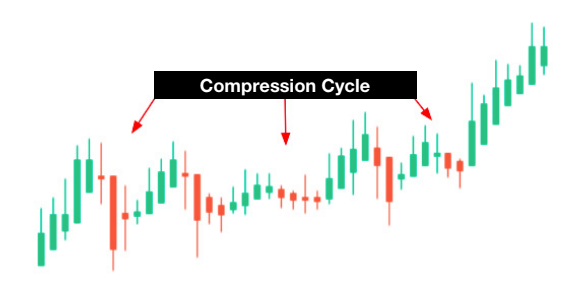
On a Heikin-Ashi PayDay chart, you generally want to focus most of your attention on:
Compression stretches are more like a “sit on your hands” zone. You can absolutely analyze them, but the framework is designed so that you do not feel forced to trade every candle just because it printed.
How Heikin-Ashi connects to probability stacking
Heikin-Ashi is the visual foundation of the PayDay Cycle framework, but it rarely stands alone.
In Micah’s full Roadmap training, the next step is probability stacking: layering other signals, like MACD momentum, on top of the PayDay Cycle so you are not trading a pretty chart with weak fuel behind it.
For the purposes of this article, here is all you need to hold in your head:
The “Probability Stacking” article in this same section will pick up from here and walk through that part of the framework.
Using Heikin-Ashi PayDay Cycles on WallStreet.io
On WallStreet.io, you can:
This article is meant to be your mental model, not your full playbook. Once you are comfortable reading PayDay Cycles on a Heikin-Ashi chart, you are ready for: