Awesome Oscillator
Definition
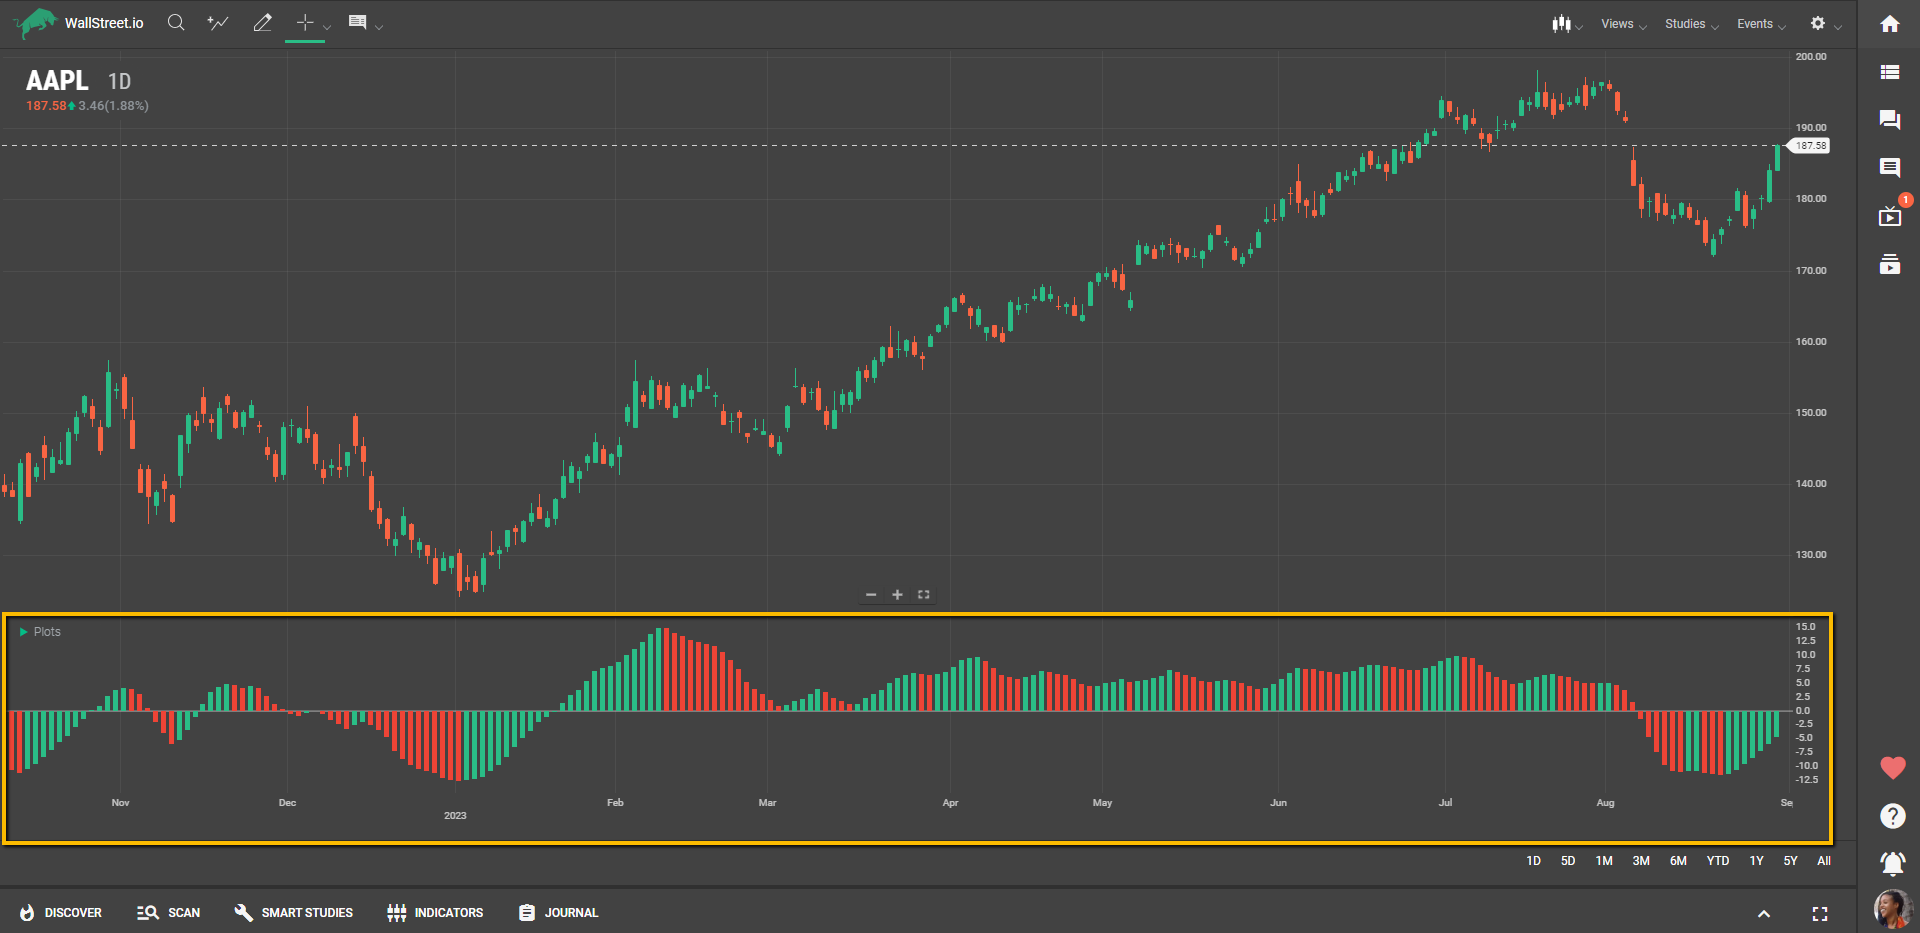
The Awesome Oscillator is a momentum indicator that calculates the difference between a 5-period and a 34-period Simple Moving Average (SMA), based on the median price of each bar. Displayed as a histogram, each bar's color changes based on whether the oscillator value is increasing or decreasing, providing immediate visual insight into the market's momentum.
Suggested Trading Use
Traders commonly use the Awesome Oscillator to identify potential trend reversals or confirm ongoing trends. When the histogram bars are above zero and increasing, it's generally seen as a bullish sign, suggesting the possibility of a continued upward movement in price. Conversely, if the bars are below zero and decreasing, it's considered bearish, indicating potential downward price movement.
The Awesome Oscillator is also popular for "Zero Line Crossovers," where the histogram crosses the zero line. A move from below zero to above zero is often interpreted as a bullish signal, while a move from above zero to below zero is considered bearish.
Additionally, traders look for "bullish or bearish divergences" between the oscillator and the asset's price. For example, if the asset makes a new high but the Awesome Oscillator doesn't, it could indicate weakening momentum and a possible trend reversal.
The Awesome Oscillator is a versatile tool that can be useful for traders interested in assessing momentum and identifying potential entry and exit points based on market sentiment. Its easy-to-read histogram format makes it accessible for traders of all experience levels.