Definition
The Correlation Coefficient helps you understand how closely two different traded instruments move in relation to each other. Think of it as a statistical buddy system; if one stock zigs, does the other zig or zag? The value of the coefficient ranges from -1 to +1, where a positive number indicates that the two instruments tend to move together, and a negative number suggests they usually move in opposite directions.
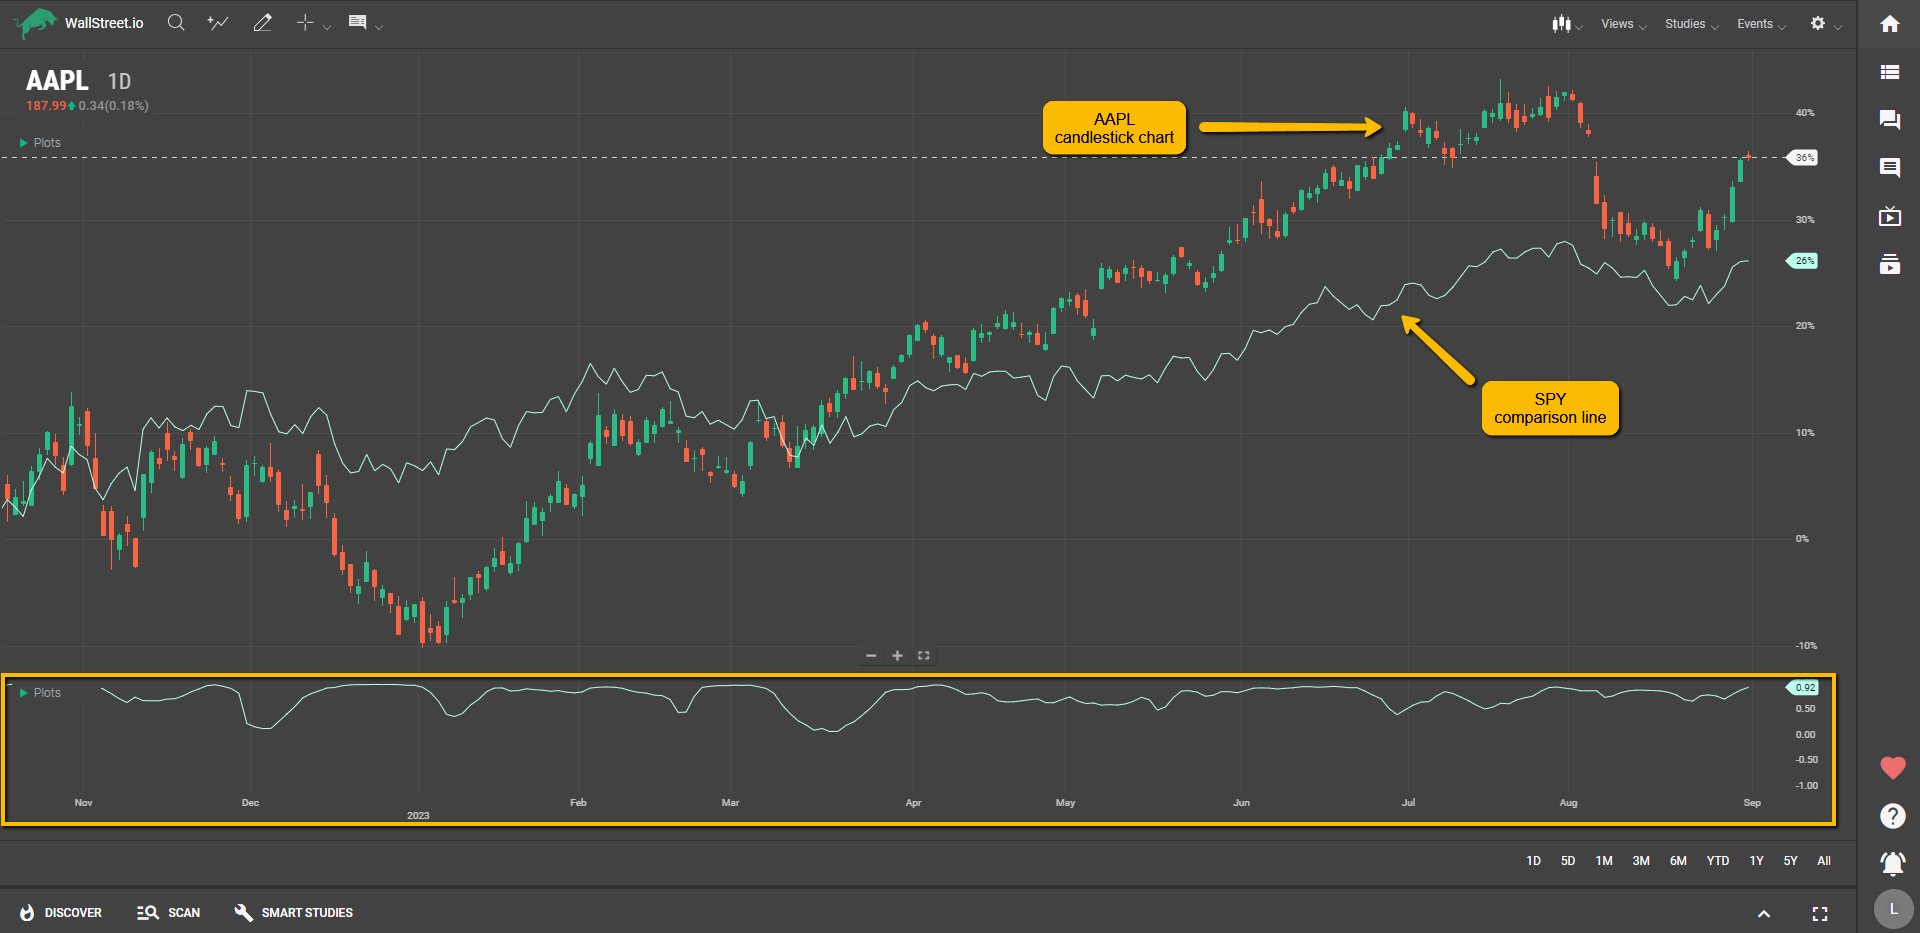
To use the Correlation Coefficient, you first need to use the “Add Comparison” function found in the Charting Tools area and add a secondary symbol to compare the first one.
Suggested Trading Use
Here's how you can utilize the Correlation Coefficient in your trading:
Diversify Your Portfolio: If you find that most of your investments have a high positive correlation, it might be time to add some negatively correlated assets to balance things out.Hedge Your Bets: Use the Correlation Coefficient to identify an asset that moves in the opposite direction of your primary investment. This way, you can offset potential losses in one asset with gains in another.Confirm Trends: If you're interested in two assets and they have a high positive correlation, a strong move in one could be a precursor to a similar move in the other.Identify Anomalies: A sudden change in the correlation between two historically correlated assets could signify a market event or trend change. Keep an eye on these shifts for potential trading opportunities or risk management.Understand Sector Relationships: Understanding how different sectors correlate can give you a broader view of market dynamics. For instance, if tech stocks are up but utilities are down, the correlation coefficient between the two could help you understand market sentiment.The Correlation Coefficient helps you understand how assets interact so you can make more balanced and strategic moves in the market.