ATR Bands
Definition
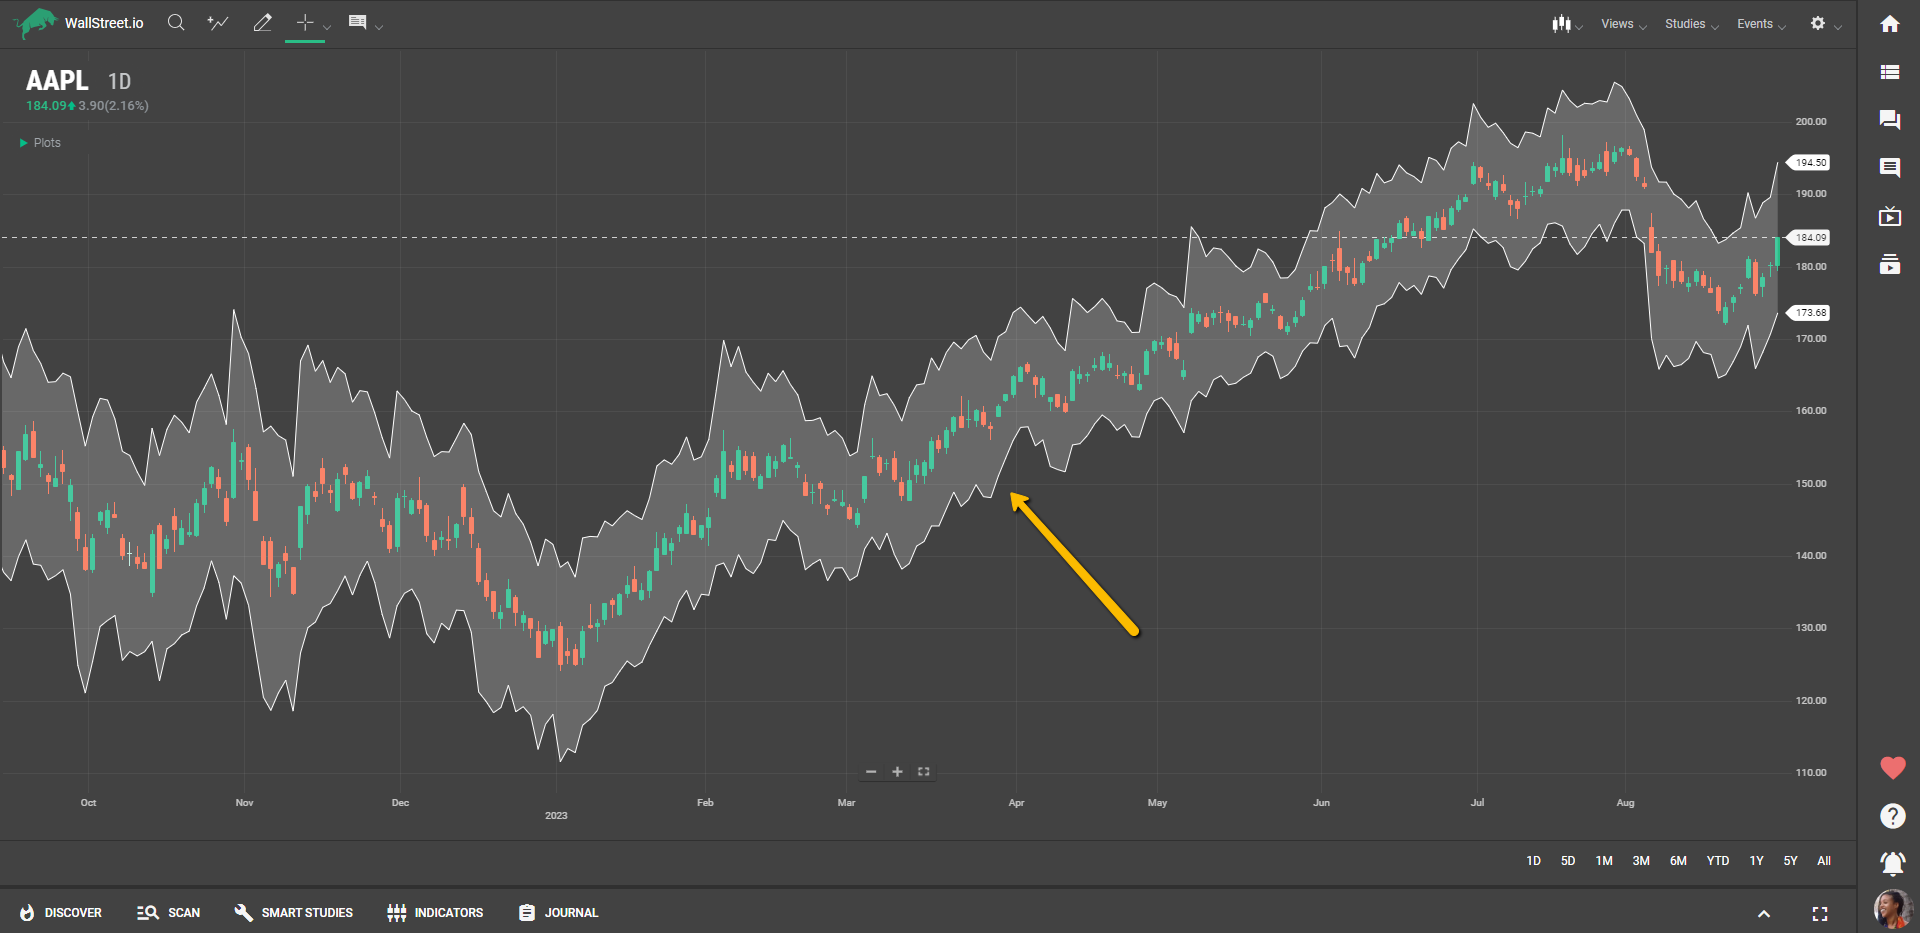
The ATR Bands Study is a volatility-based indicator that forms an envelope around the asset's price, based on the Average True Range (ATR). It consists of two lines, an upper band and a lower band, calculated by adding and subtracting a percentage multiple (referred to as "±Shift") of the ATR from the asset's last price, known as the Price series (X). The bands adapt to market volatility, widening during more volatile periods and contracting during less volatile times.
Suggested Trading Use
Traders can use the ATR Bands to gauge market volatility and to identify potential breakout or breakdown scenarios. When the asset's price crosses above the upper ATR Band, it can be considered a bullish signal, suggesting that the asset may continue to rise. Conversely, if the price falls below the lower ATR Band, it can be seen as a bearish signal, indicating that the asset might continue to decline.
The ATR Bands can also be helpful in setting stop-loss and take-profit levels, as they give traders an idea of the asset's typical price fluctuations. For example, traders could place a stop-loss order near the lower band when in a long position, or near the upper band when in a short position.
By integrating the ATR Bands into their charting tools, traders can get a better sense of an asset's volatility and potential price movements, helping them to time their trades more effectively. This makes the ATR Bands a versatile tool for traders interested in capitalizing on market volatility.