Aroon
Definition
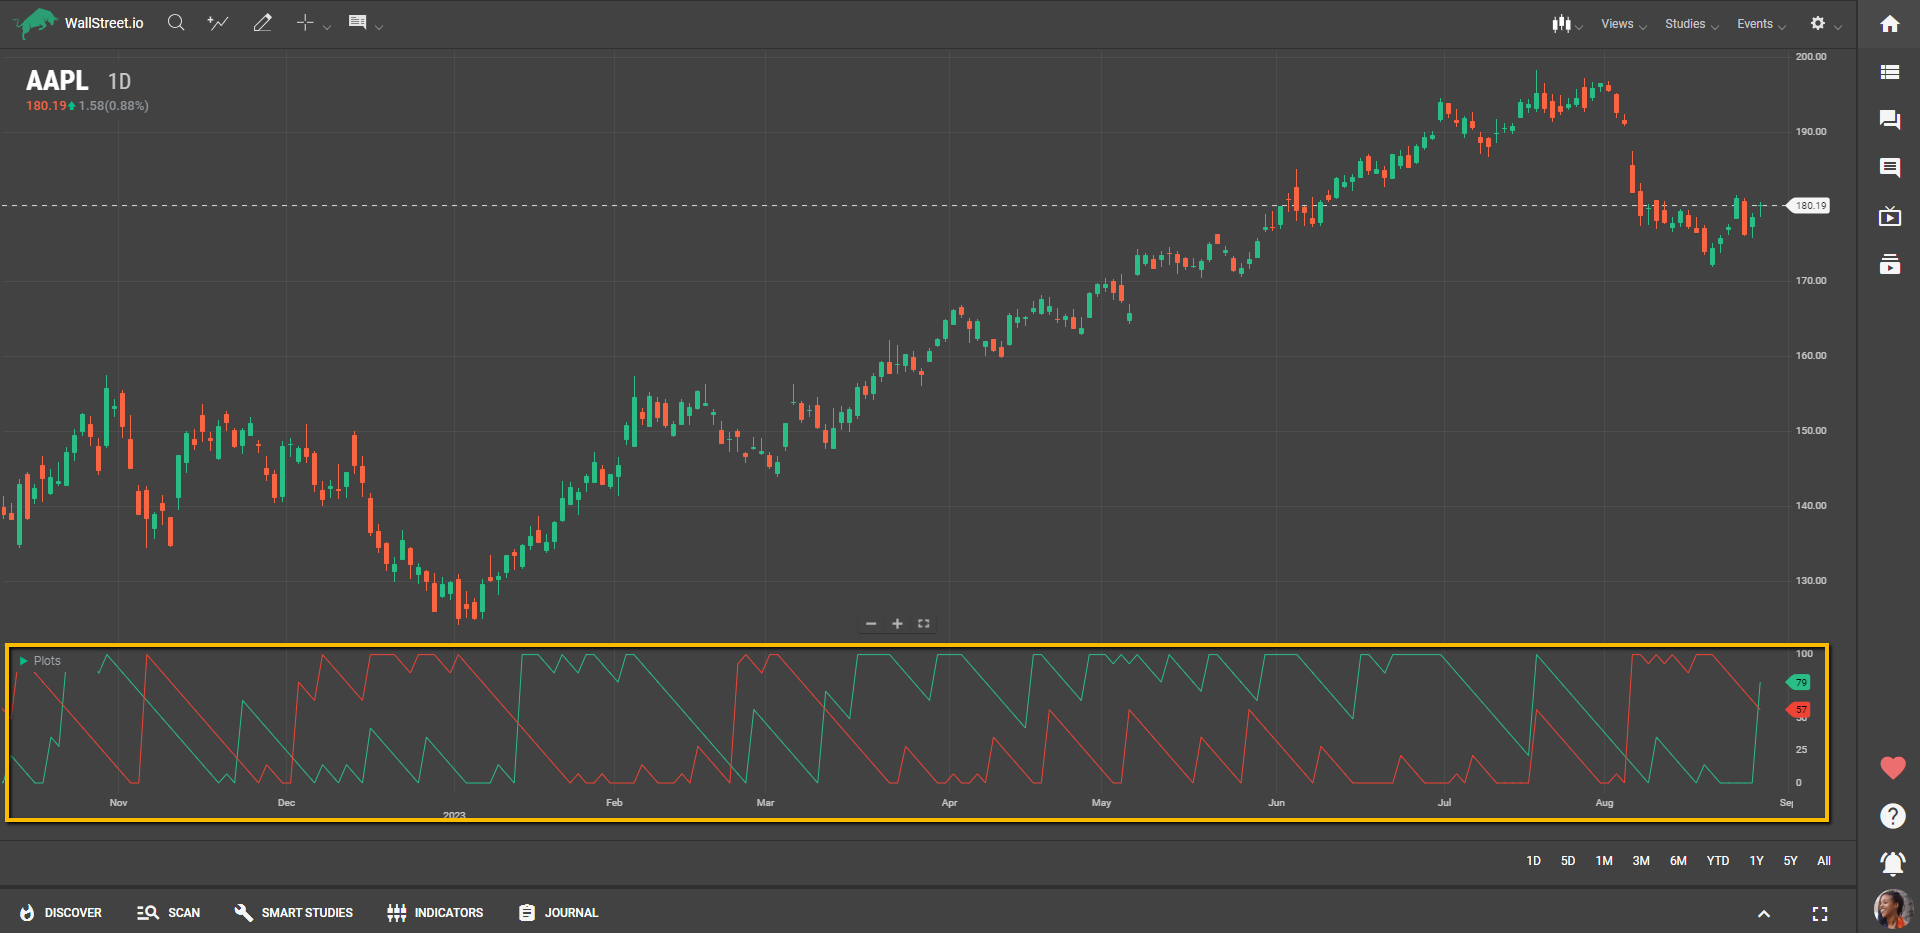
The Aroon Study is a technical analysis indicator developed by Tushar Chande to identify trend changes and the strength of a trend within a given time frame. The Aroon consists of two lines: Aroon Up and Aroon Down. These lines fluctuate between 0 and 100 and are designed to measure the time between highs and lows on a price chart over a specific period, usually 14-25 bars or candlesticks.
Suggested Trading Use
Traders can use the Aroon Study to detect the beginnings and ends of trends. When the Aroon Up line crosses above the Aroon Down line, it can be a signal that a new uptrend is forming. Conversely, when the Aroon Down line crosses above the Aroon Up line, it may indicate that a new downtrend is emerging.
Additionally, values above 70 for either the Aroon Up or Aroon Down suggest a strong trend in the corresponding direction, while values below 30 might indicate that the trend is losing strength and could reverse soon.
By integrating the Aroon Study into their charting area, traders can gain valuable insights into trend strength and direction, which can be crucial for timing entries and exits. The Aroon Study is a versatile tool that can be useful for traders of all experience levels seeking to understand and capitalize on market trends.