Strategies Tab Complete Guide
What this helps you do
The Strategies tab is your strategy dashboard. It brings together the community’s shared strategies, the ones you subscribe to, and the performance stats that show how each idea has behaved in past markets.
You use this tab to scan for opportunities, compare strategies side by side, and focus on the ones that fit your watchlists, timeframe, and risk style.
Strategies tab layout
You open the Strategies tab from the Strategy Bar at the bottom of your workspace. Click Strategies and a panel slides up under your chart.
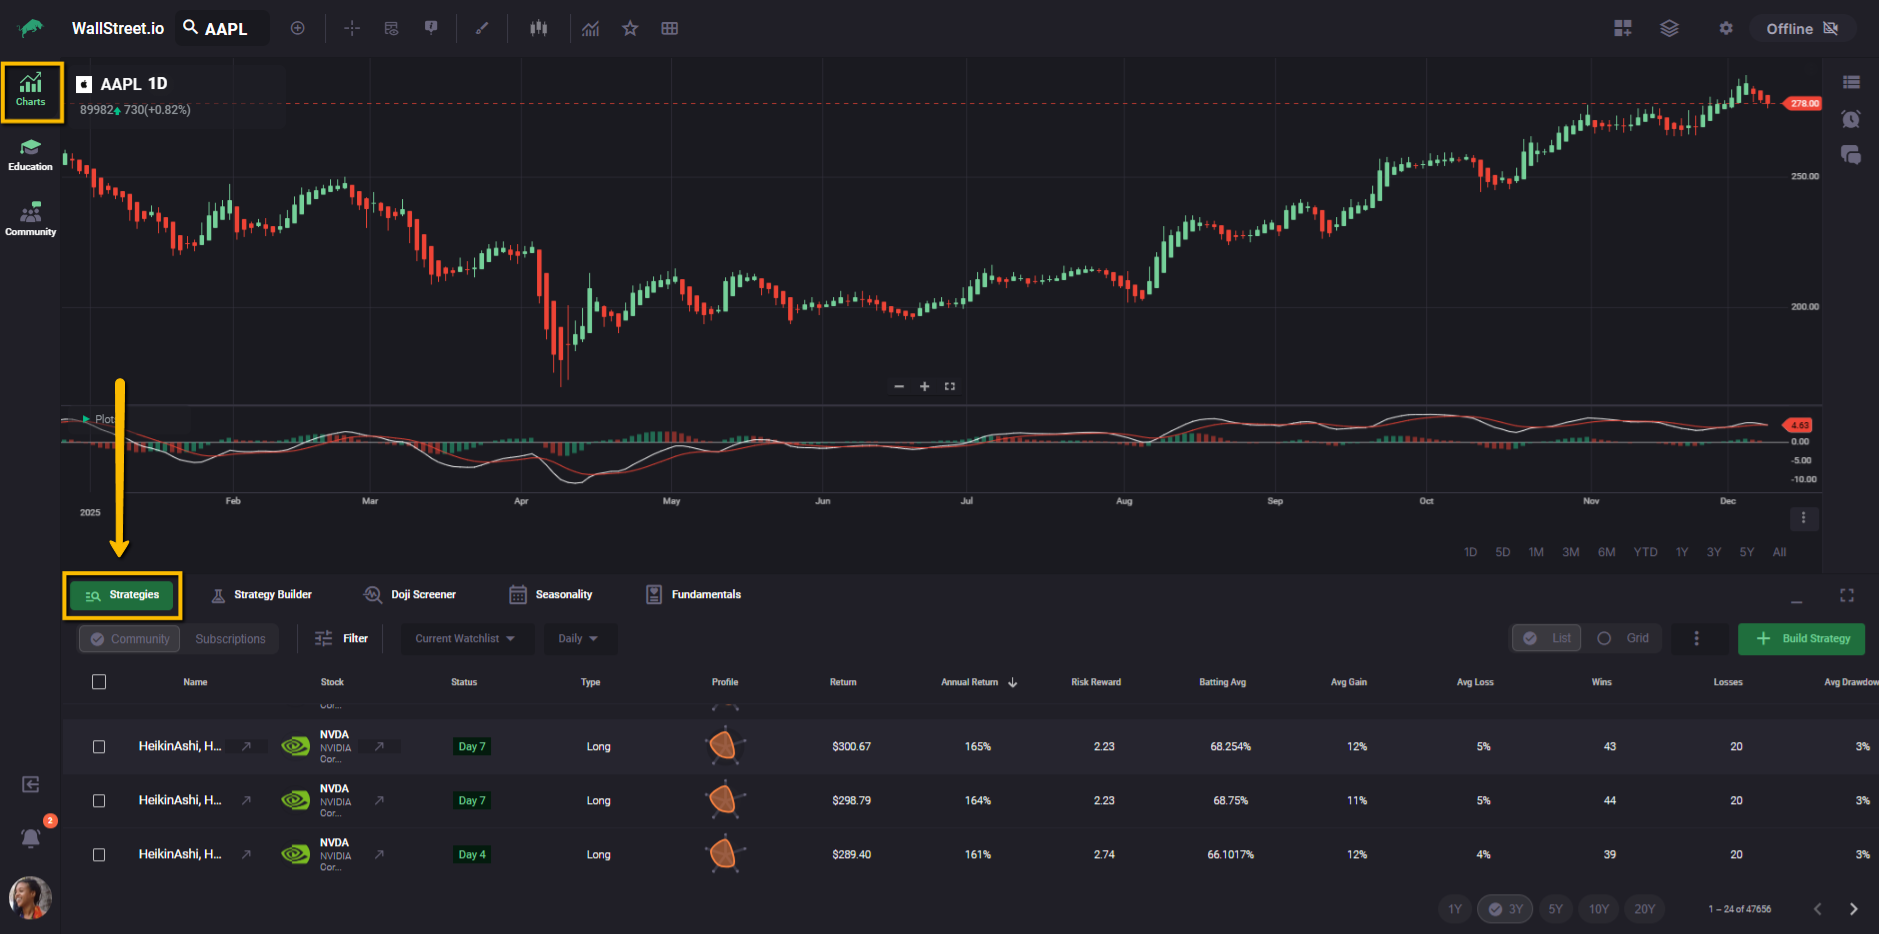
By default, the workspace is split in two: charts on the top half of the screen, strategies on the bottom half. This lets you keep price action in view while you browse and compare strategies.
You can resize the panel by dragging its top edge, or click the expand icon in the top-right of the panel to maximize it so the strategy list fills more of the screen.
At the top of the Strategies panel you see a toolbar that controls what appears in the table:
Everything below that toolbar is the strategy table (in List view) or strategy cards (in Grid view).
Community vs Subscriptions
On the left side of the toolbar you can switch between two modes:
Community
Shows all public strategies that match your selected watchlist and timeframe. This is where you explore what the community has backtested.
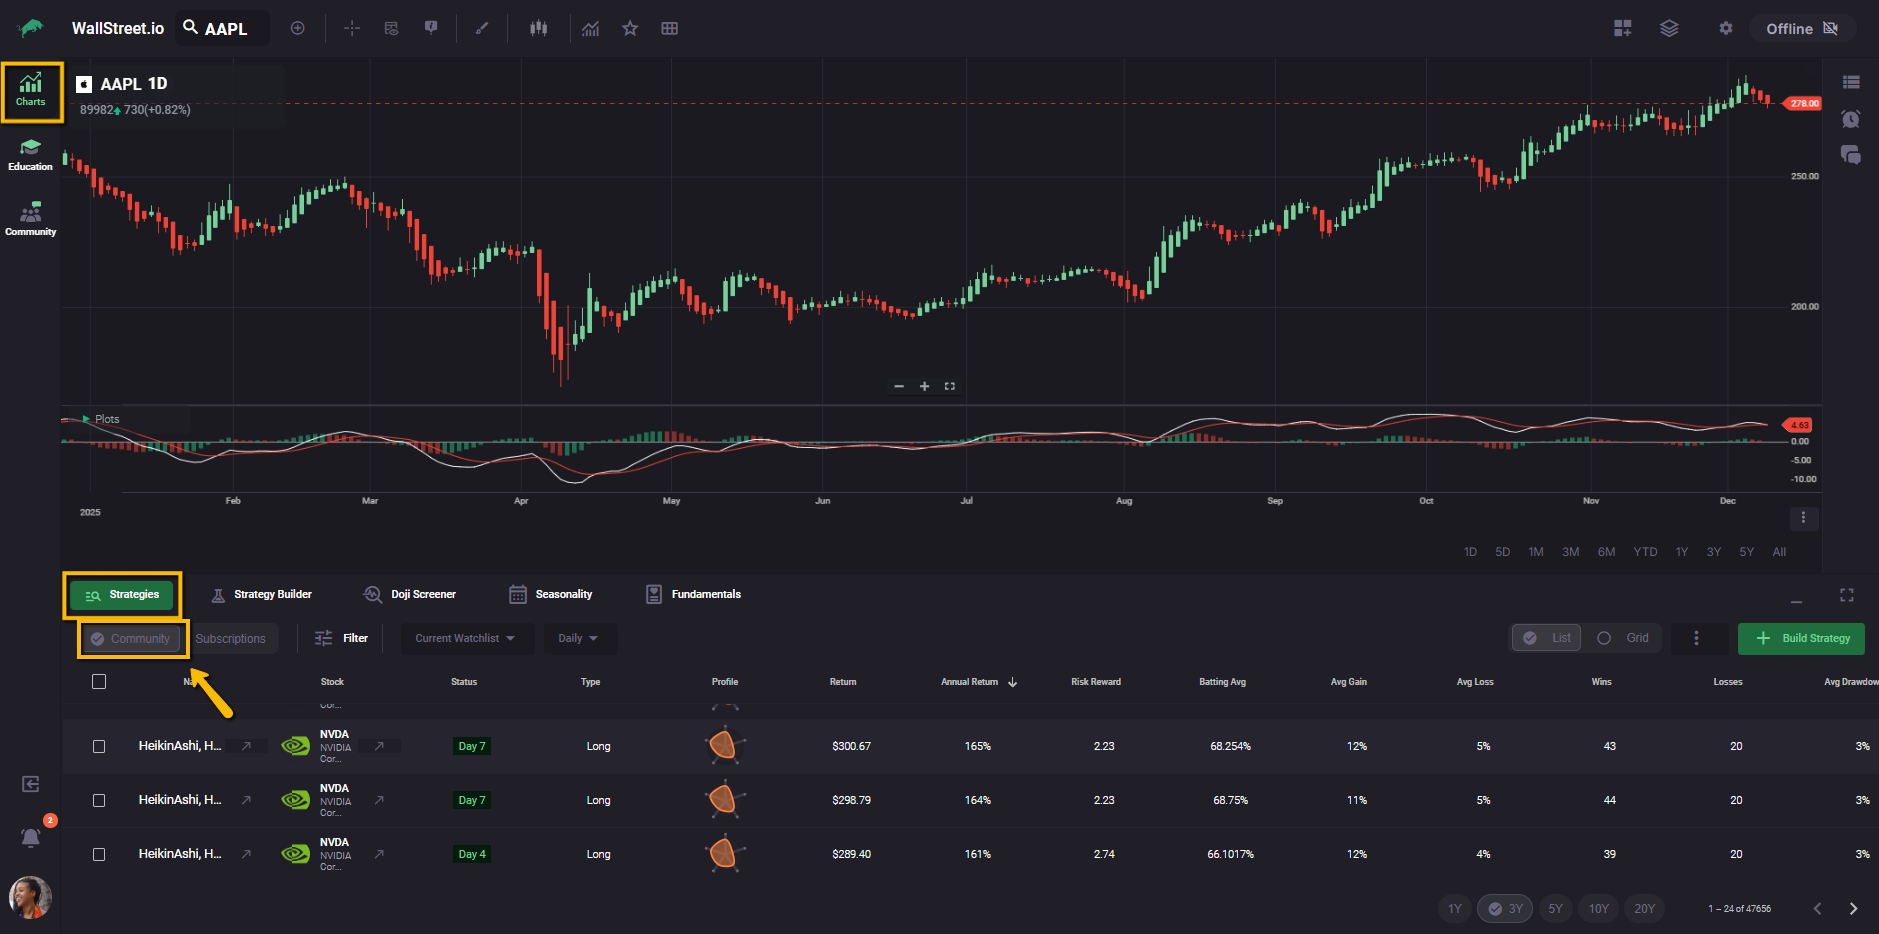
Subscriptions
Shows only the strategies you have subscribed to. These are the strategies that send you status notifications and that you are actively tracking.
Use Community when you want to discover new edges, and Subscriptions when you want a focused working list for your daily trading routine.
Filters, watchlists, and timeframes
Moving across the toolbar from left to right:
Filter
Opens the Strategies Filters panel. You can mix conditions such as strategy status, type, studies used, and performance ranges to narrow the list to only the strategies that fit your plan.
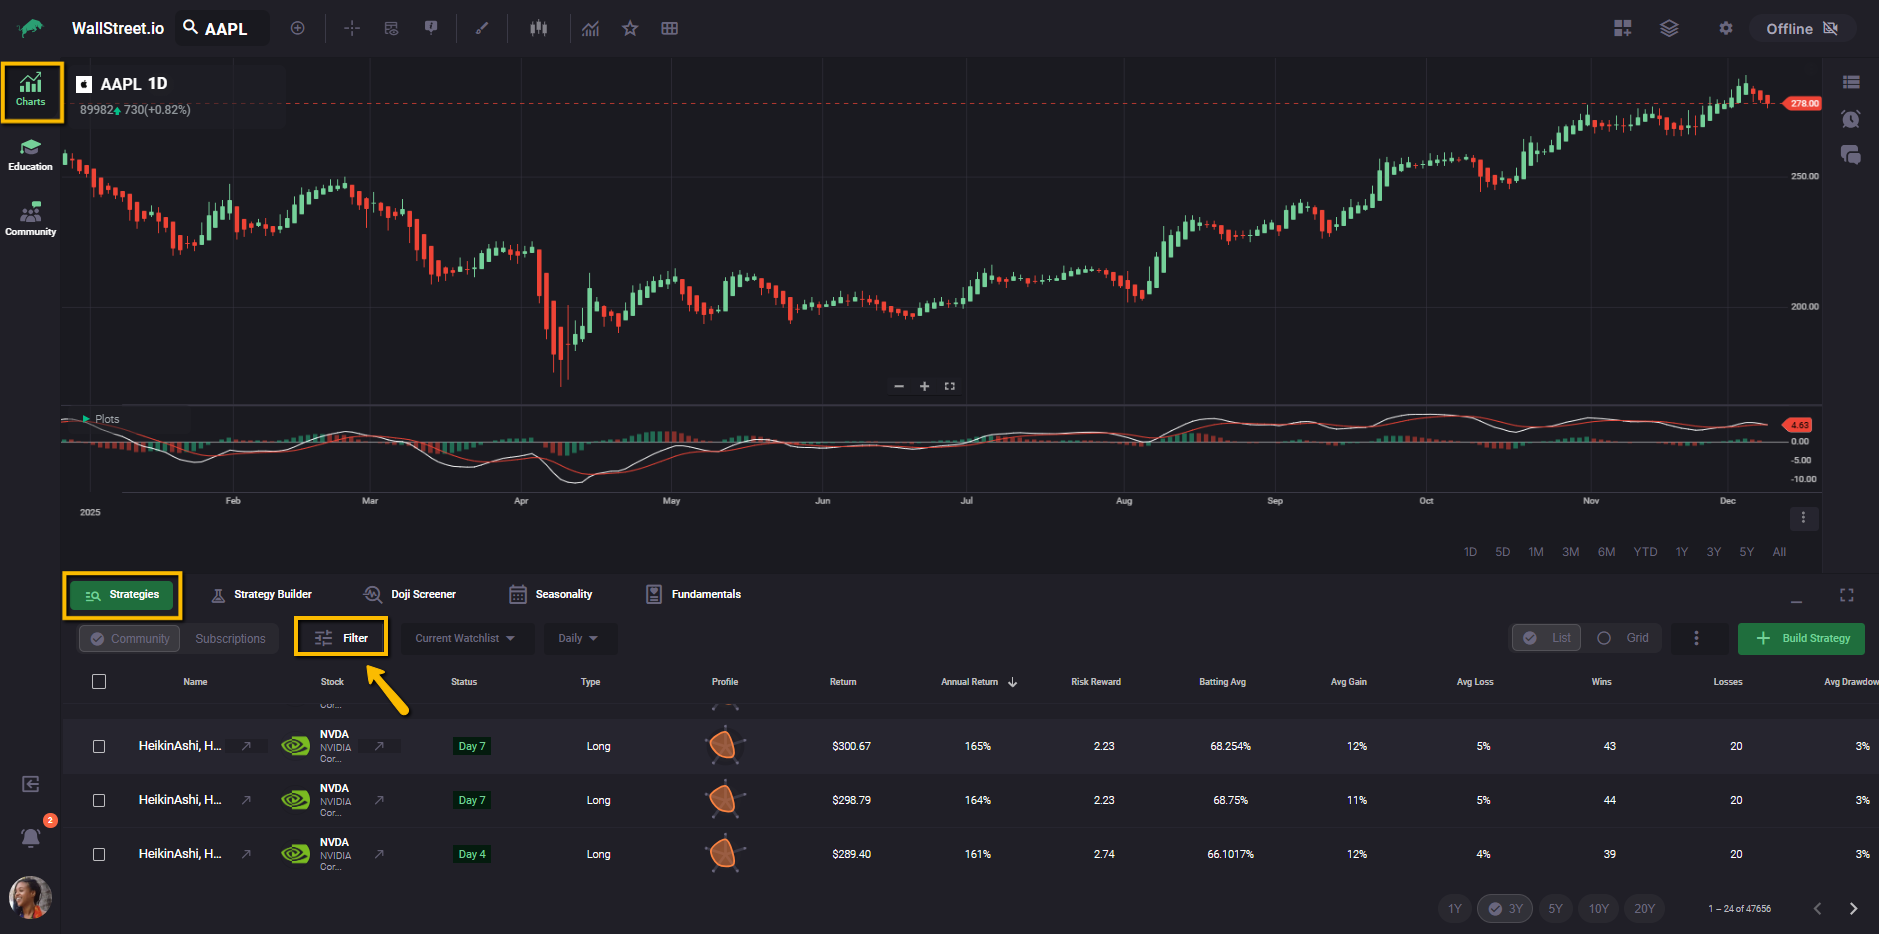
(Use this guide for the overview and see the Strategies Filters Complete Guide when you want every filter explained.)
Stock filter
Next to Filter you will see the Stock filter dropdown. The label on the toolbar shows whichever option you have selected, such as “Current Watchlist.”
This dropdown controls which symbols the Strategies list uses:
All Stocks
Shows strategies for every symbol that matches your other filters, regardless of what is loaded on the chart.
Current Stock
Limits the list to strategies that run on the single symbol currently loaded on your chart.
Current Watchlist
Limits the list to symbols in your active watchlist, so you can focus only on the universe you normally trade.
Use the Stock filter when you want to zoom out to the whole market, zoom in to the chart you are studying, or stay inside a specific watchlist.
Timeframe (Daily, etc.)
This dropdown sets the chart timeframe used for the strategies in the table. If you choose Daily, you see daily strategies. If you choose another timeframe (Weekly or Monthly), the strategies and stats shown will match that choice.
List vs Grid view
On the right side of the toolbar you can switch between:
List view
The default view. Displays one strategy per row with all performance metrics across columns. This is the best view for comparing many strategies at once.
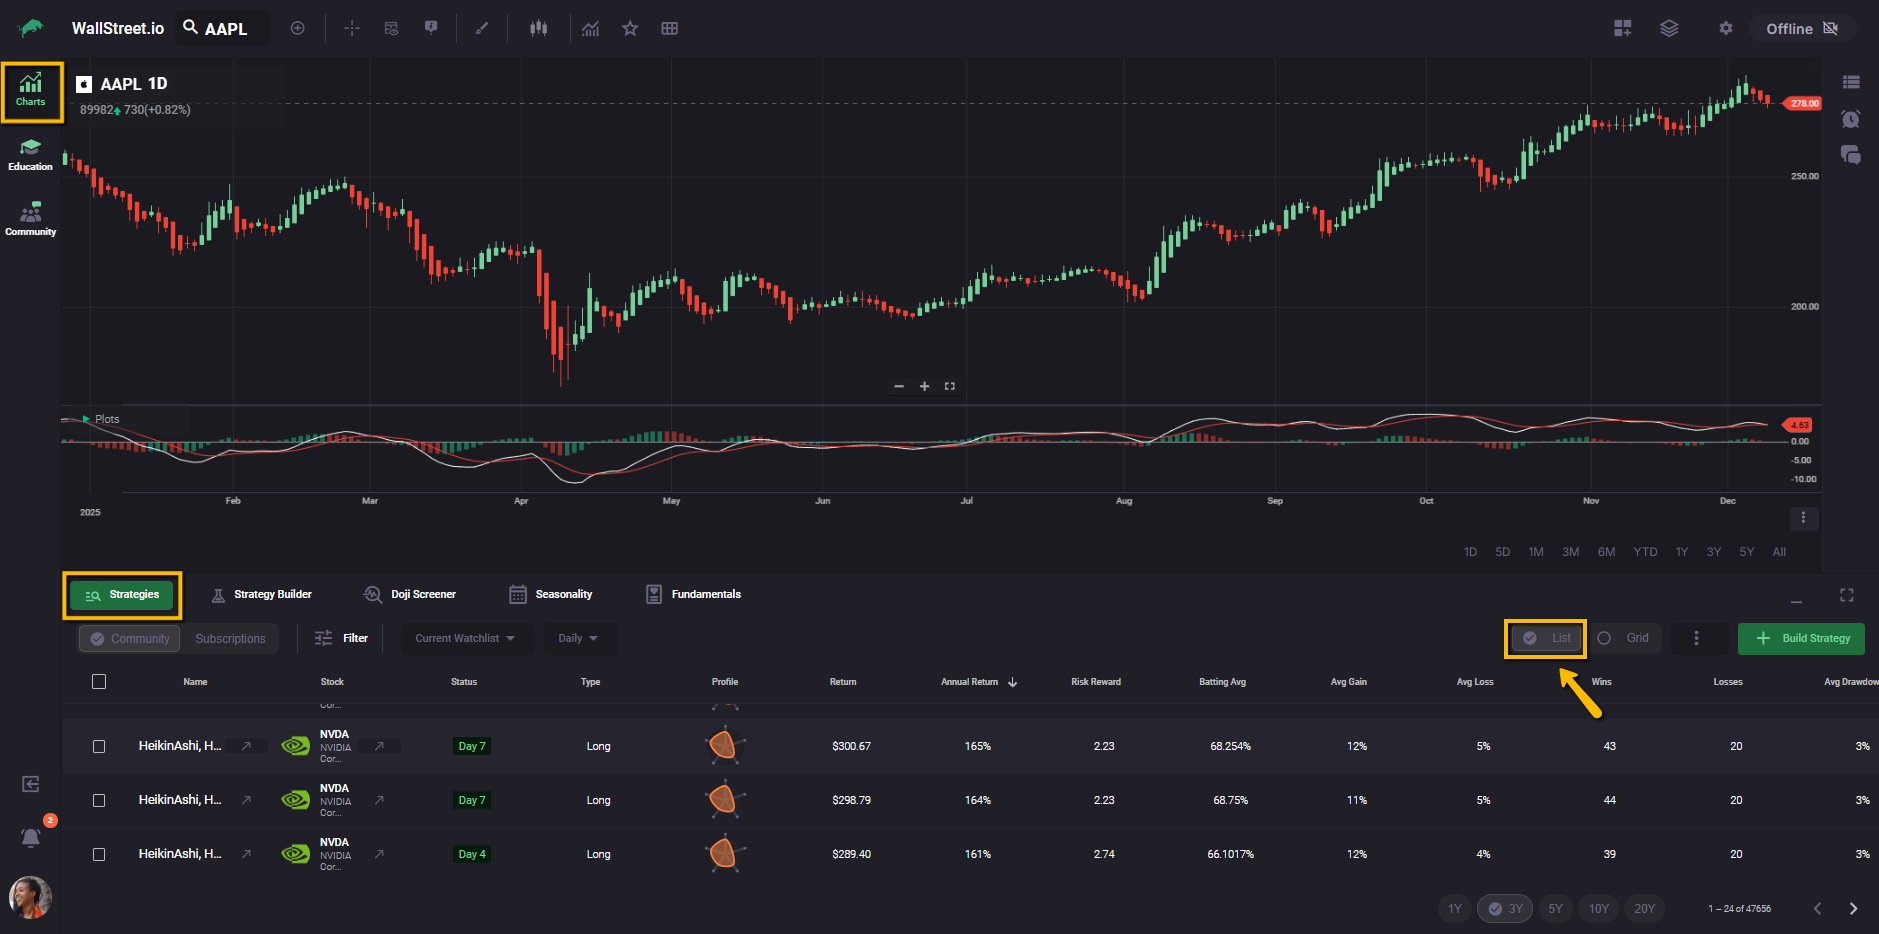
Grid view
Displays strategies as cards. Each card still shows key stats, but with a more visual layout that can be easier when you are skimming a smaller number of favorites.
You can move between List and Grid at any time. Your filters and watchlist selection stay the same.
More actions: Strategy stats, trade highlights, and columns
Next to the Build Strategy button there is a three–dot icon. This is the More Actions menu for the Strategies tab.
When you click it, you see three options:
Strategy Stats
This option shows or hides the Strategy Stats panel (also called the View Stats panel). The panel summarizes the main performance numbers for the strategy you have selected in the list, so you can review its behavior without leaving the current view.
If you need detailed definitions for any of these metrics, use the separate Strategy Stats Glossary article as your reference.
Trade Highlights
This option turns the trade shading on the chart on or off. When it is enabled, the chart shows highlighted zones for each historical trade that belongs to the selected strategy. That makes it easier to see where trades started and ended directly on price action.
Columns
This option opens the Columns configuration panel. From here you can:
The settings you choose here control how every row in the Strategies list is displayed, so you can keep only the stats that matter most to you visible.
Build Strategy
On the far right of the Strategies toolbar you will see the green Build Strategy button.
Clicking this button opens the Strategy Builder with blank conditions so you can define a brand-new rules based strategy. It does not load any strategy from the list, even if you have one selected.
Once you save and backtest a strategy in the Strategy Builder, it can appear in the Strategies tab alongside the other strategies, depending on its visibility and filters.
Open a strategy in Strategy Builder
In the first column of the Strategies list there is a small arrow icon to the right of each strategy name. That icon opens the selected strategy in the Strategy Builder with its existing studies and logic loaded.
Use this arrow whenever you want to inspect or edit the rules behind a strategy you see in the list. Use the Build Strategy button when you want to start from a completely blank template.
Understanding each strategy row (List view)
The Strategies list is fully customizable. You can choose which columns are visible and rearrange their order, so your table may not match the screenshot exactly.
Each row represents one strategy on one stock and includes three kinds of information:
Identity: name, stock, and type
Checkbox
Each row starts with a checkbox. When you select one or more strategies using these checkboxes, you can subscribe, unsubscribe, or manage tags for the selected strategies at the same time. This is the easiest way to apply changes in bulk instead of handling each strategy one by one.
Name and Strategy Builder icon
Next to the strategy name you will see a small arrow icon on the right. Clicking that arrow opens the selected strategy in the Strategy Builder with its current studies and logic already loaded, so you can review or adjust the rules behind it.
By default, every strategy name is generated from the studies that were used to build it, for example:
HeikinAshi, MACD, MA
If you save a nickname for a strategy in your own account, you see that nickname in your subscribed strategies view. Other members still see the original studies based name.
Stock
The ticker, company name, and logo for the symbol the strategy trades.
Type
The direction of the strategy, for example Long or Short.
These three columns tell you at a glance what the strategy is and where it trades.
Live behavior: status
Status tells you what the strategy is doing right now on the selected symbol and timeframe. Common states include:
Filters work closely with this column, so you can quickly focus on strategies that are starting or already active.
Performance profile: radar chart and stats
Profile
This small radar chart summarizes the strategy across several scoring dimensions, such as profitability, risk management, consistency, and stability. A larger shape usually means the strategy scores higher across more of those dimensions. Use it as a quick visual “personality check” before you dig into the numbers.
Performance stats
Columns such as Return, Annual Return, Risk Reward, Batting Avg, Avg Gain, Avg Loss, Wins, Losses, and Avg Drawdown are all defined in detail in the Strategy Stats Glossary.
If you are unsure what a particular stat means or how to interpret it, open the Strategy Stats Glossary article in the Resource Center and use that as your reference while you work with the Strategies tab.
Because the columns are customizable, you can hide any stats you do not use often and keep your list focused on the numbers that actually drive your decisions.
Sorting and comparing strategies
You can click on many column headers, such as Annual Return, to sort the table.
Typical comparisons:
Combine sorting with filters and your chosen watchlist to build a focused working list that matches your style.