Doji Screener Complete Guide
What this helps you do
This guide shows you how every part of the Doji Screener works so you can read its filters, columns, and results with confidence. It matters for Wallstreet.io traders because the platform’s opportunity radars are built on precise, backtested logic, and understanding the data helps you use the tool the way it was designed.
Keep this as your reference when analyzing Doji setups.
Overview
The Doji Screener is a research-driven opportunity radar that scans for Heikin-Ashi Doji patterns across a curated universe of stocks and ETFs.
A Doji often appears at the start of a new PayDay Cycle, which makes these signals useful for traders who want to catch momentum early instead of chasing stretched moves. The screener highlights where these setups are forming, how historically strong they tend to be, and what the potential risk profile looks like based on recent volatility.
This guide describes what the screener includes, what each column represents, and how the system behaves inside the WallStreet.io 4.0 workspace.
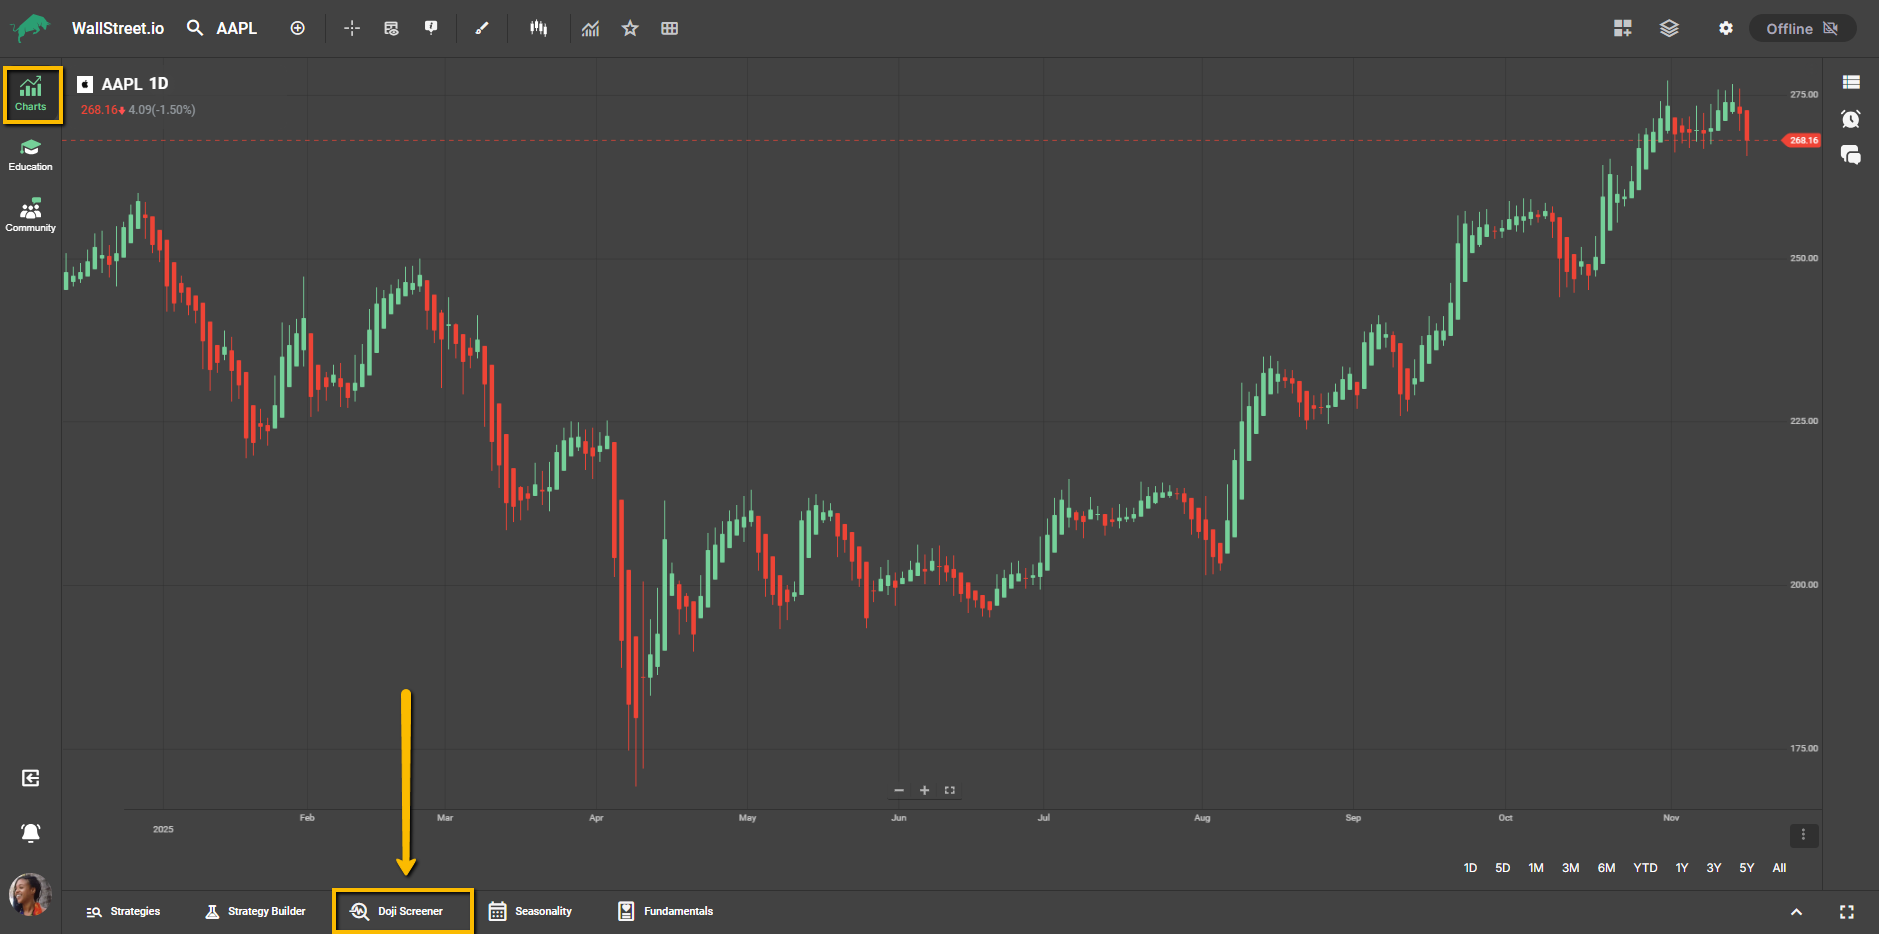
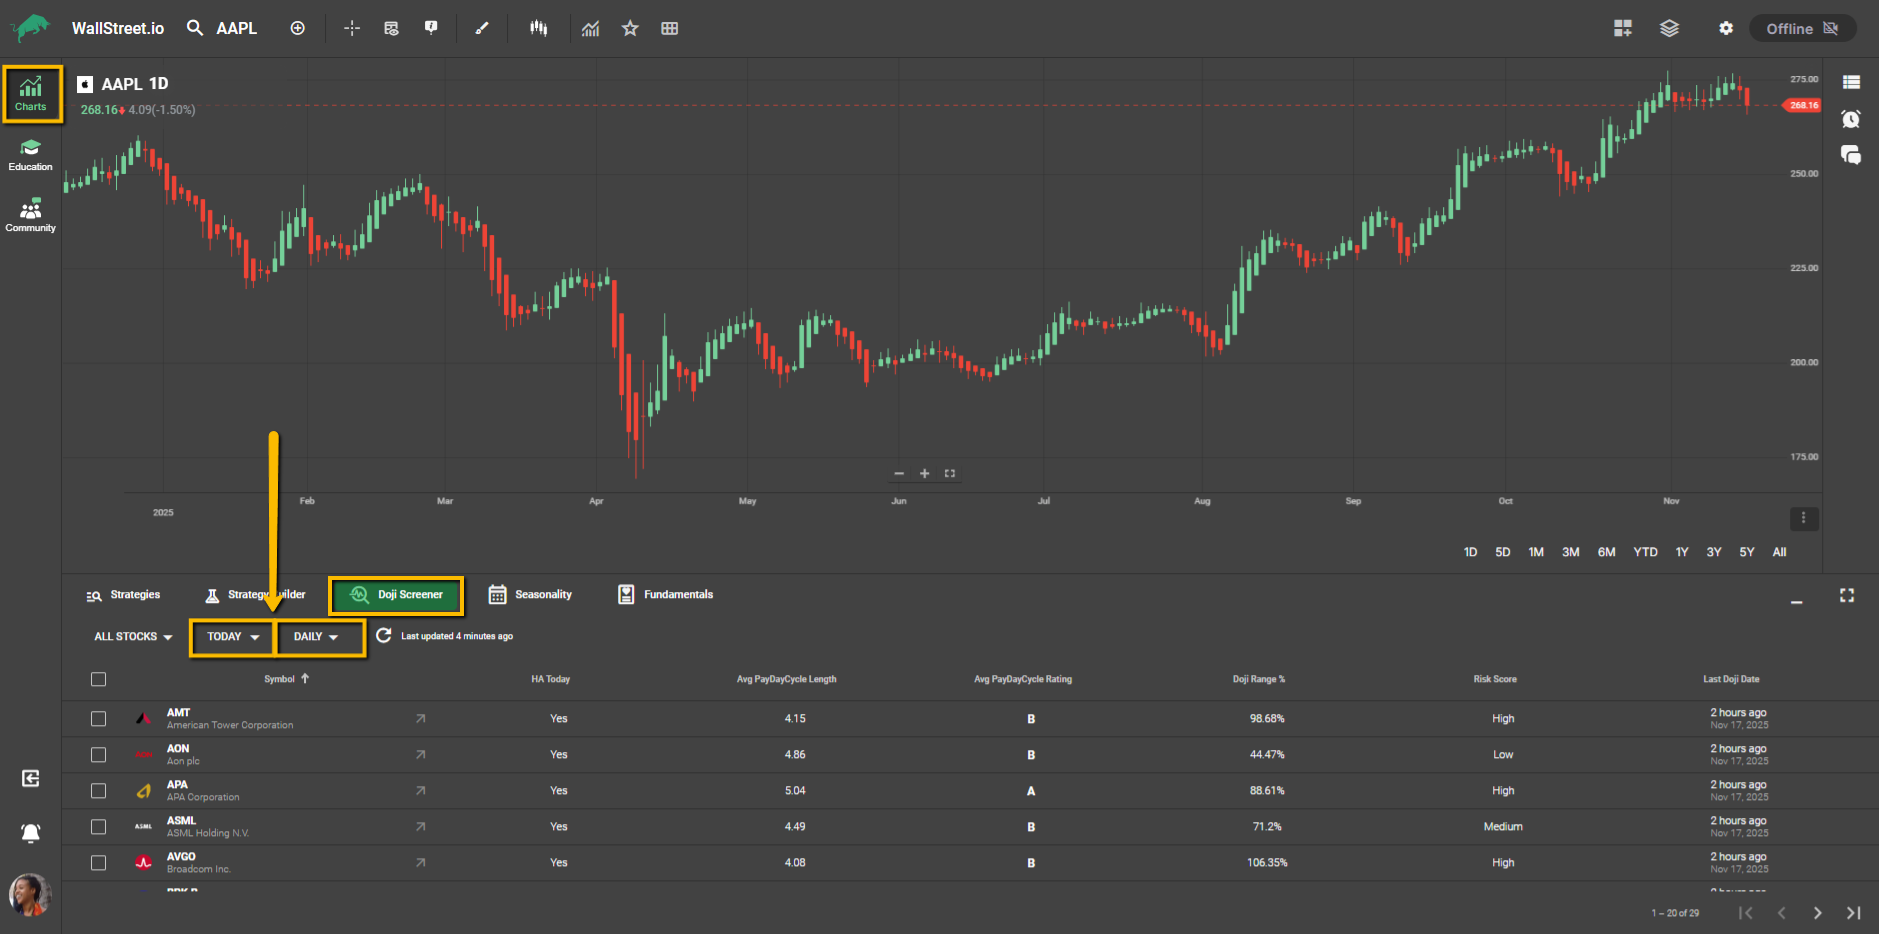
Interface Overview
At the top of the Doji Screener you will see the filters that shape the universe and timeframe of the scan. These include the Stock Universe Filter and the Periodicity Filter with the date-range picker.
Filter Dropdown Menus (Top-Left)
Stock Universe Filter
Located on the left side of the toolbar (default: All Stocks):
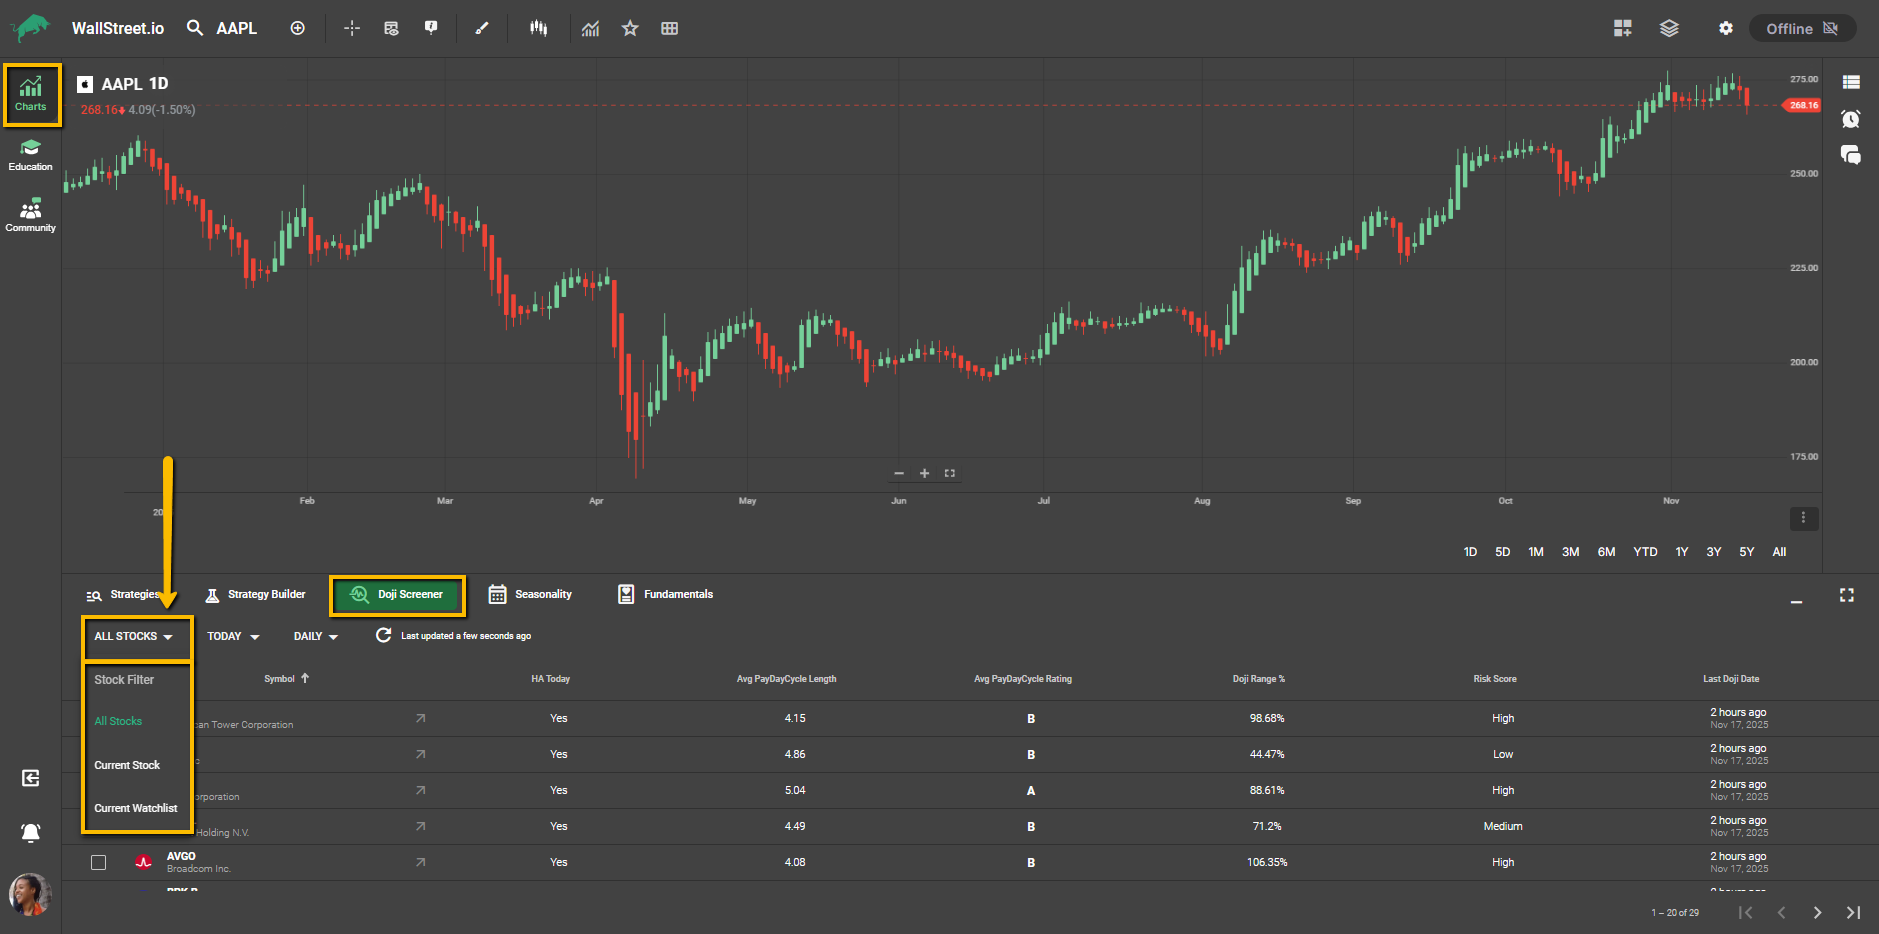
This selector allows you to narrow the scan to one of three groups:
• All Stocks: Includes
• Current Watchlist: Displays only stocks from your active personal Watchlist.
• Current Stock: Displays only the chart currently selected in the main view.
Periodicity Filter + Date-Range Picker
Found next to the Stock Universe Filter (default settings: Today and Daily).
You can choose between Daily and Weekly views. Once you pick a timeframe, the date-range options will adjust to match that selection.
Daily options can include Today, Yesterday, Last Week, or Last Month.
Weekly options can include This Week, Last Week, Past Month, or Past Six Months.
Switching from Daily to Weekly or from Weekly to Daily resets the range to Today so you always start with a clean selection.
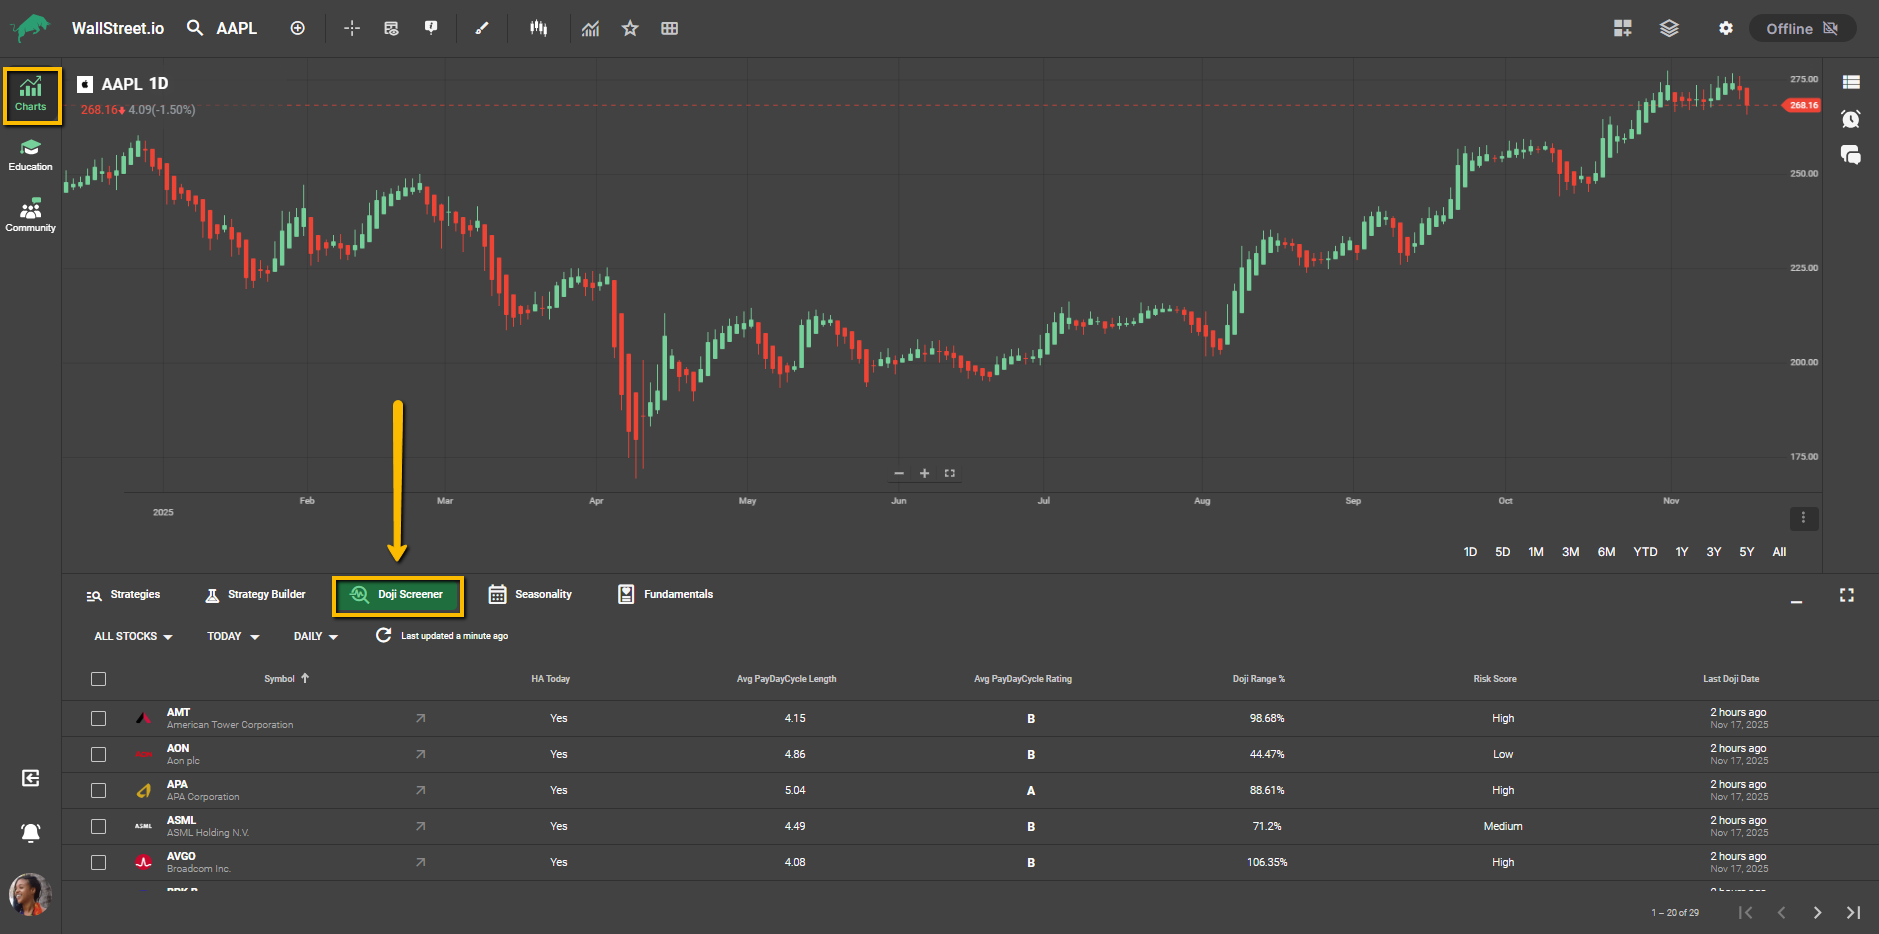
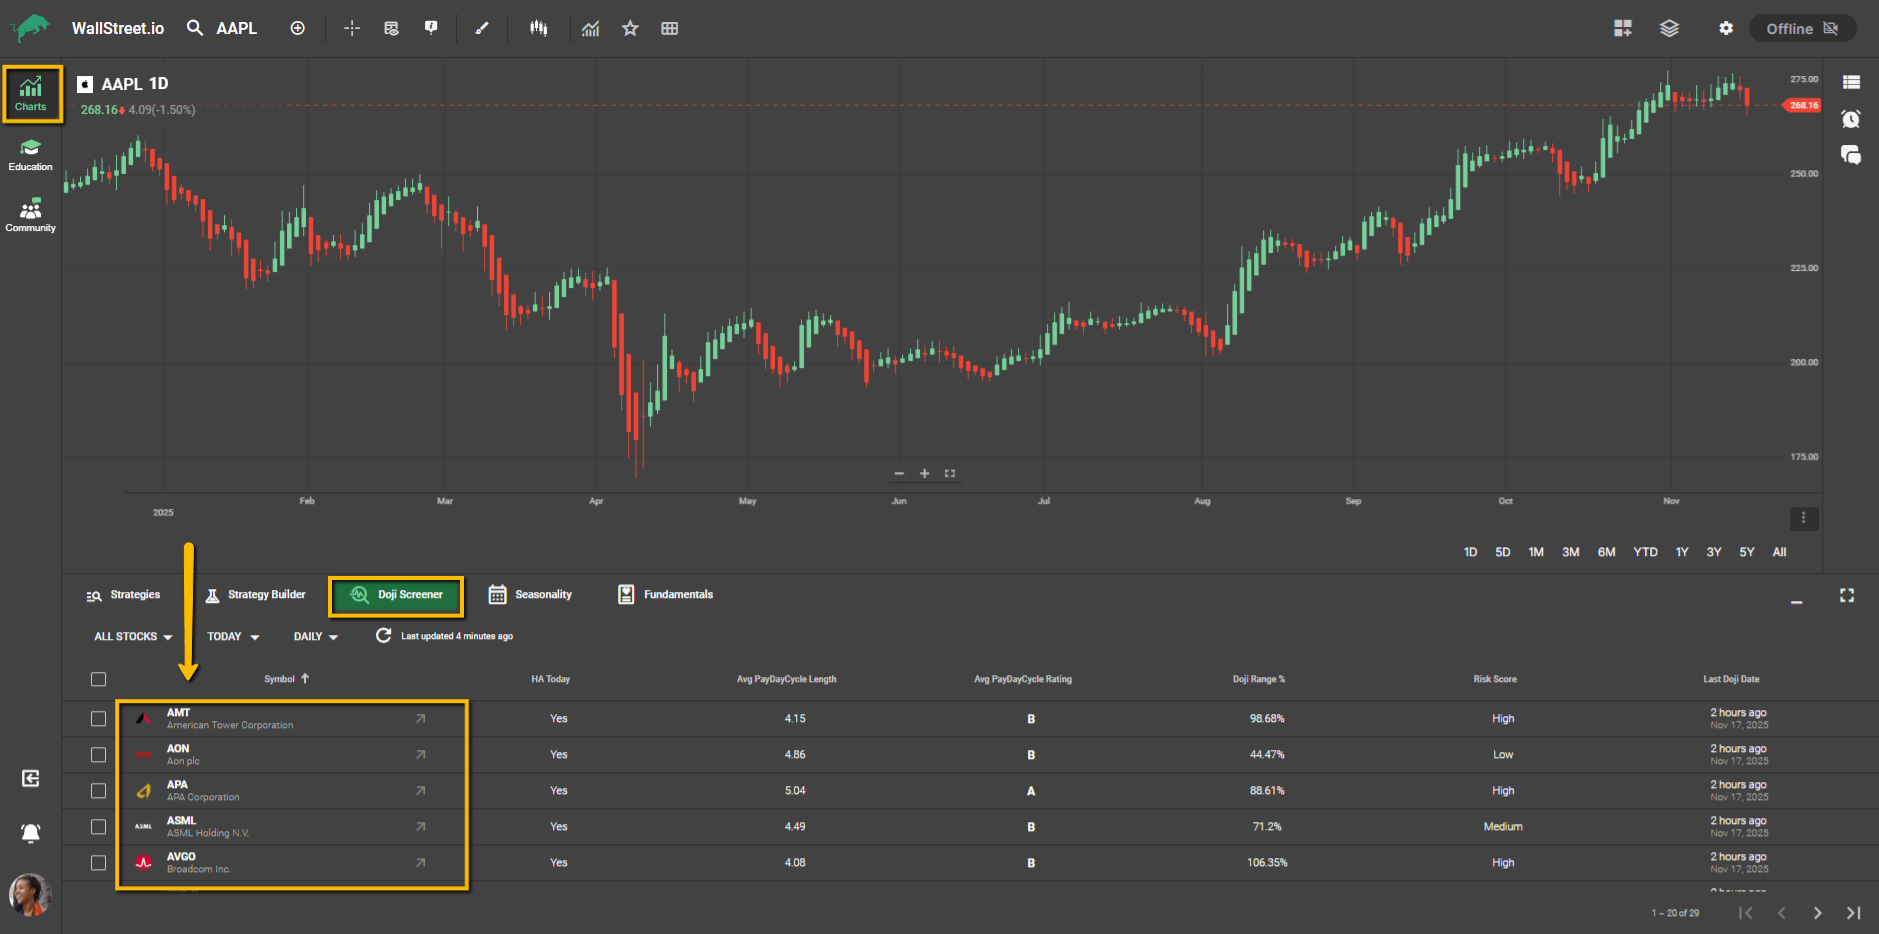
Screener Layout and Columns
Each row represents a symbol with a recent Heikin Ashi Doji. The columns give you a quick way to judge momentum, risk, and the historical reliability of the setup.
Symbol
Displays the stock’s ticker and company name. Selecting a symbol opens the full chart view for deeper analysis.
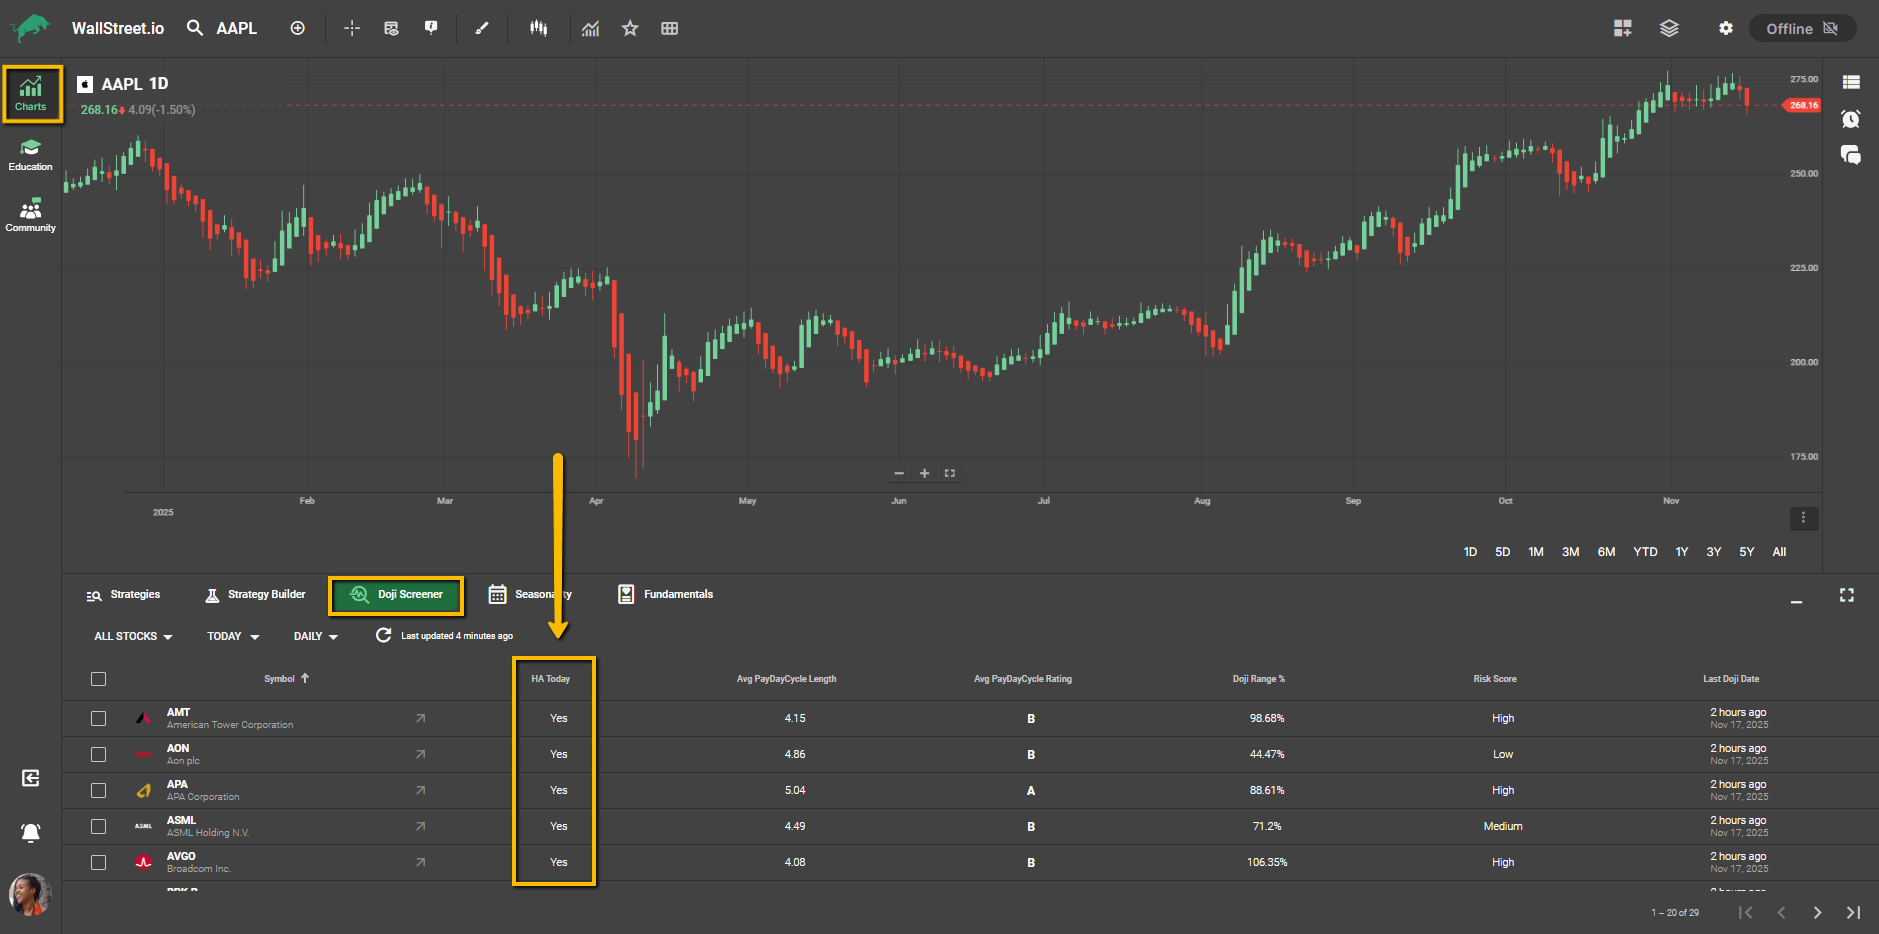
HA Doji Today
A Yes means a Heikin Ashi Doji has formed during the current trading session.
• Note: This status is real-time/intraday and may not yet be reflected in the Last Doji Date, which only updates after confirmation.
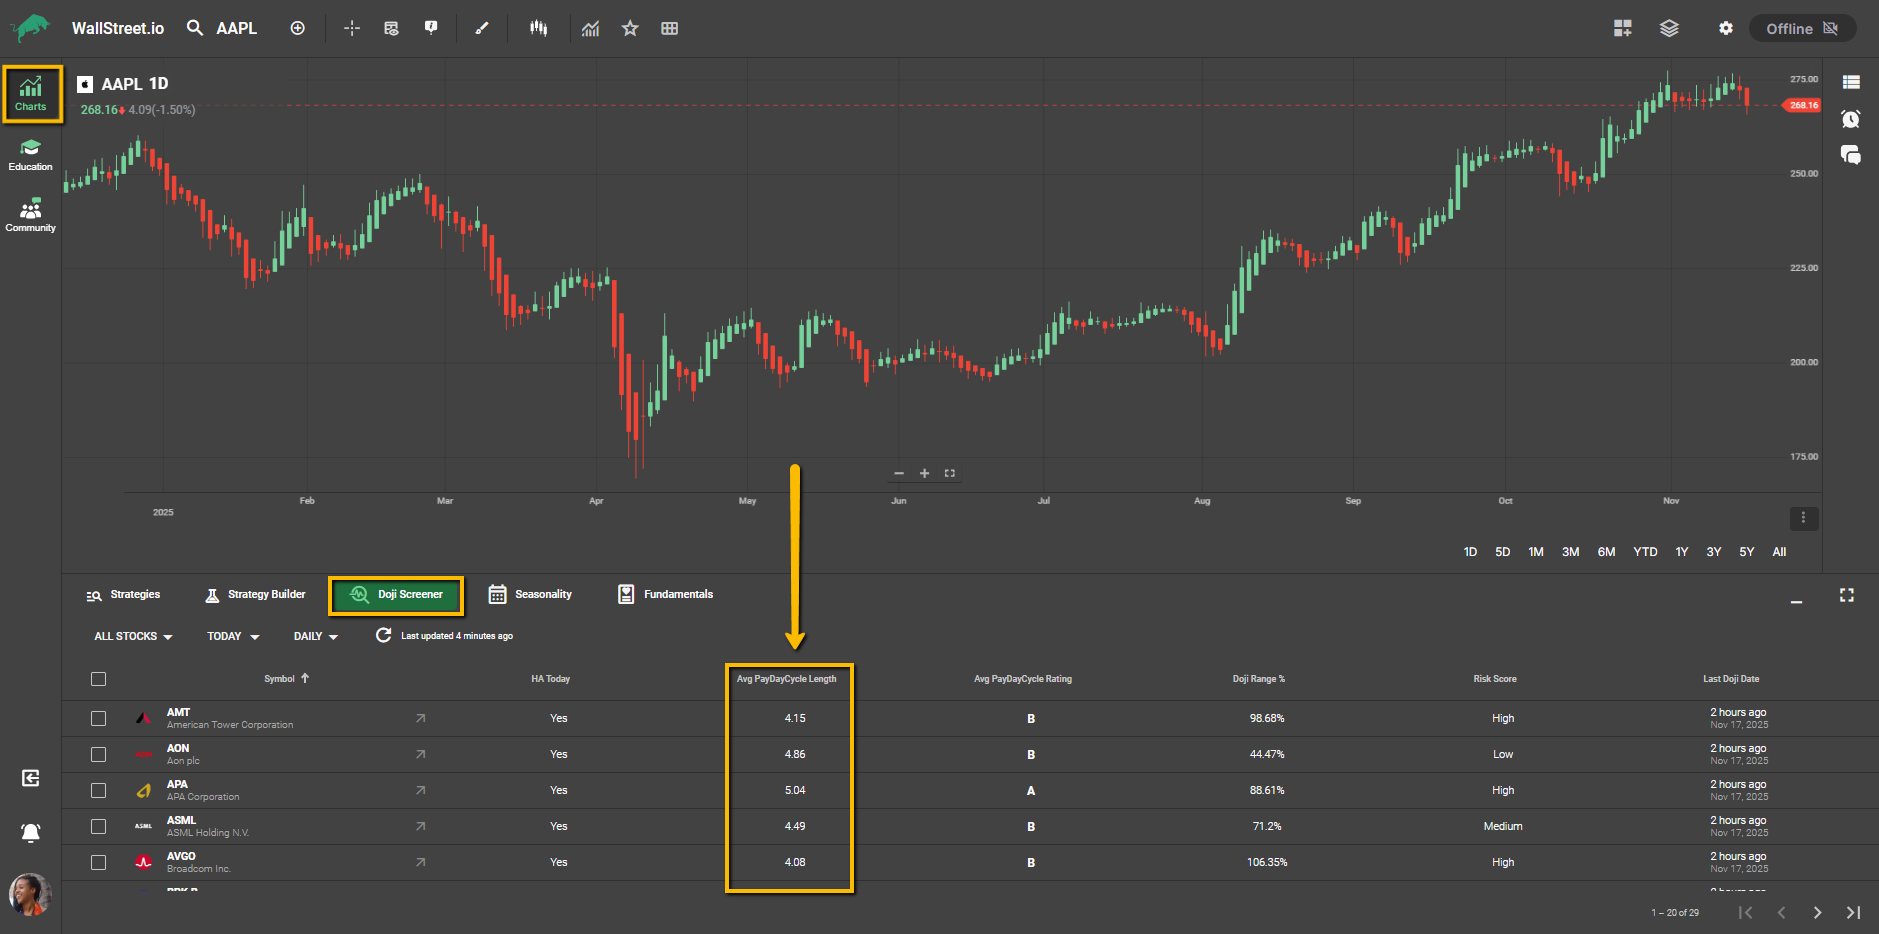
Avg PayDay Cycle Length
Shows the average number of trading days a PayDay Cycle lasts for this symbol after a Doji appears. This is also referred to as Continuity Score, and it tells you how long a bullish move typically continues before momentum cools off.
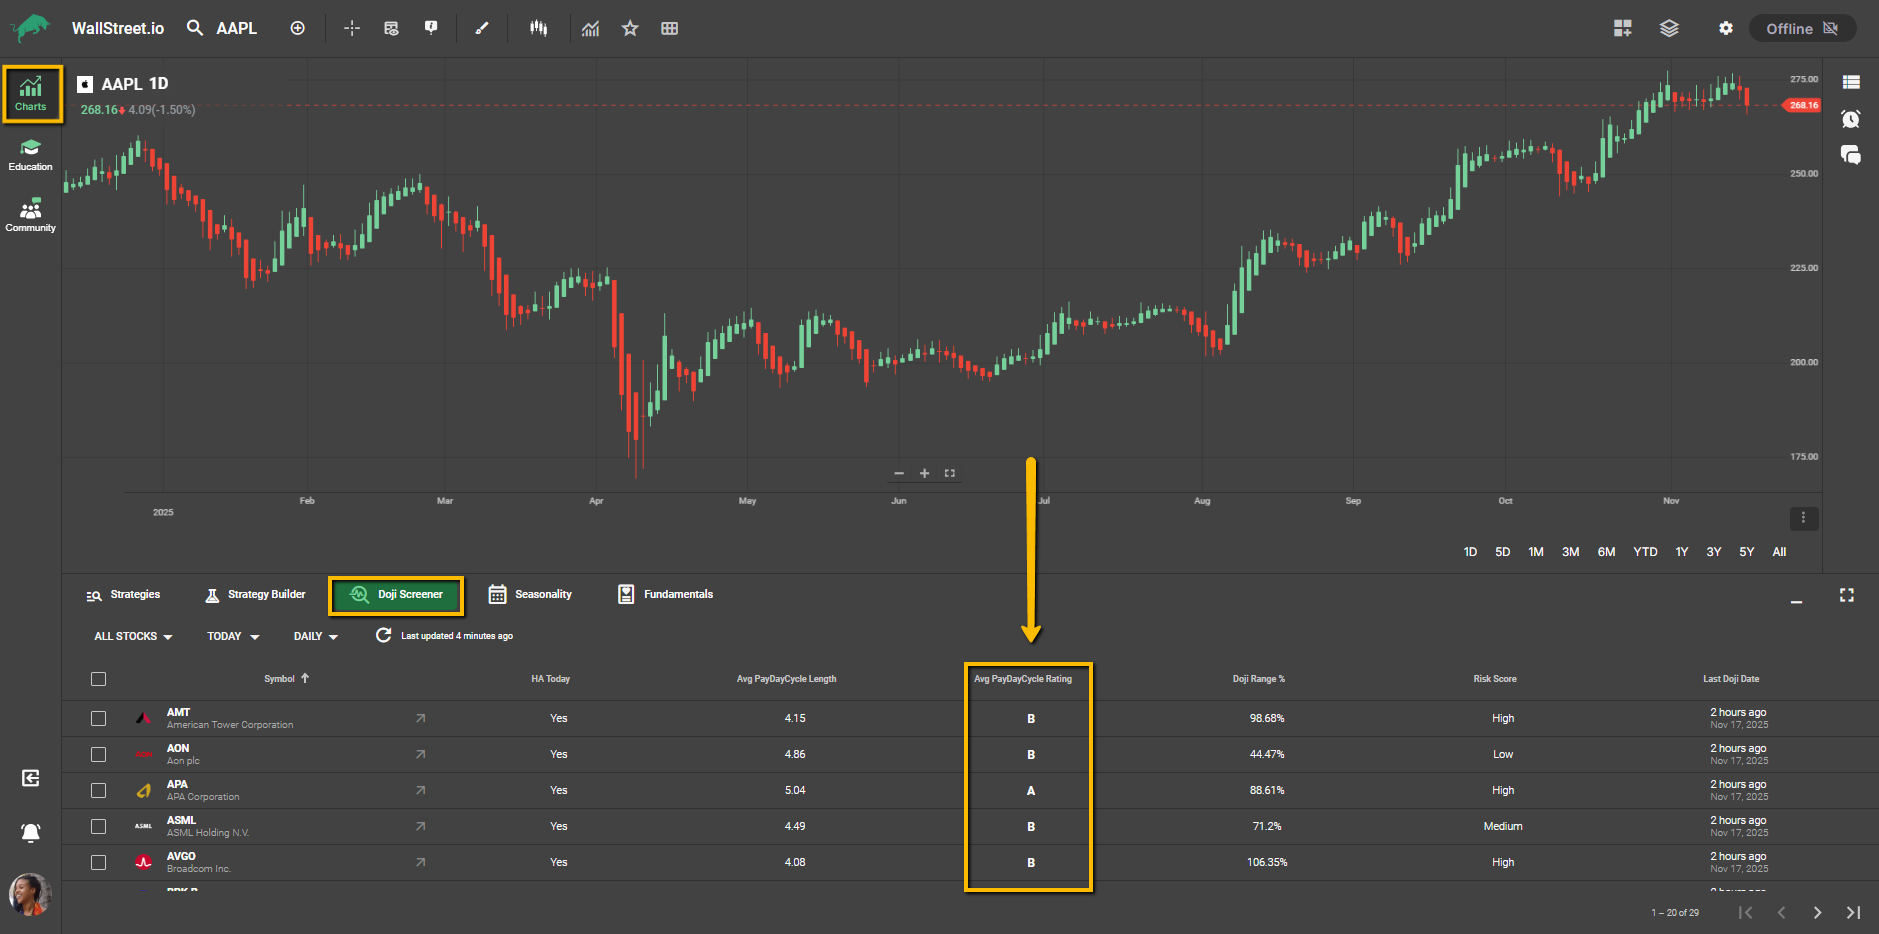
PayDay Cycle Rating
A grade assigned to the strength and historical consistency of the cycle that usually follows a Doji:
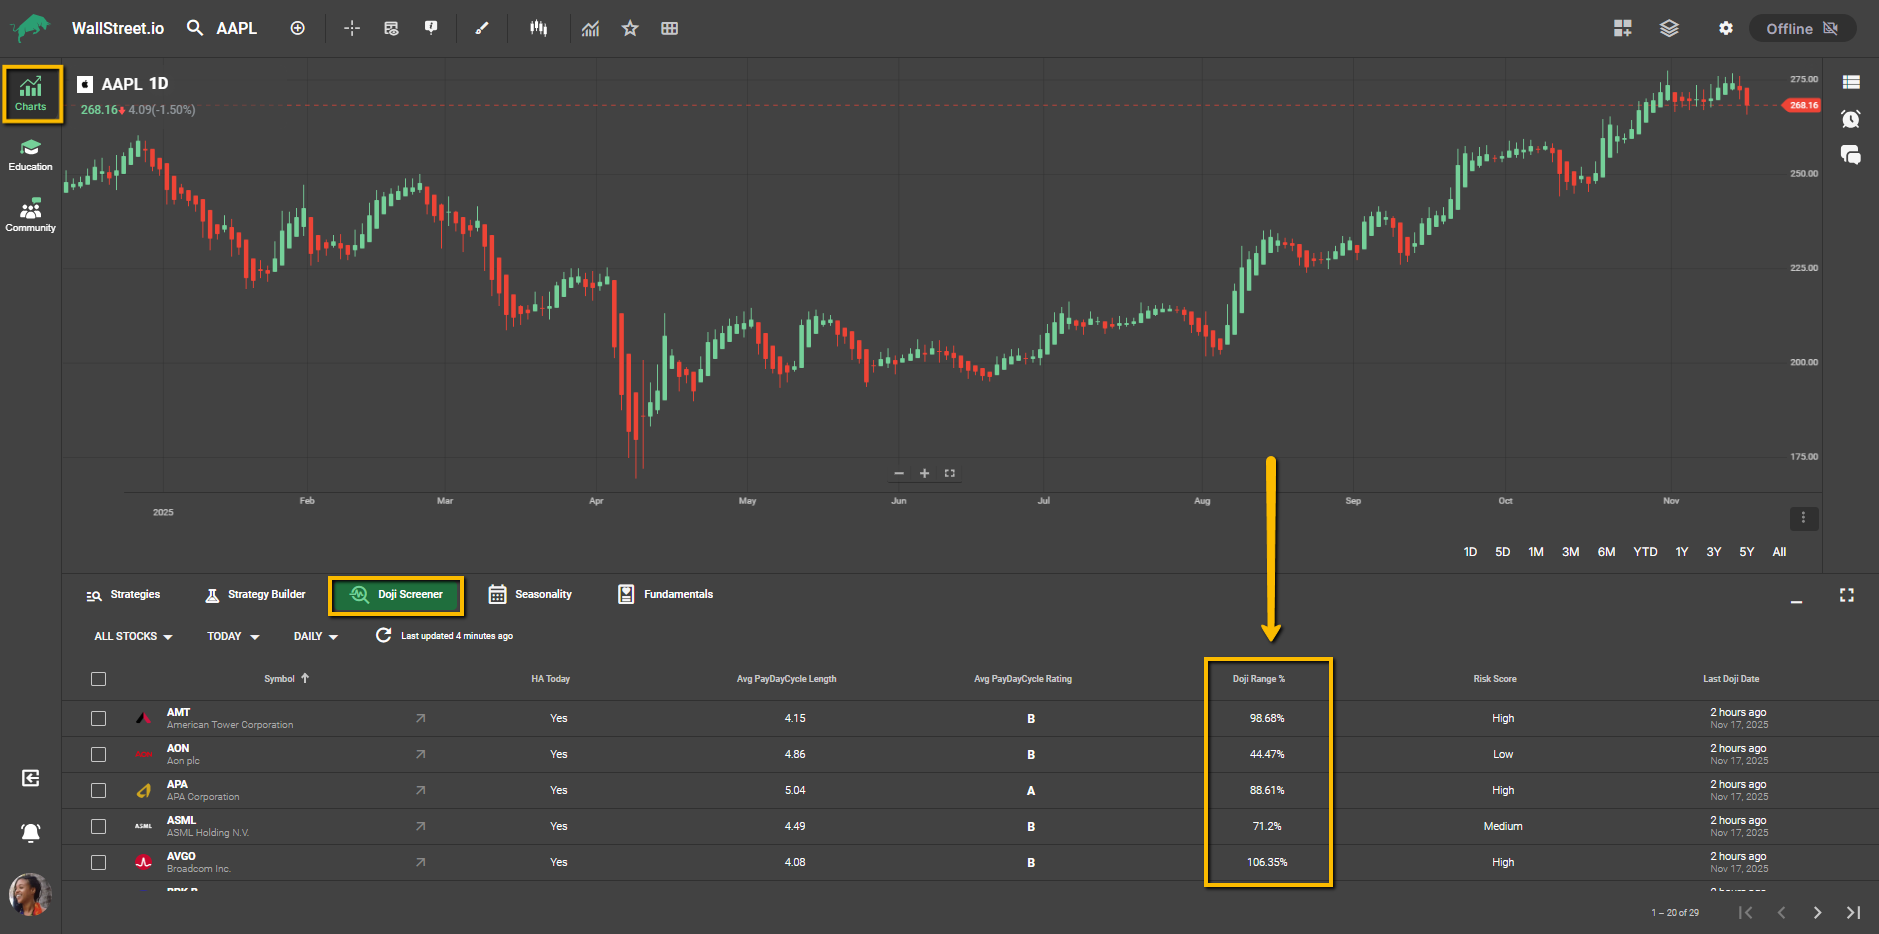
Doji Range %
Represents the size of the Doji candle as a percentage of the symbol’s recent Average True Range (ATR). A smaller percentage indicates a tighter, potentially lower risk entry zone. A larger percentage indicates higher volatility.
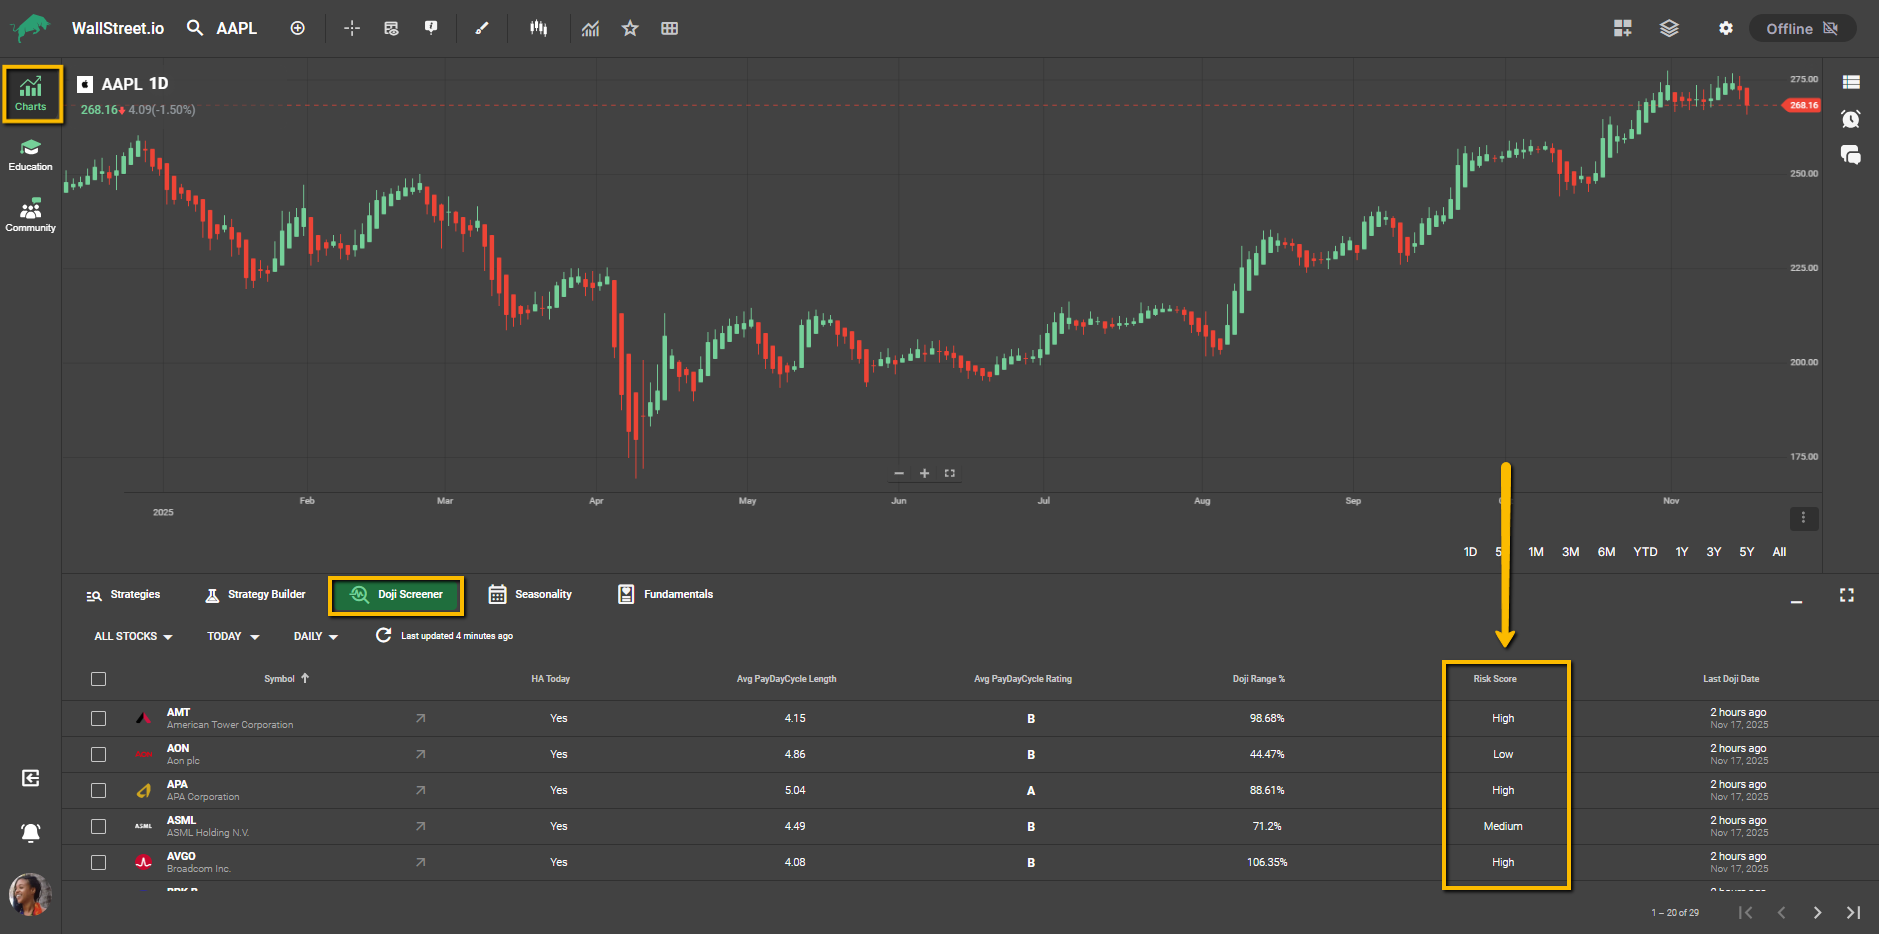
Doji Risk Score
Shows the relative risk of each setup based on how large the Doji is compared with the symbol’s 14-day ATR, to help you quickly filter for setups that match your comfort level before running deeper analysis.
• Low reflects a tighter risk profile.
• Medium reflects moderate volatility.
• High reflects a wider zone where stops may need more room.
Last Doji Date
Shows the most recent confirmed Doji date.
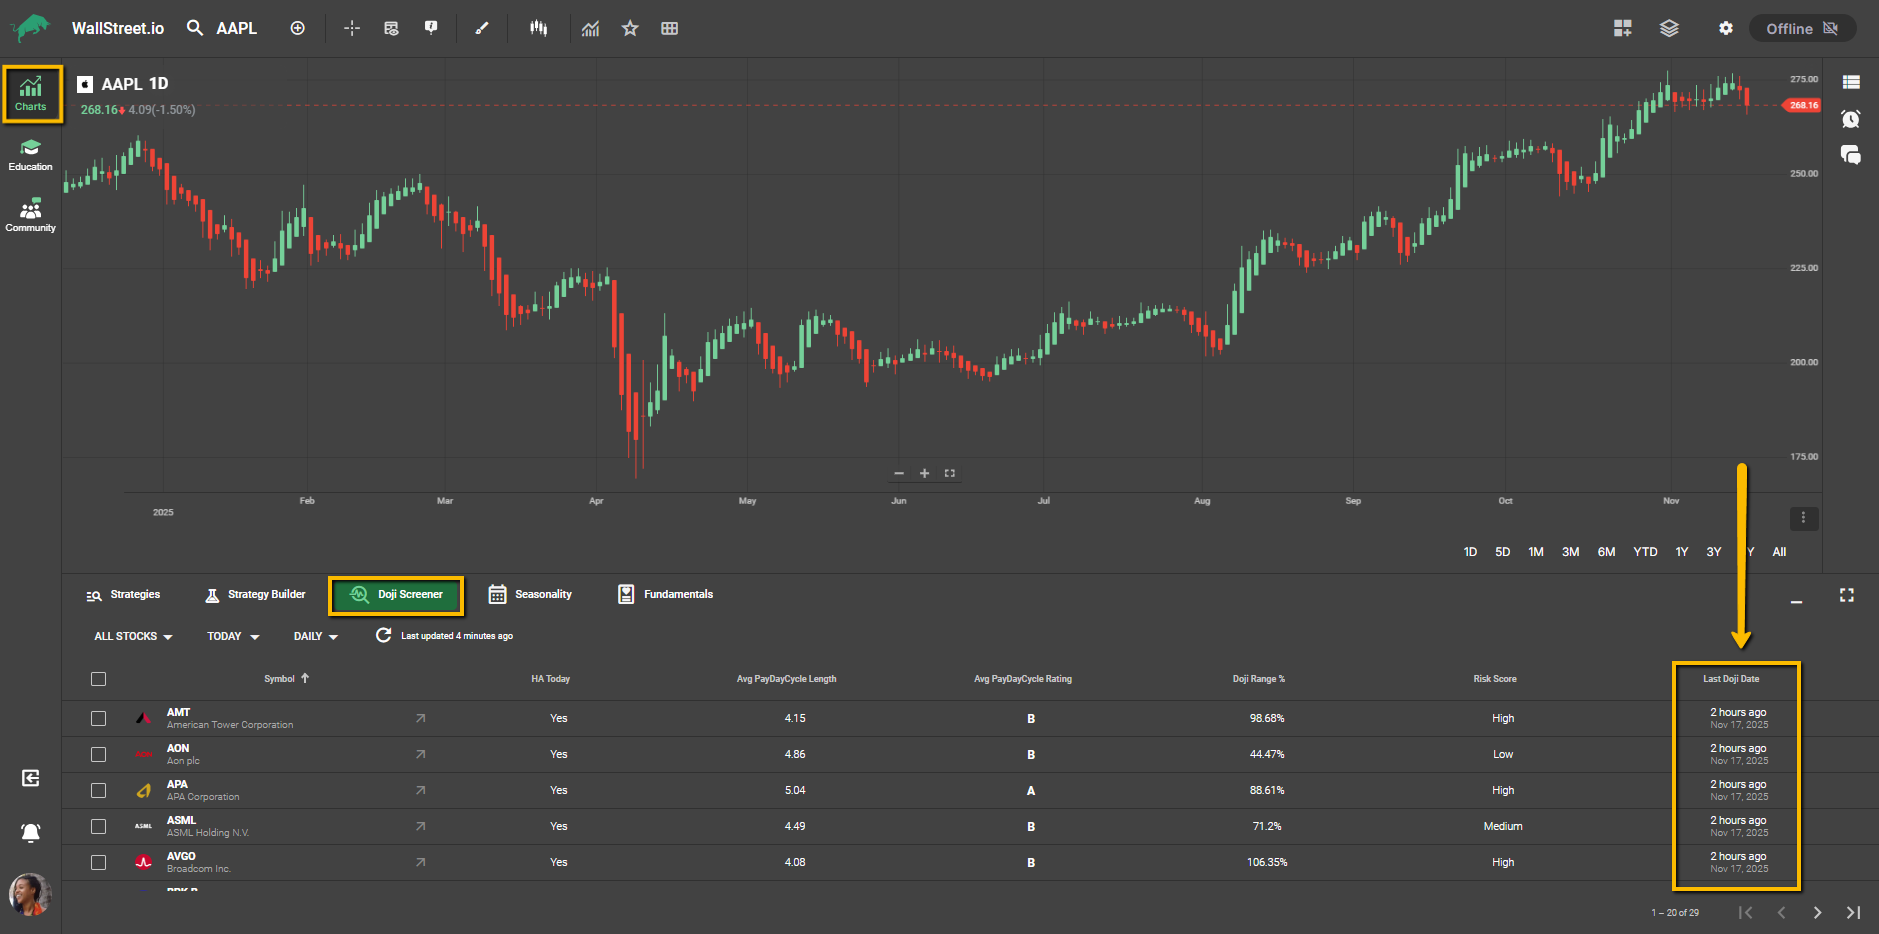
This column only updates after the market has closed (i.e. after-hours). This means if HA Doji Today = Yes, the Last Doji Date will still reflect the most recently confirmed Doji prior to today, until today's candle is confirmed after market close.
Sorting the Screener
You can sort the results by any column by clicking on the column header. For example:
• Click “Risk Score” to group trades from Low to High risk.
• Click “Doji Range %” to rank setups by volatility.
• Click “Avg PayDay Cycle Rating” to prioritize higher-rated opportunities.
The sort order toggles between ascending and descending with each click, so you can move through the data efficiently.
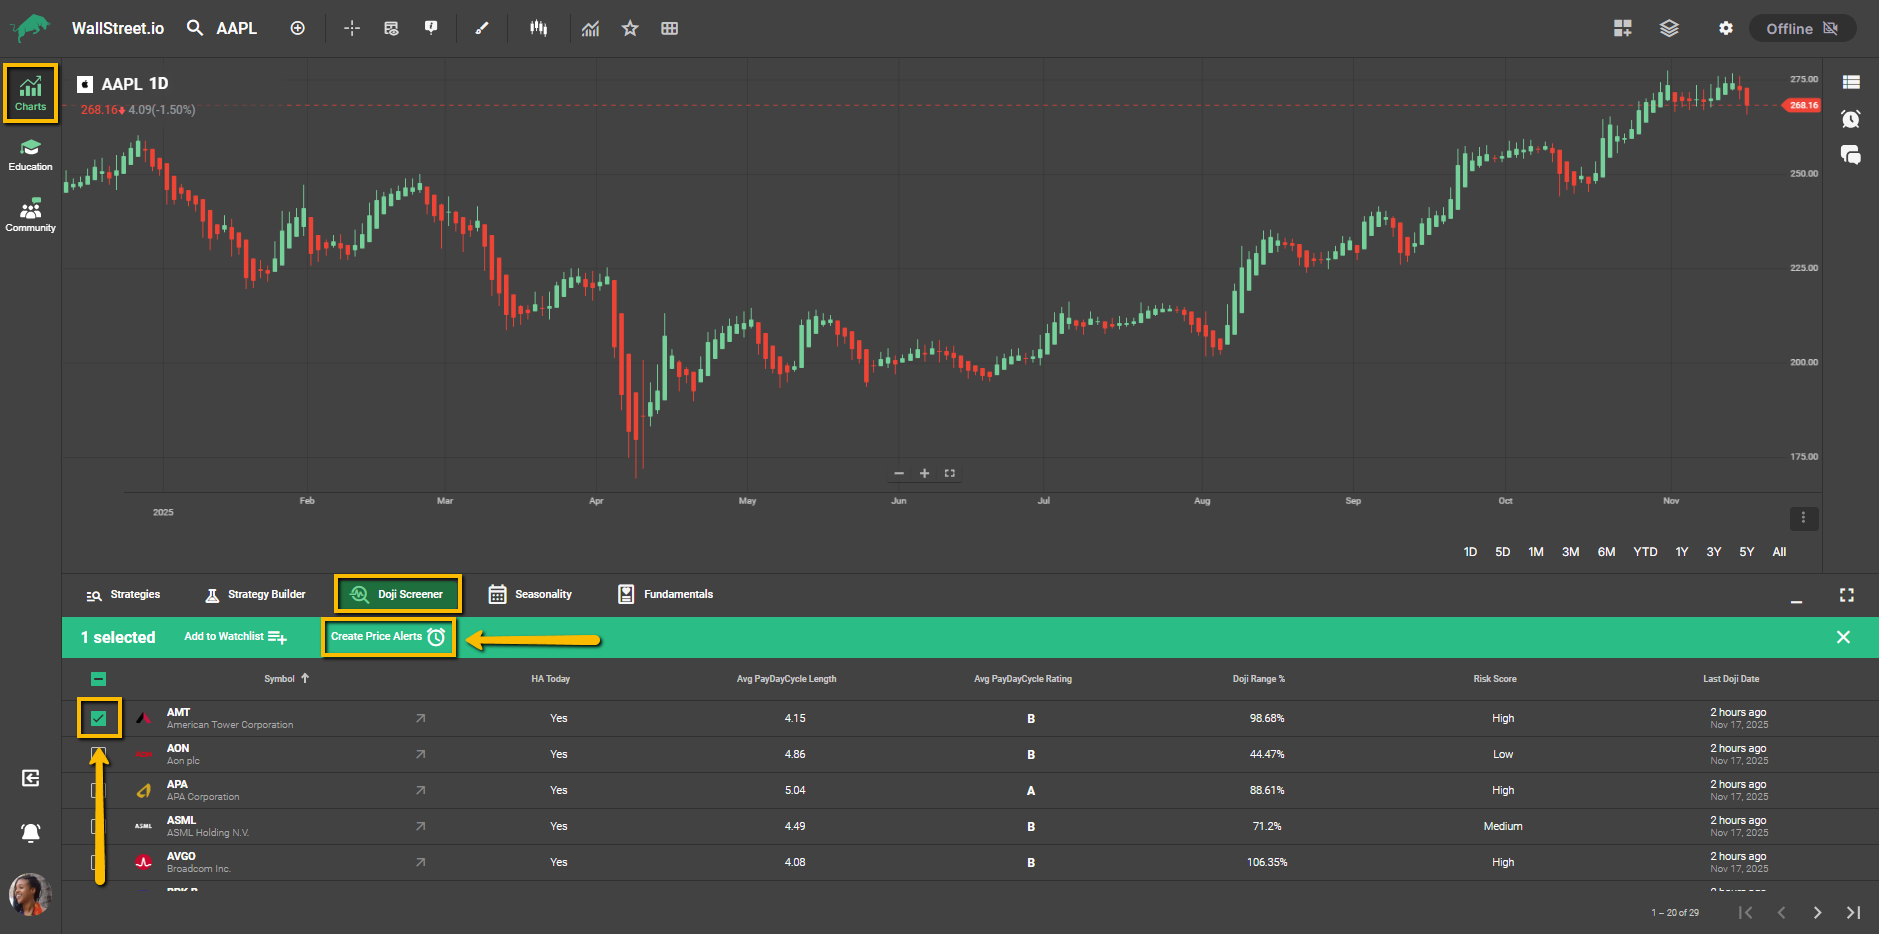
One-Click Doji Alerts
WallStreet.io’s One-Click Doji Alert can automatically create price alerts around the Doji high and low so you can watch for early breakouts without staying glued to your screen.
How It Works
Timeframe Matching
Alert Limits and Behavior
When you create a Doji Alert, you’re really creating two alerts: one for bullish, one for bearish, using Heikin Ashi logic.
If you have reached your alert limit, the system will notify you. Delete older alerts if you want to create space for new ones.
Default Notification Settings
To speed up the process, alerts are created with default notifications:
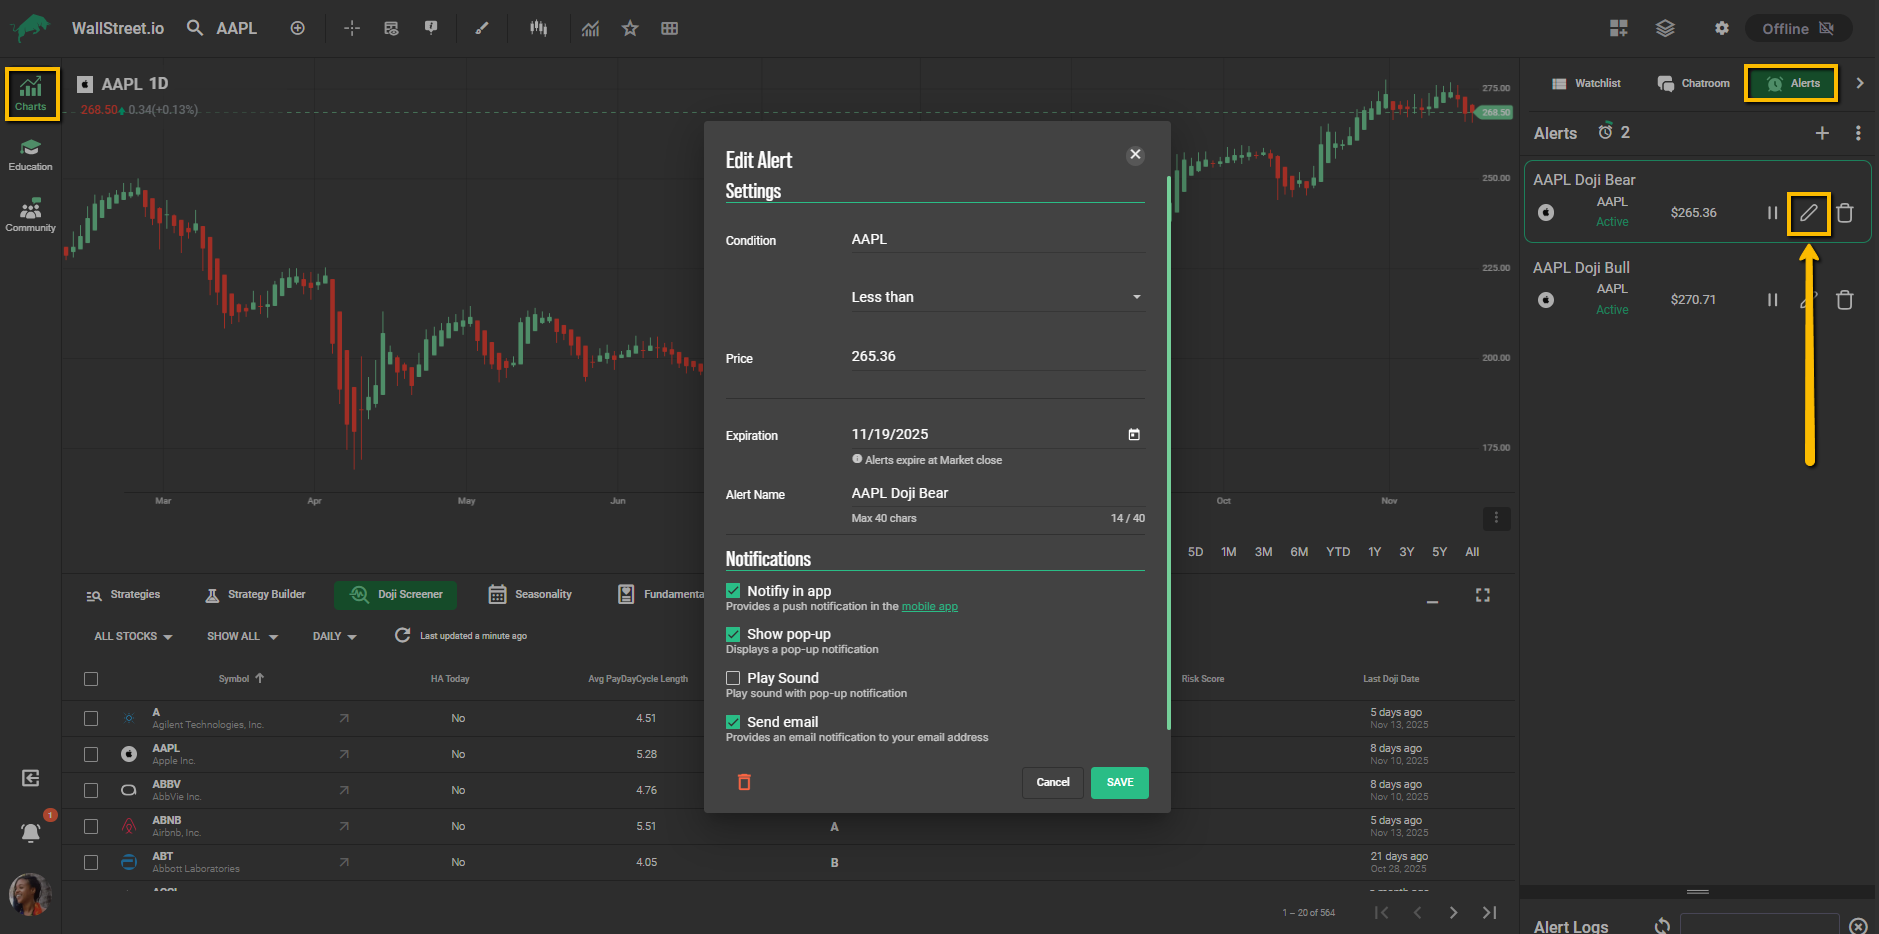
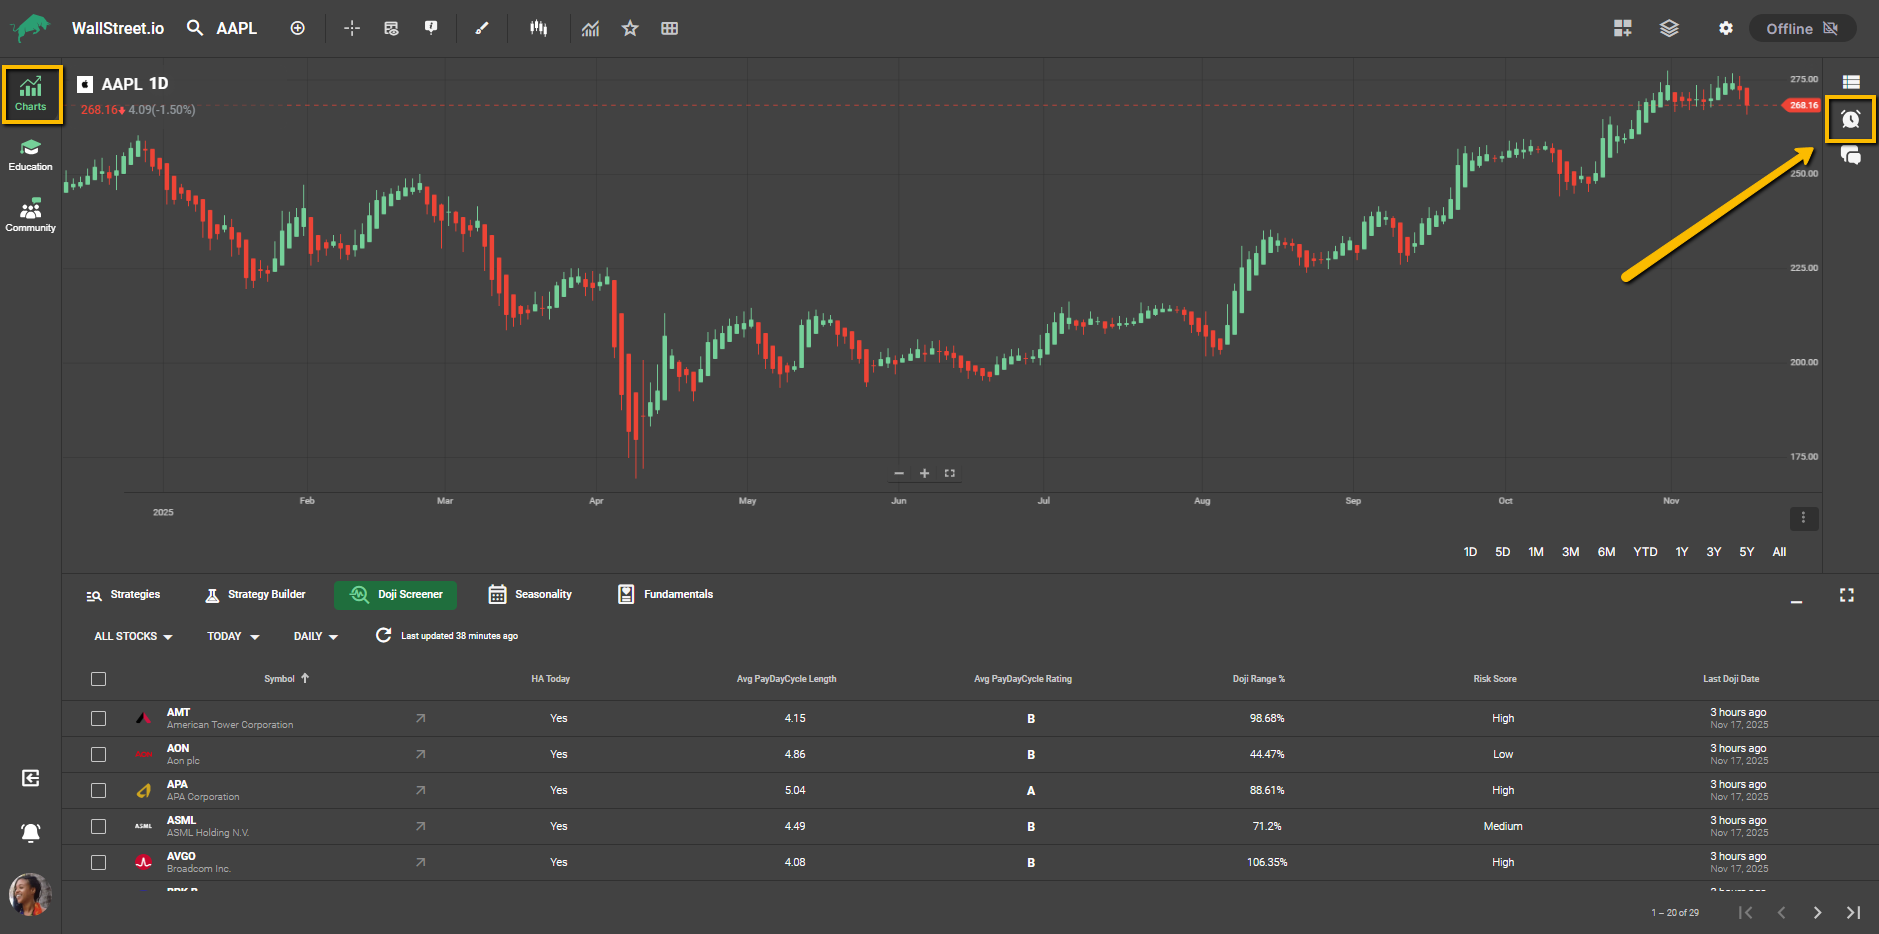
Managing Alerts
To review or delete existing Price Alerts, including One-Click Doji Alerts:
By clicking on the pencil icon next to each Price Alert, you’ll open up a menu that allows you to edit its price levels, customize notification preferences, or change expiration settings.