PayDay Cycle Tools in WSIO
What this helps you do
This article shows you where to find the PayDay Cycle “building blocks” inside WallStreet.io so you can connect the framework to real data on your charts. You will see how each probability stacking data point maps to a specific tool or view, and how the Doji Screener, Strategies tab, Strategy Builder, and Education workspace all support PayDay Cycle decision making. By the end, you should know exactly where to look in WSIO when you want to check the market context, read today’s candle, confirm momentum, or track Doji-based setups.
How this fits into the PayDay Cycle Framework
In the earlier articles, you learned:
This guide answers a very practical question:
“Where do I actually see all of that inside WallStreet.io?”
Think of this page as your map. It does not teach new strategy rules. It shows you where the information lives so you can run your own checklist quickly.
Mapping the 7 data points to WSIO tools
Here is how each probability stacking data point connects to the platform”
Market context → Charts workspace
What you are checking:
Is the overall market helping or fighting this idea?
Where to look:
Use the Charts workspace to:
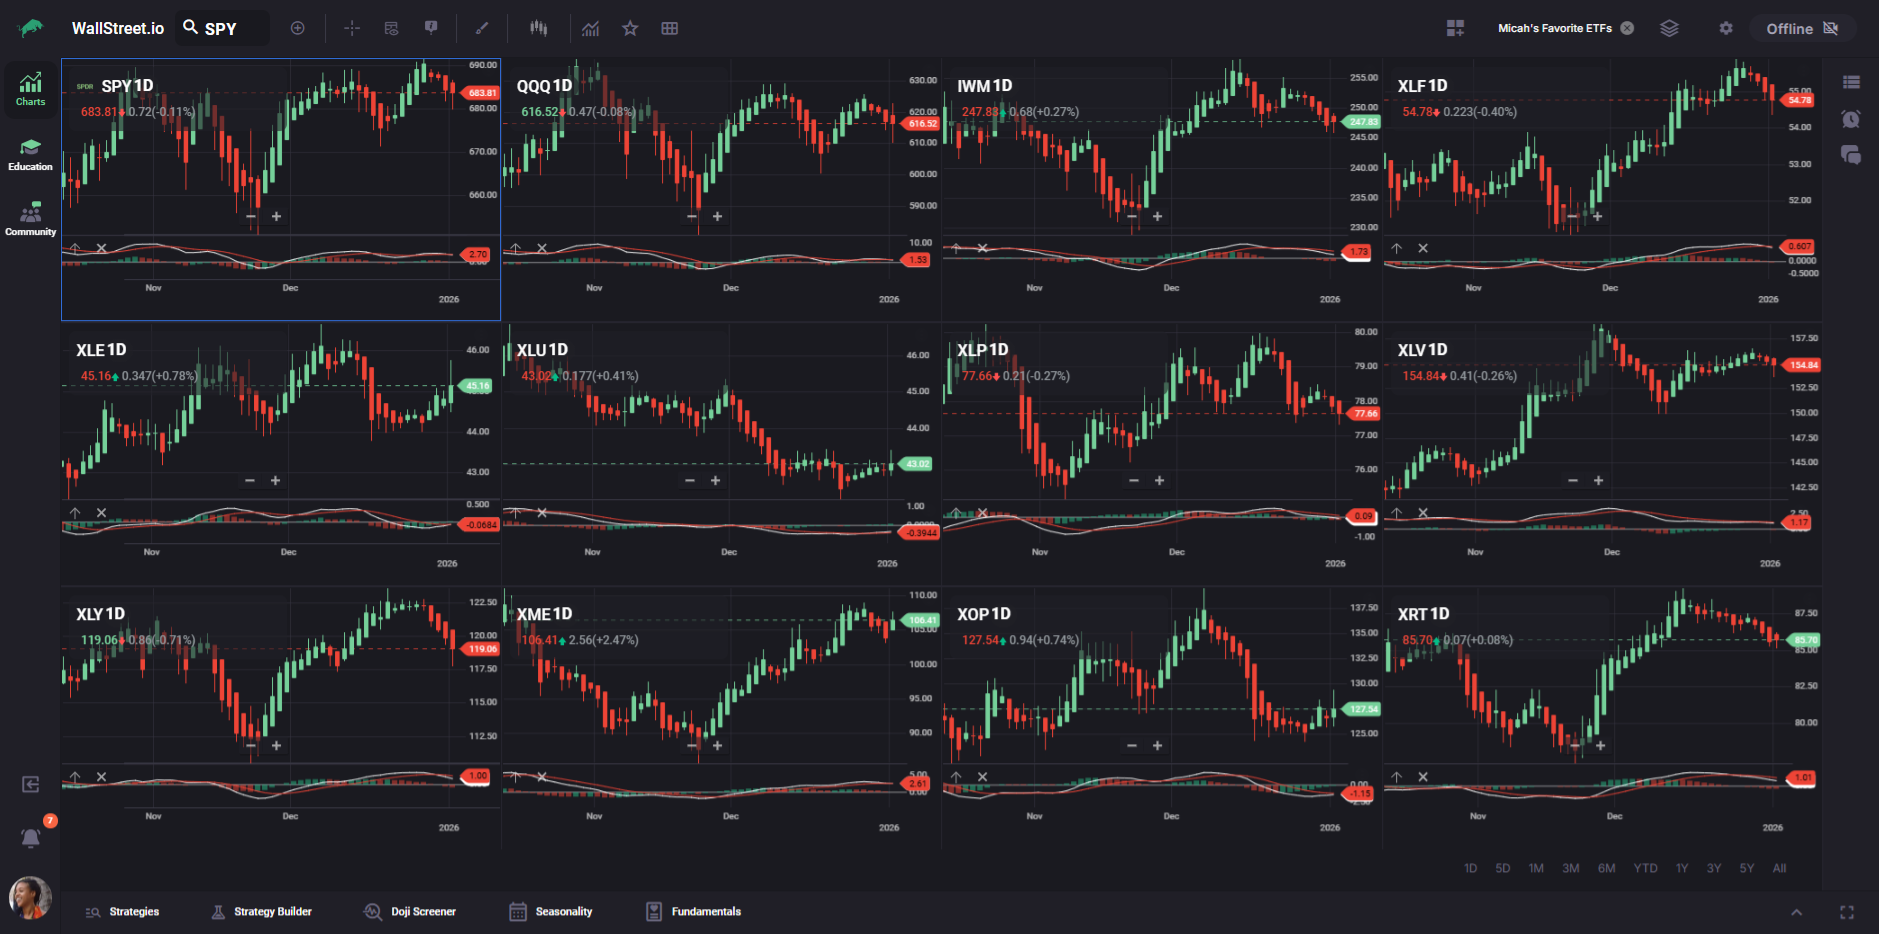
You can think of this as your wind direction. Before you worry about a single stock, you want to know which way the market is leaning.
Events and earnings → Fundamentals tab
What you are checking:
Are there any major events that could shake this stock around?
Where to look:
Open the Fundamentals tab for the symbol and:
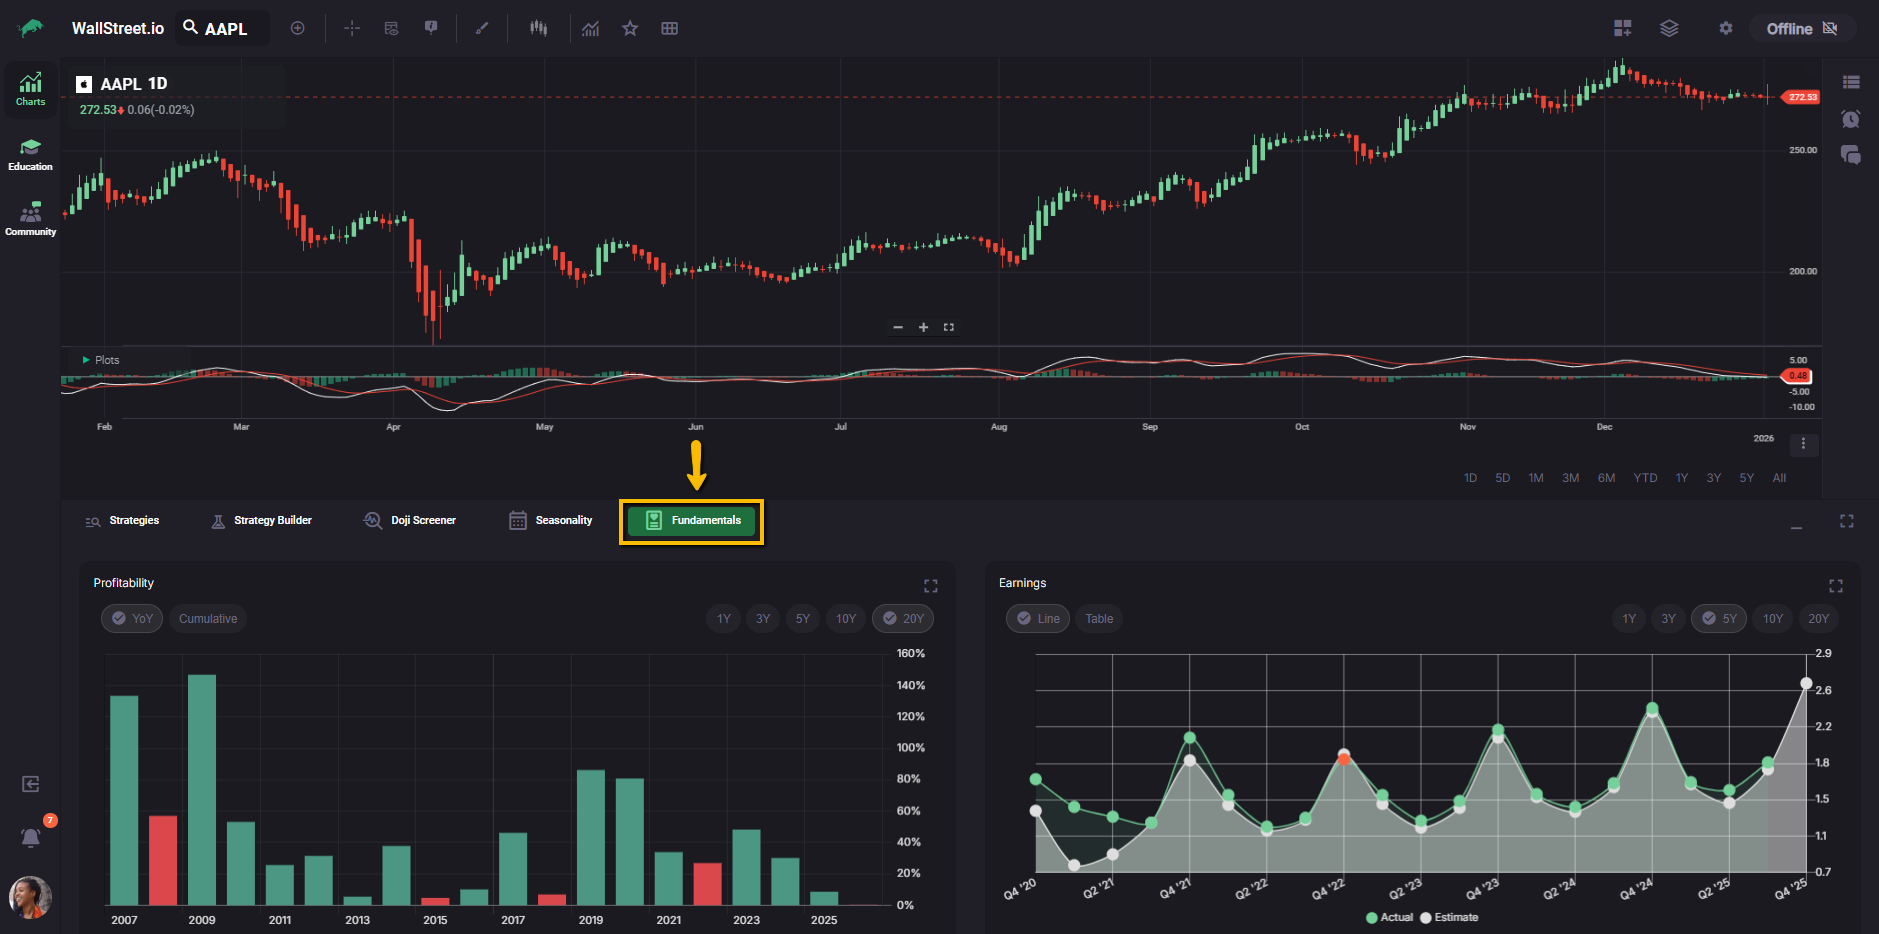
If a key report is just ahead, you decide whether to stand aside, reduce size, or treat the trade as a shorter-term swing.
PayDay Cycle count → Charts + Strategy Builder
What you are checking:
Where are you inside the current PayDay Cycle, and how long do cycles usually last for this stock?
Where to look:
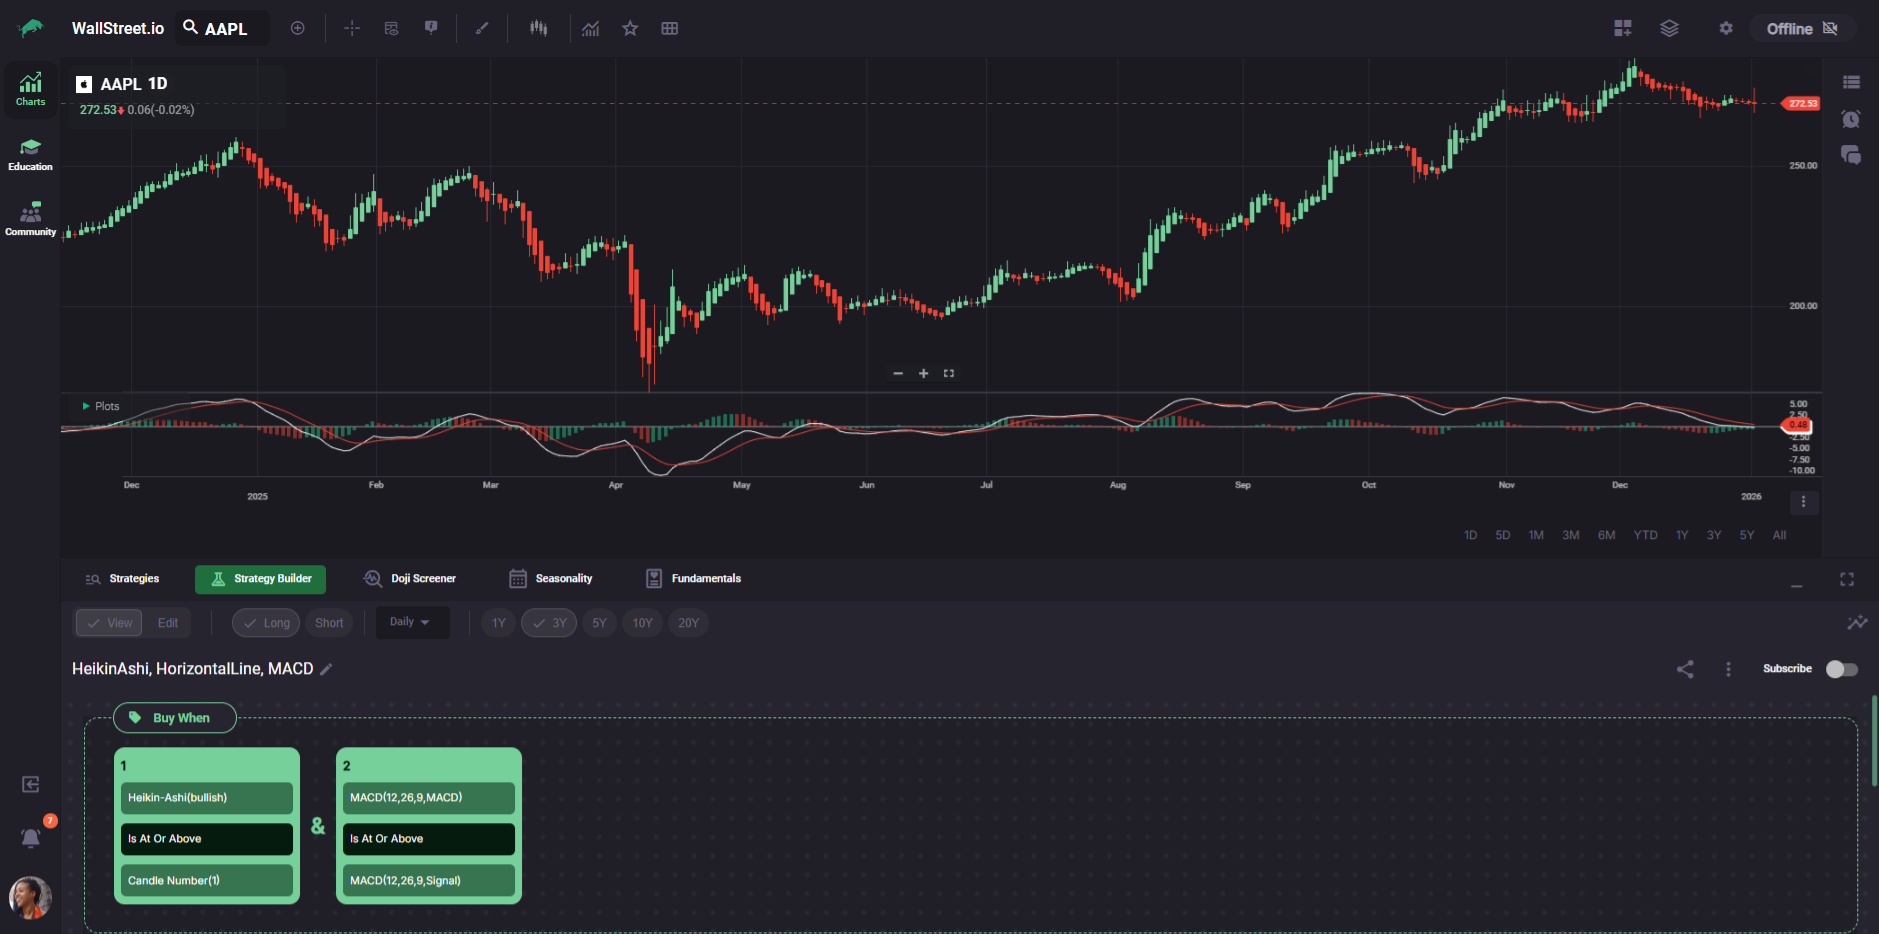
Strategy Builder does not currently use Doji candles as a condition, which is exactly why the Doji Screener exists. You use the Screener to surface symbols with interesting Dojis, and Strategy Builder to understand how PayDay-style strategies perform on those symbols over time.
Today’s candle type → Charts workspace
What you are checking:
What is today’s Heikin-Ashi candle saying about strength, exhaustion, or indecision?
Where to look:
On the Charts workspace, with the symbol set to Heikin-Ashi:
This is where your “candle health” skills come into play. Today’s bar either adds confidence to your idea or warns you to slow down.
MACD trend → Charts + Strategy Builder
What you are checking:
Is momentum lining up with the direction of the PayDay Cycle?
Where to look:
Charts give you the live read. Strategy Builder gives you the “how has this type of setup behaved in the past” insight.
Technical context and support → Charts workspace
What you are checking:
What is the bigger technical picture around this stock?
Where to look:
Use the Charts workspace to:
This is where you ask whether you are stacking a new PayDay Cycle on top of a bigger uptrend, or trying to push a countertrend idea into strong resistance.
Seasonality → Seasonality tab
What you are checking:
Is the historical tendency for this month or upcoming period helping or hurting your thesis?
Where to look:
Open the Seasonality tab for the symbol:
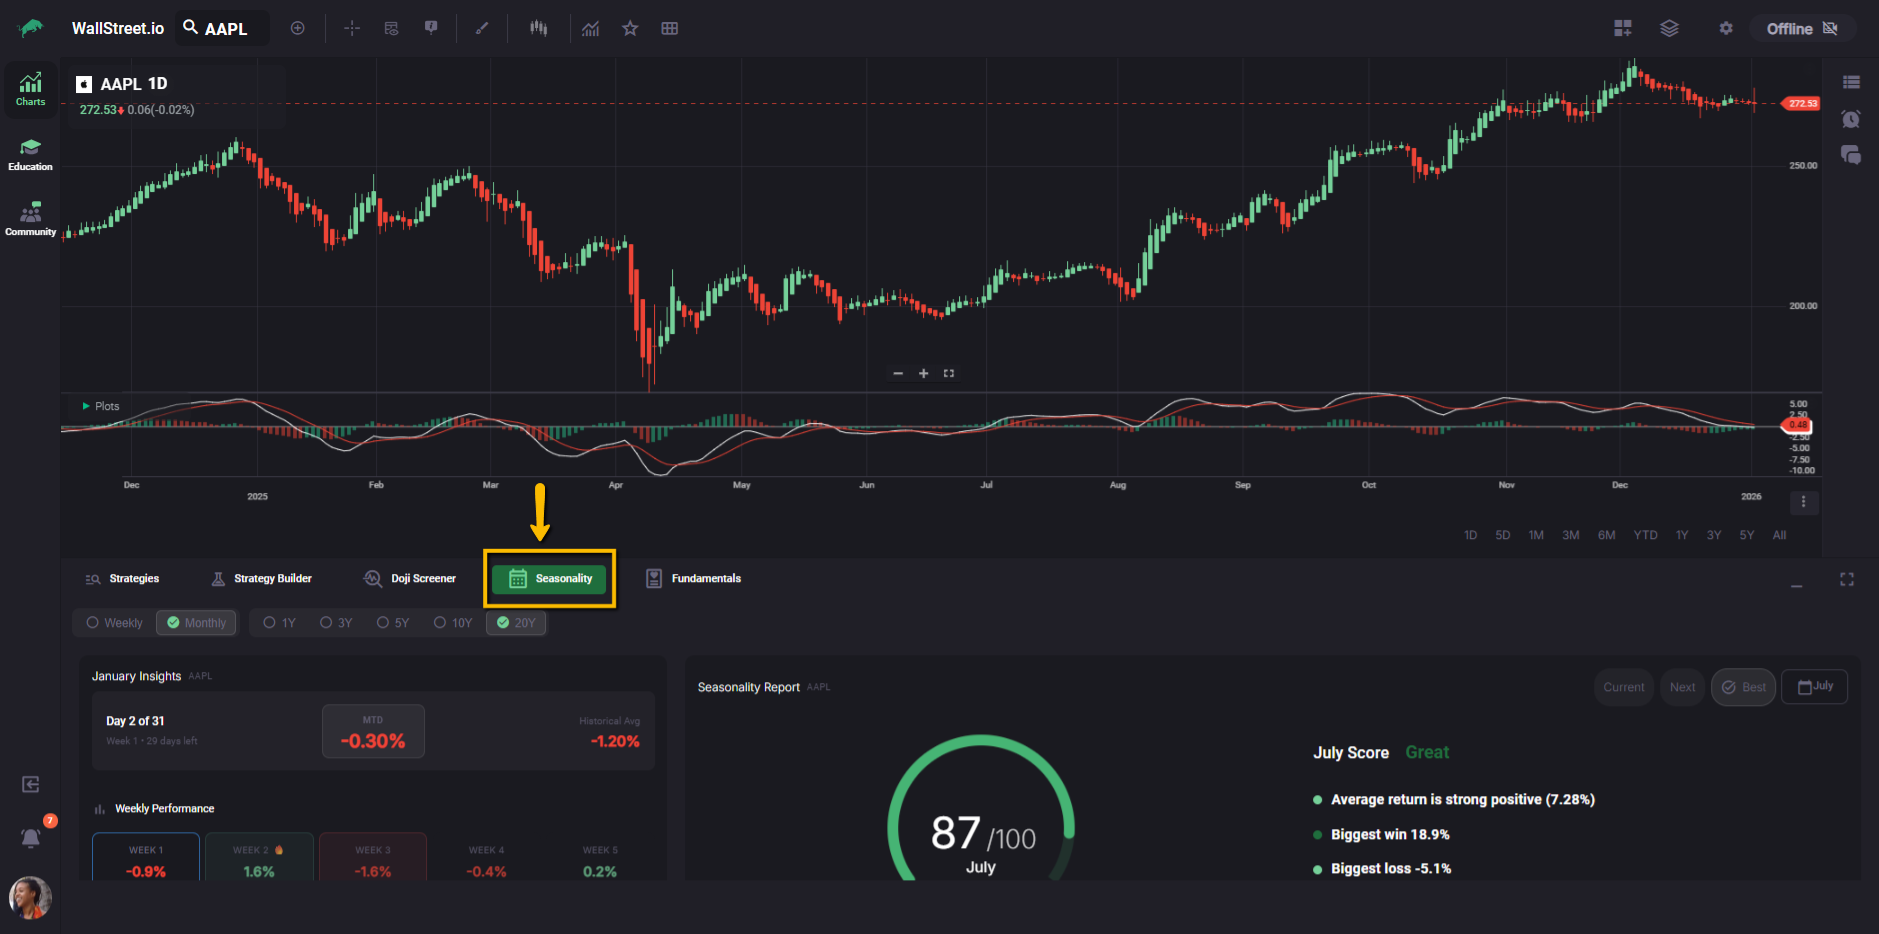
Seasonality is a “nice to have” in the stack. It usually does not override a clear PayDay Cycle story, but it can nudge you toward or away from a marginal setup.
Where the Doji Screener fits into the picture
The Doji Screener is built specifically to help you work with Doji logic inside the PayDay Cycle framework.
Since Strategy Builder does not use Dojis as a condition, the Screener fills that gap:
In practice, you might:
Strategies, Strategy Builder, and probability stacking
The Strategies tab and Strategy Builder turn the PayDay Cycle ideas into something you can test and reuse.
Together, these tools help you move from “this looks good on today’s chart” to “this kind of setup has a history I am comfortable with.”
Education workspace and the 90-Day Roadmap
Finally, the Education workspace and the 90-Day Roadmap programs give you deeper training on how to put all of this together.
Not every member will have access to these courses, but if you do, they are the place where Micah goes into more detail than we can cover in public reference guides.
This “PayDay Cycle Tools in WSIO” article is your quick map. The Roadmaps are the full class.
Putting it all together
When you combine the framework with the tools, your routine might look like this:
The next step in this section, PayDay Cycle FAQ’s, will answer common questions traders run into as they start combining these tools with the framework.