Grids (Multi-Charts) Complete Guide
What this helps you do
Grids (Multi-Charts) let you view multiple charts at the same time, so you can compare symbols, timeframes, and strategy overlays side by side without constantly swapping your main chart.
Overview
The Grid feature (also called Multi-Chart) controls how many charts you see at once and how they’re arranged inside your charting workspace.
A Grid is one piece of a larger “Chart Setups” system:
Where Grids live
Grid controls are accessed from the Chart Toolbar at the top-right of the chart.
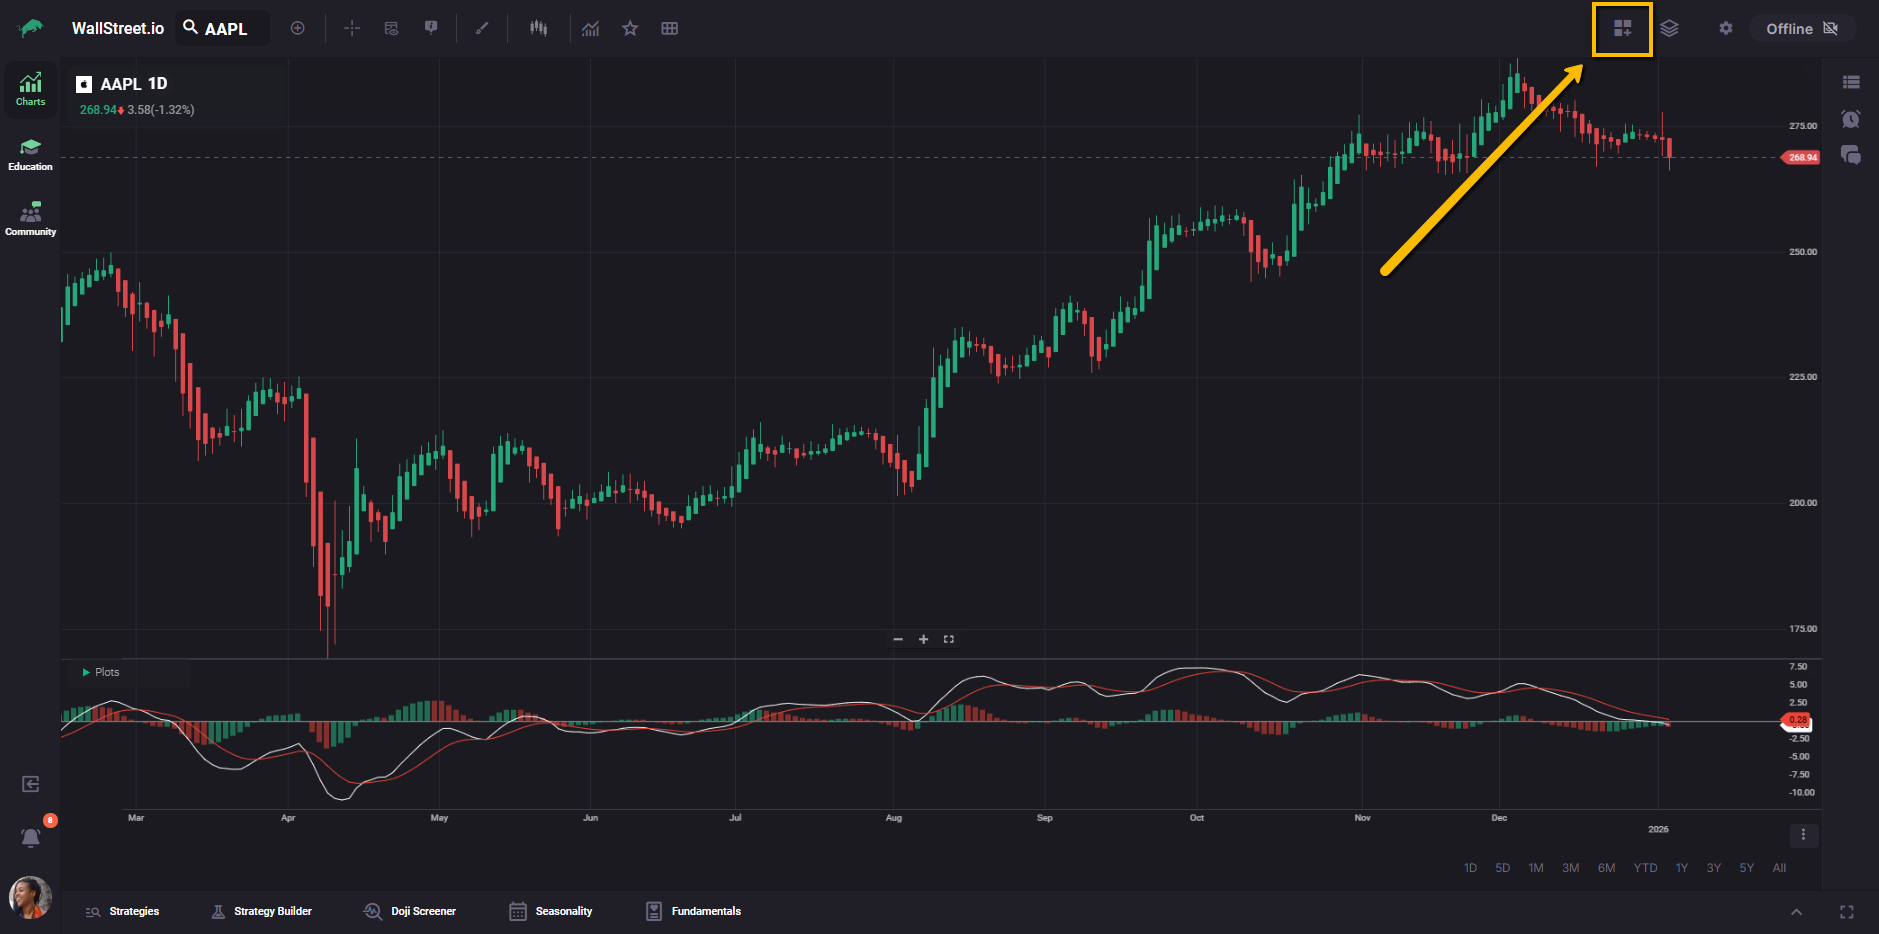
The Grid icon appears as three small squares with a plus symbol, representing the ability to add and arrange multiple charts in a grid.
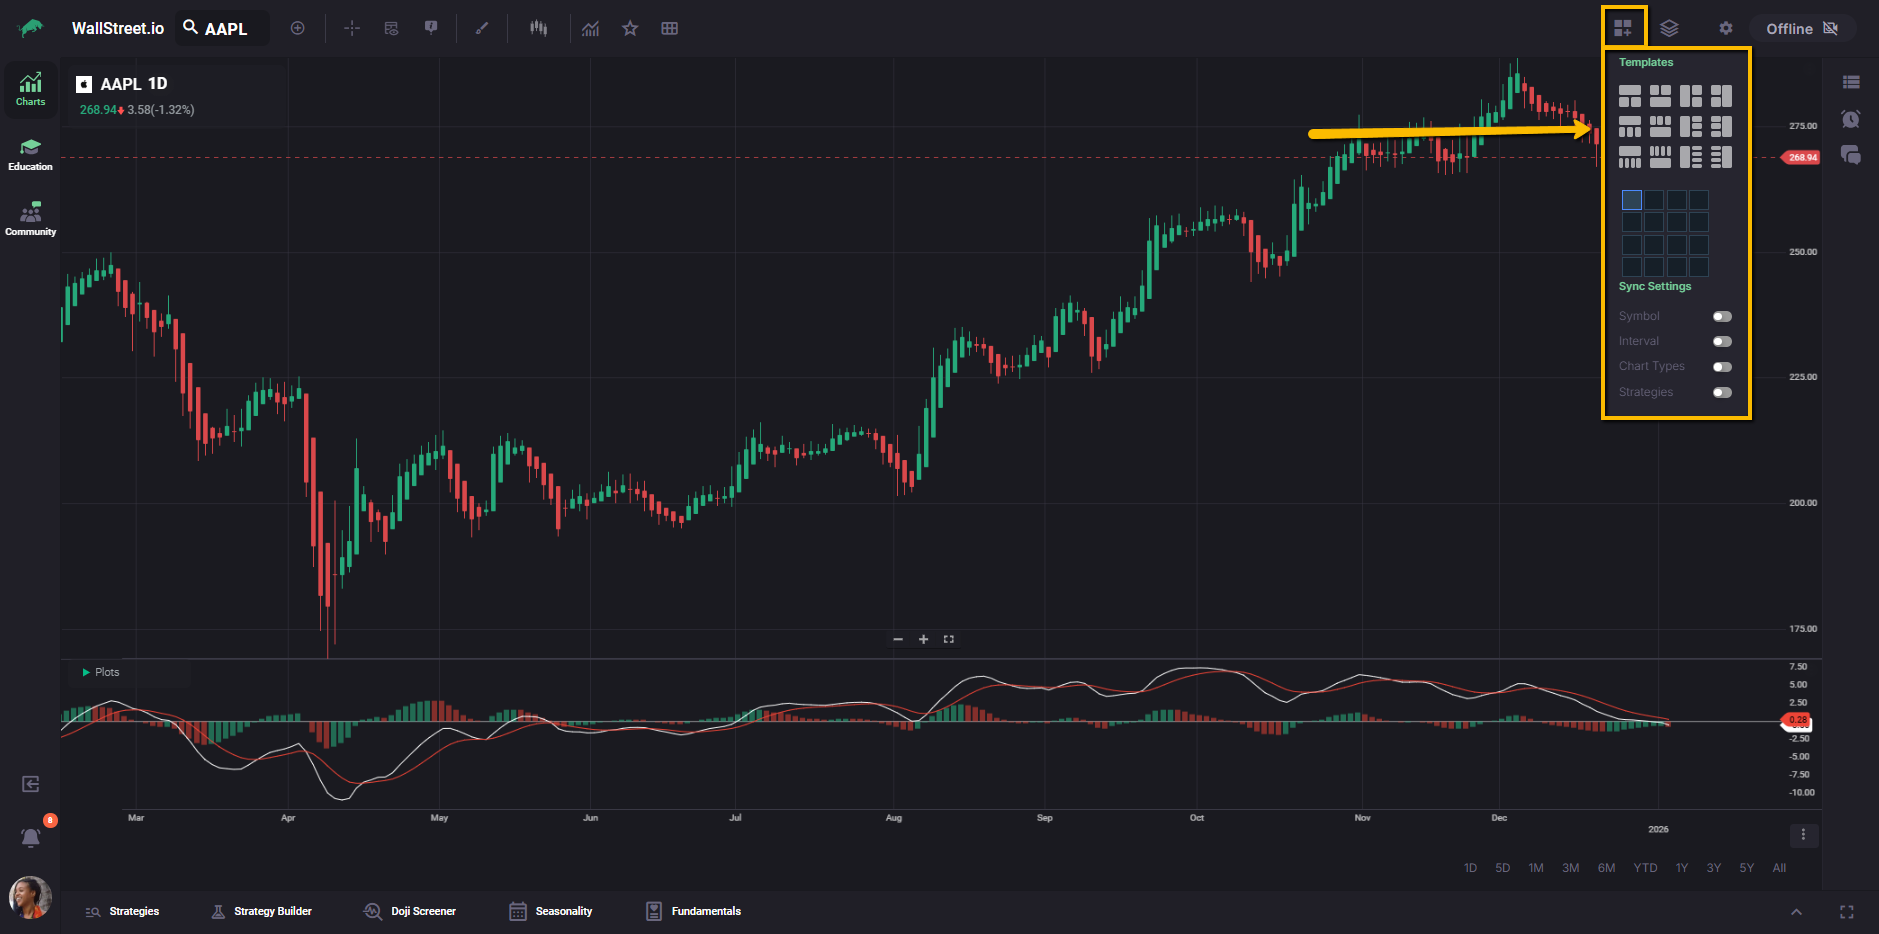
Selecting this icon opens the Grid menu, where you can choose a predefined multi-chart template and adjust grid-level sync settings.
This icon is distinct from the Layouts icon beside it, which appears as stacked layers and is used to save or load full chart workspaces.
Grid templates
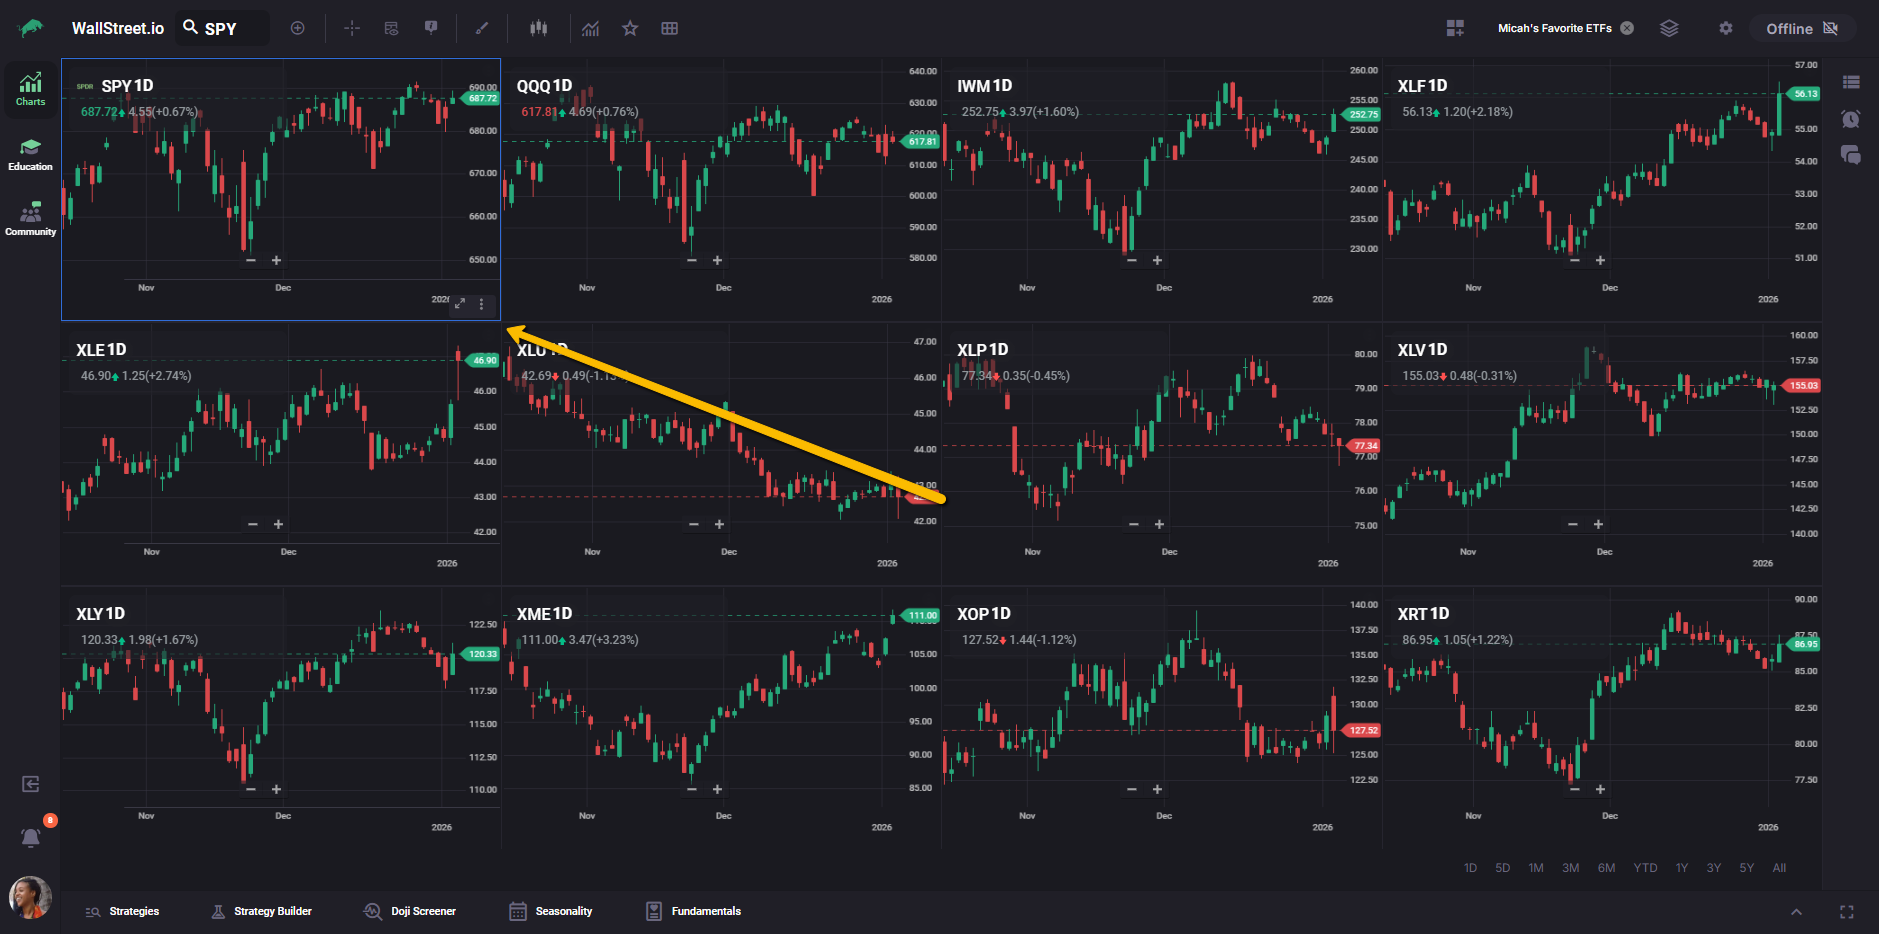
The Grid menu includes a collection of predefined templates that change the number of visible charts and their layout. Templates range from smaller multi-chart views to layouts that display up to sixteen charts at once.
Templates represent arrangements only. Each chart inside the grid can still carry its own symbol, timeframe, indicators, and strategy overlay unless you use sync settings.
Active chart focus
Within a Grid, one chart is always “active.” The active chart is visually indicated by a highlight outline, and it is the chart whose settings you are currently interacting with.
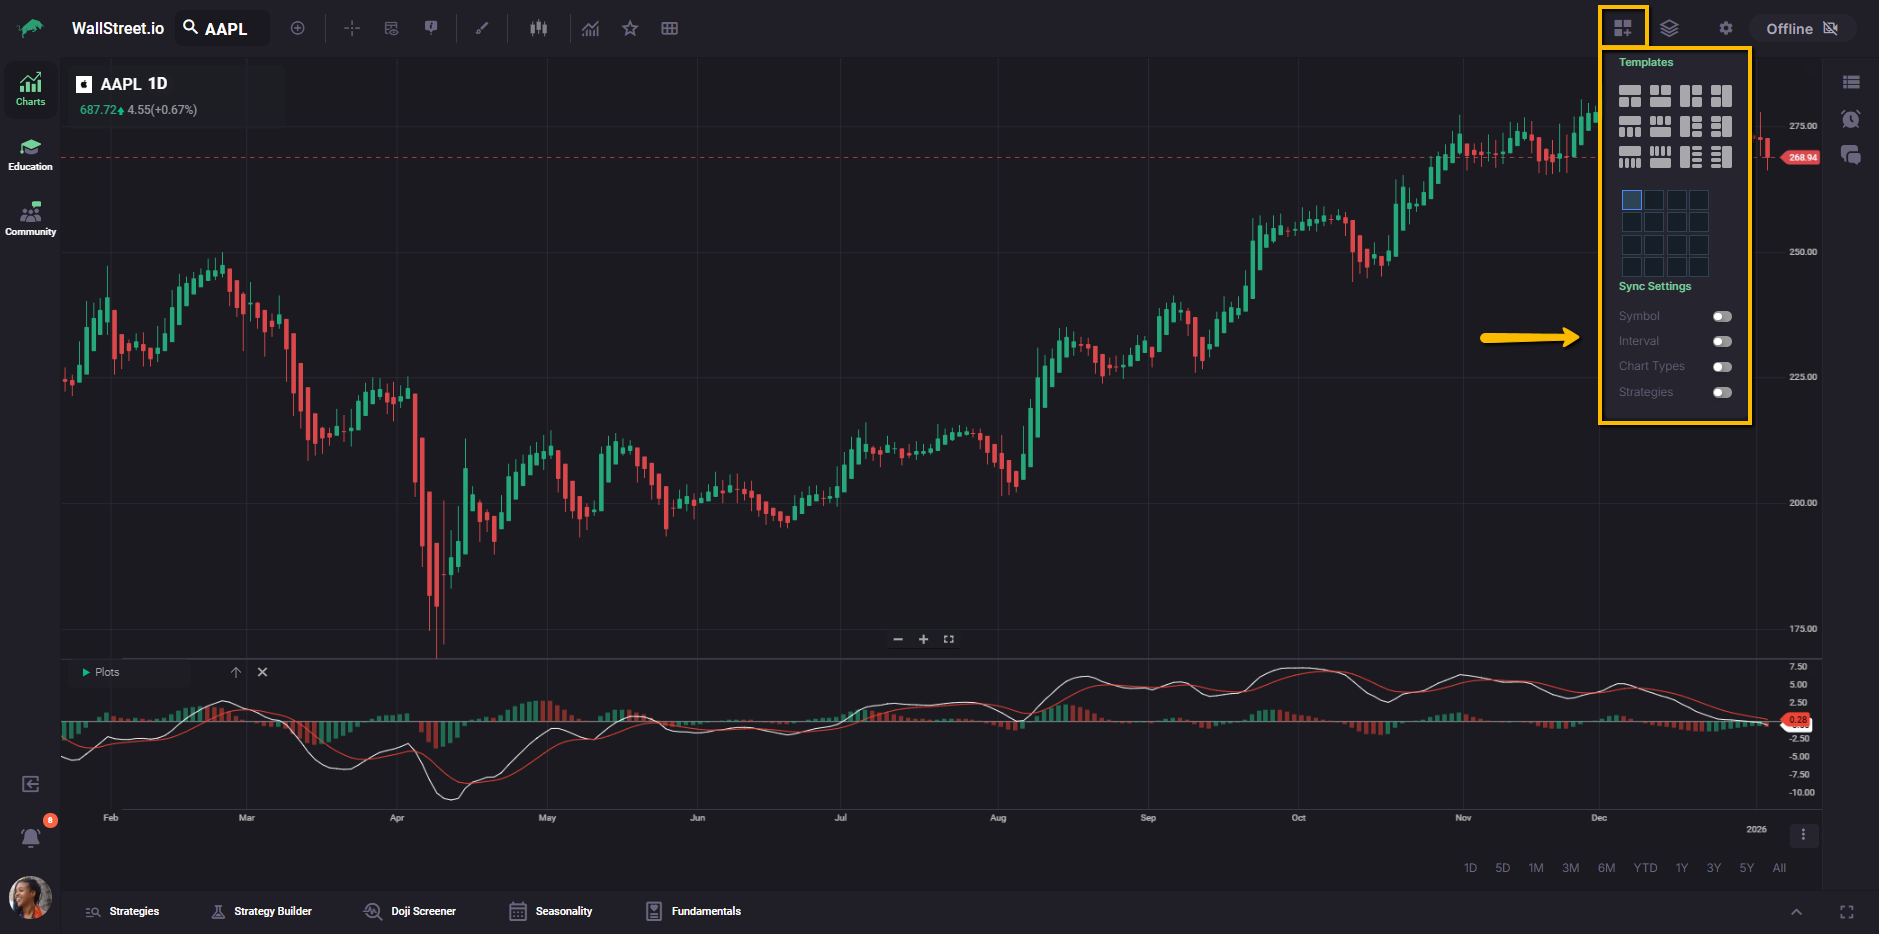
Sync settings
Grids include Sync Settings that can synchronize specific chart attributes across all charts in the current grid. Each sync option is independent, so you can synchronize one attribute (like Interval) without synchronizing others (like Symbol).
| Sync setting | What it synchronizes across the grid | What changes when you adjust one chart |
| Symbol | The ticker symbol | Changing the symbol in one chart updates the other charts to that same symbol. |
| Interval | The chart interval or timeframe | Changing the interval in one chart updates the other charts to that same interval. |
| Chart Types | The chart type (candles, bars, line, etc.) | Changing the chart type in one chart updates the other charts to that same chart type. |
| Strategies | The selected strategy overlay | Applying a strategy in one chart applies that strategy selection across the other charts. |
Grids and Layouts
A Grid controls what you see right now. A Layout can store a multi-chart workspace so it can be restored later, including the grid arrangement and what was loaded inside the charts.
Grids also include toggles that affect synchronization behavior. If a sync toggle is enabled when a Layout is loaded, the enabled toggle can override what you expect to see based on the Layout’s original state.
Grids and Smart Studies
Each chart inside a Grid functions as its own independent Smart Studies workspace. If you have a strategy overlay or backtest context visible on one chart, switching your active chart can make it look like that strategy “disappeared.” In practice, the strategy remains attached to the specific chart where it was applied, and the newly active chart is simply showing its own configuration.
This behavior allows multiple charts in the same grid to hold separate strategy or backtest contexts without interfering with each other.
Mobile Companion App note
Chart Setups (including Grids) are not officially supported on the Mobile Companion App. For consistent Grid behavior and full chart setup controls, use the desktop web platform.
Related guides
If you want to understand how full workspaces are saved and restored, see Layouts (Complete Guide).
If you want to understand chart-level presets, see Indicator Sets (previously Views).