Drawing Tools Library
Shapes and Text
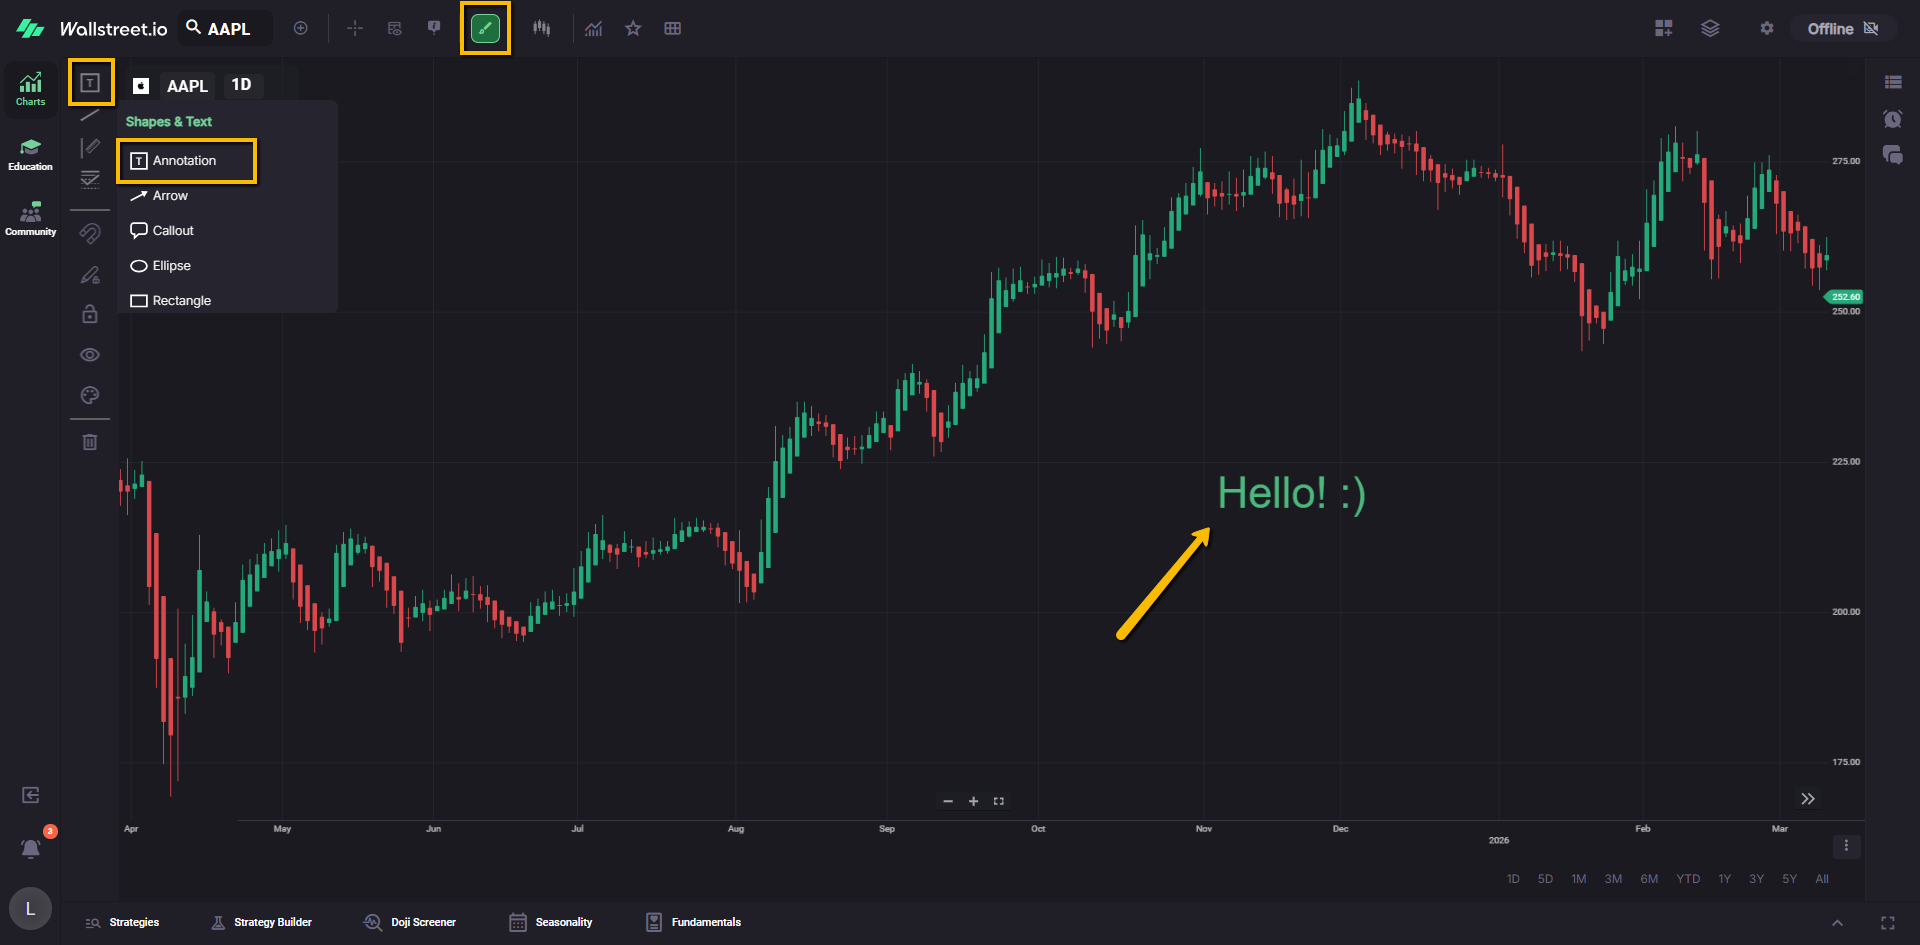
Annotation
The Annotation tool enables users to add text-based comments or notes directly on the chart. It is useful for recording observations, adding explanations, or highlighting specific events or patterns.
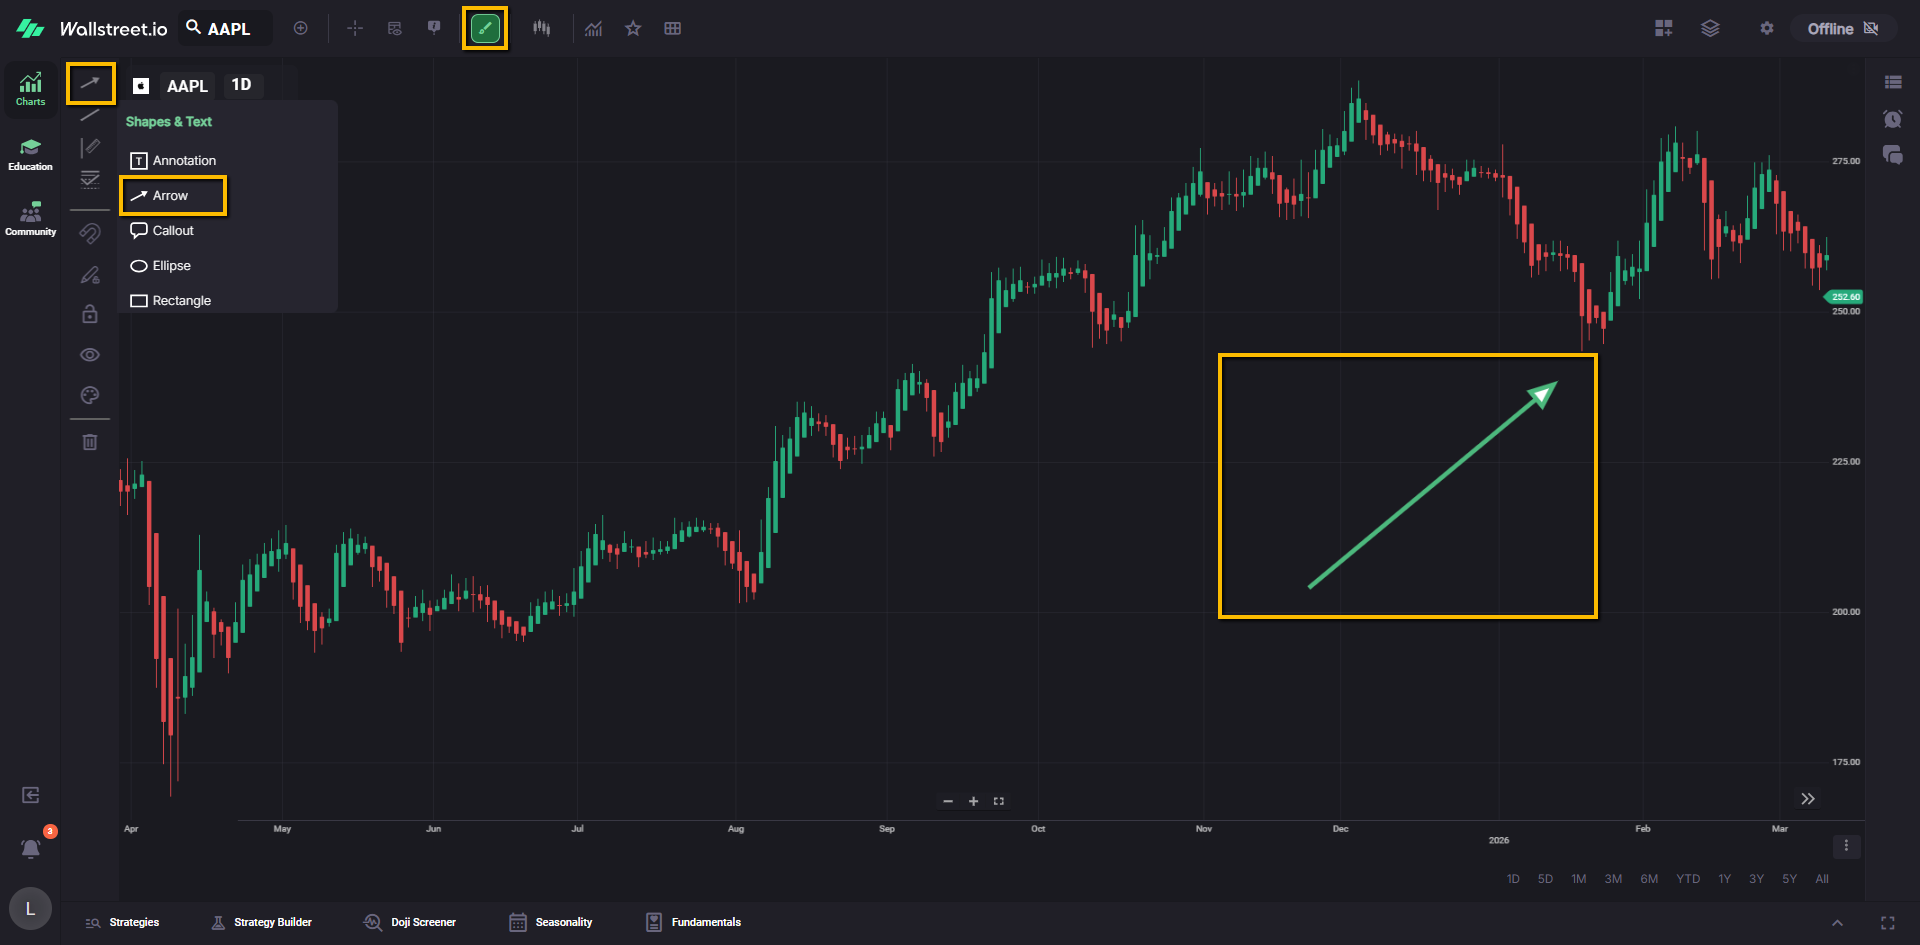
Arrow
The Arrow marking is a symbol in the shape of an arrow, commonly used to indicate the direction of a trend or important price movement. You can use arrows to visually depict potential entry or exit points, trend changes, or significant market events.
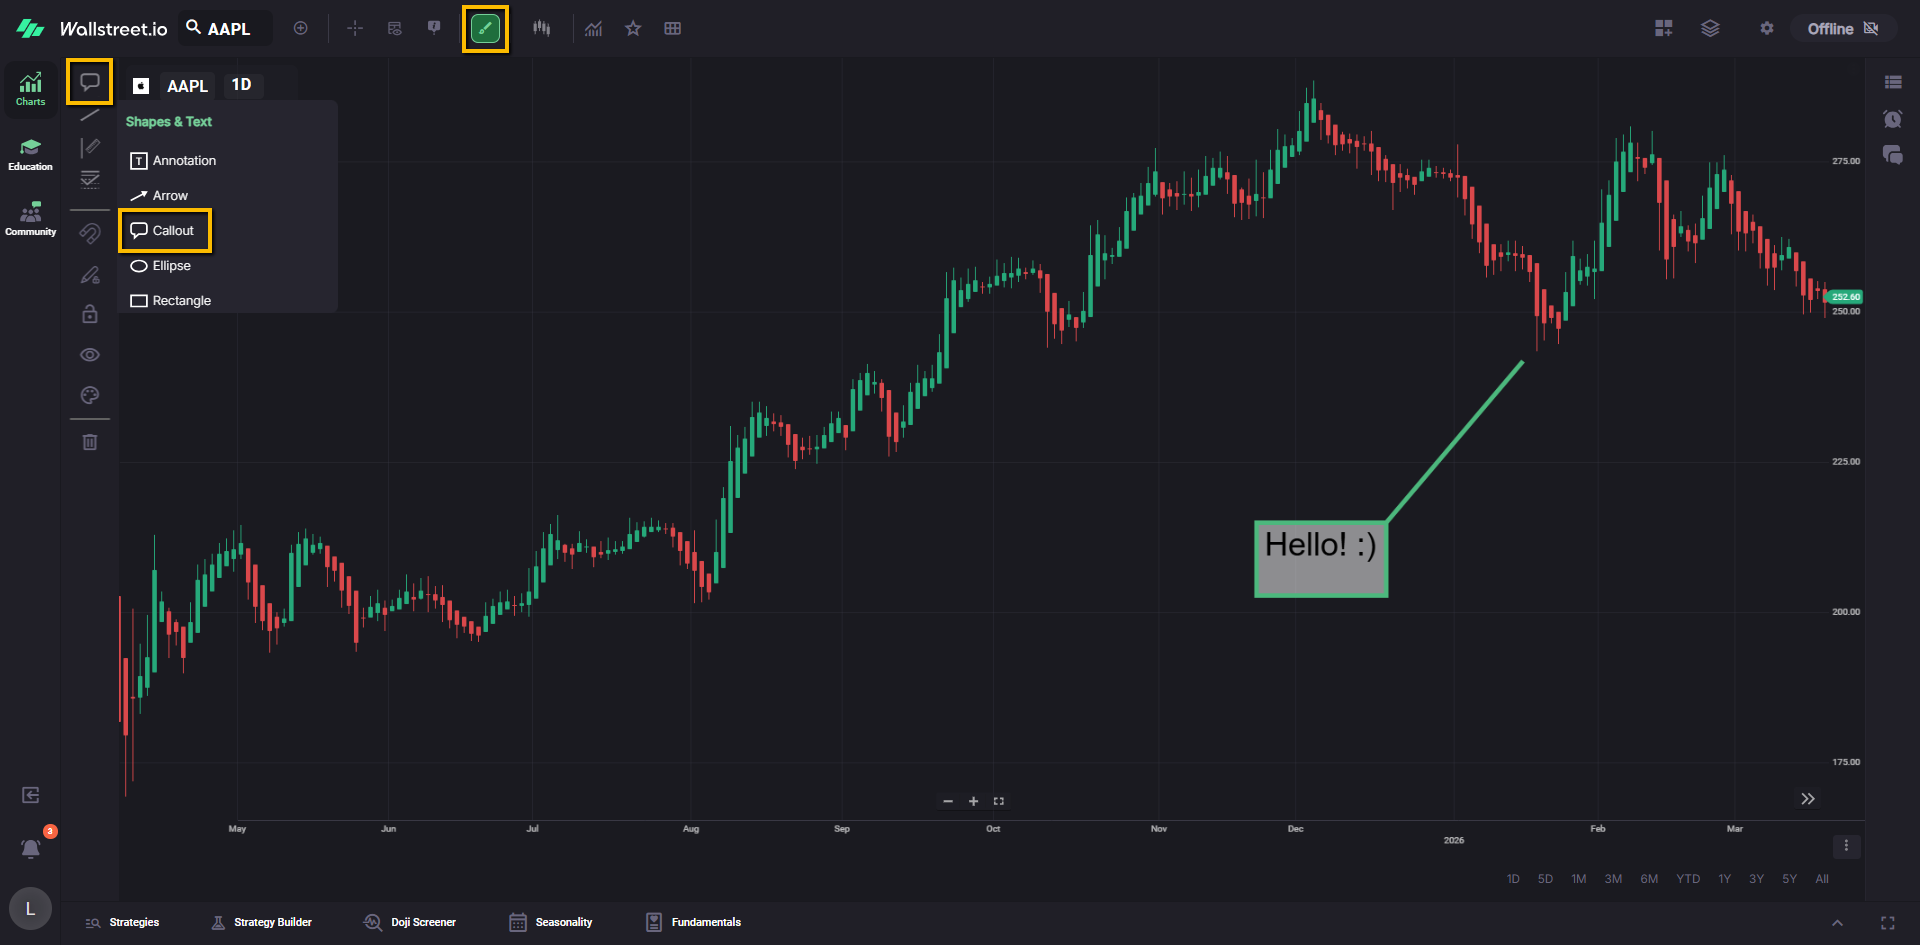
Callout
The Callout allows you to create text-based callout boxes that point to a specific area or element on the chart. It is effective for drawing attention to particular data points, price levels, or important information within the chart.
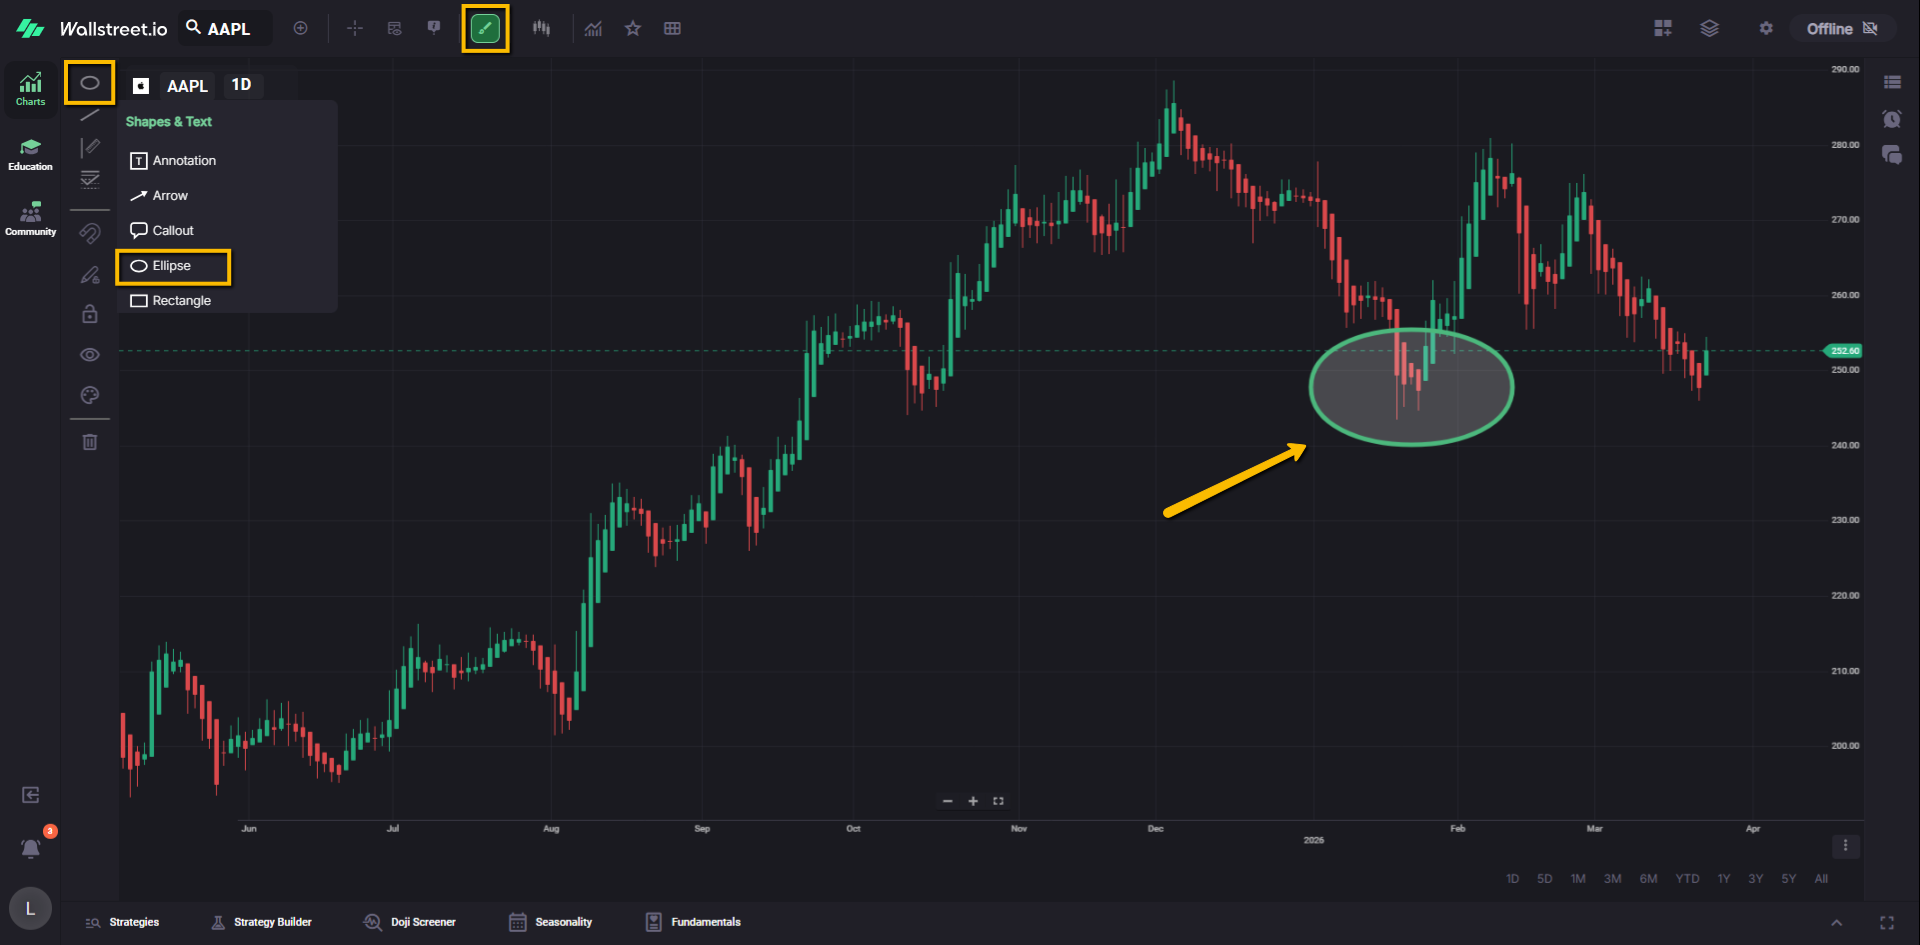
Ellipse
The Ellipse marking is a shape in the form of an ellipse or oval, used to highlight specific areas or patterns on the chart. It’s often used to enclose regions of interest, potential support or resistance zones, or consolidation patterns.
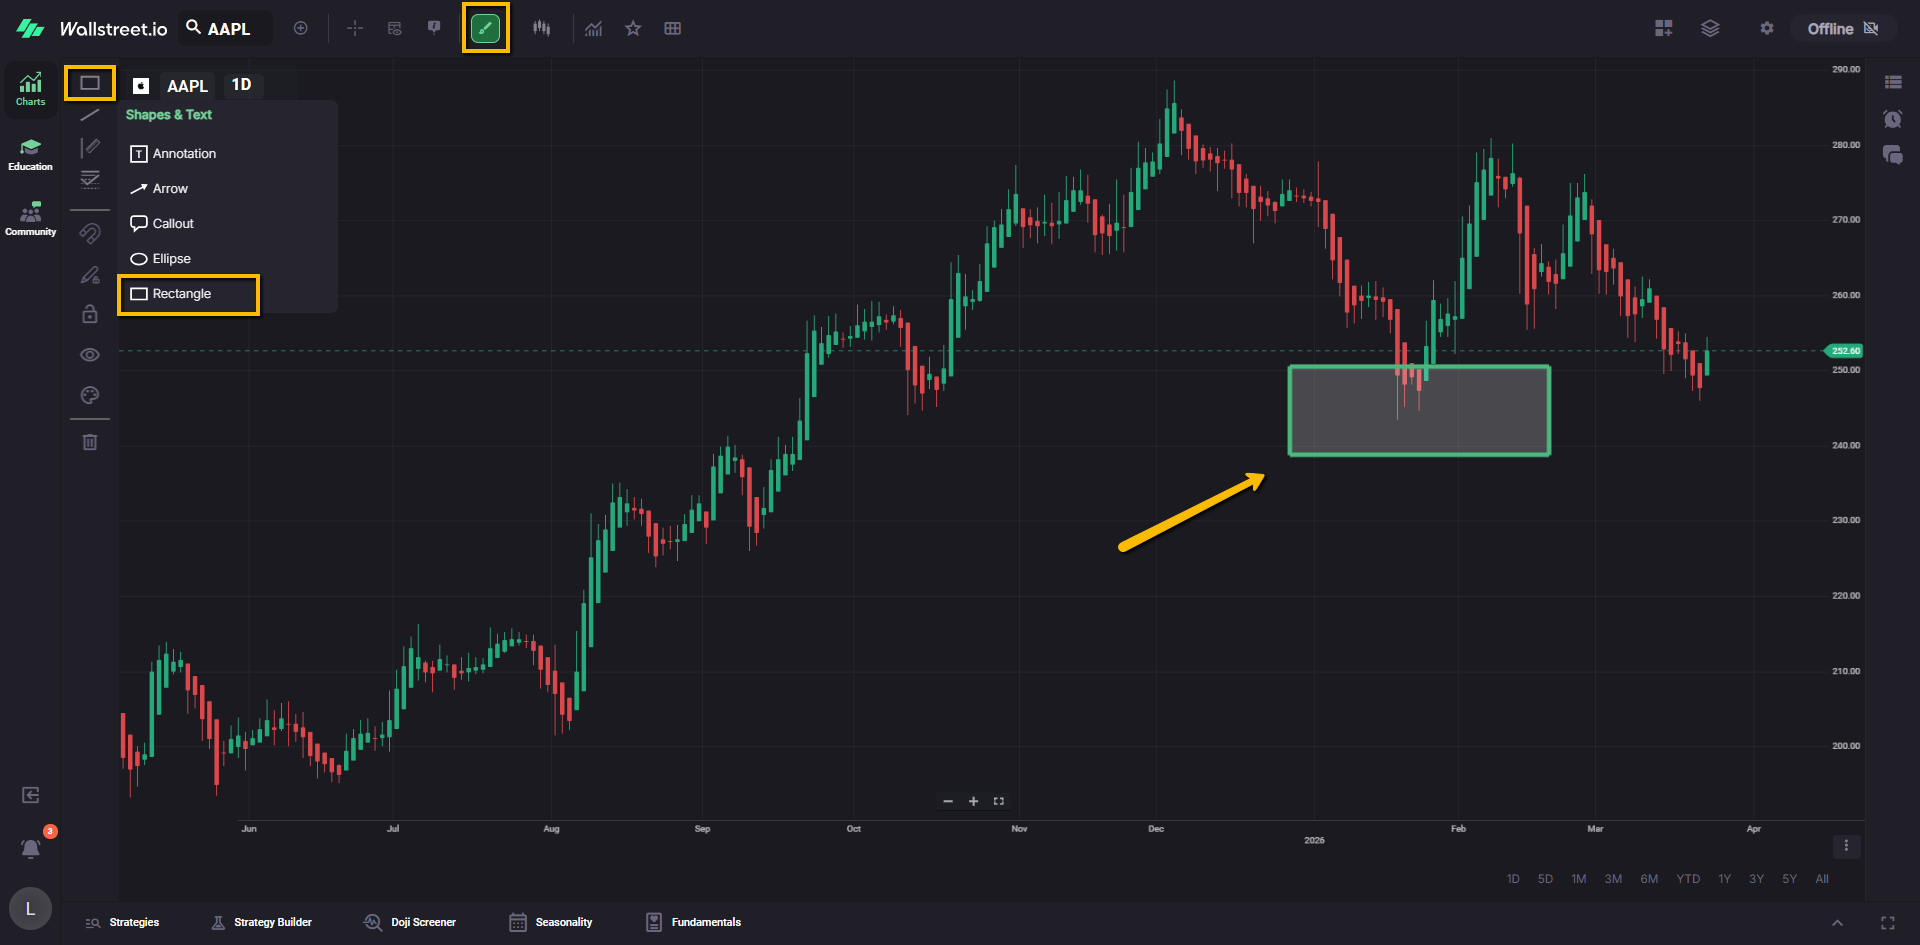
Rectangle
The Rectangle marking is a shape in the form of a rectangle or square, used to enclose and emphasize specific areas or patterns on the chart. You can use rectangles to highlight support or resistance zones, chart patterns, or consolidation areas.
Lines
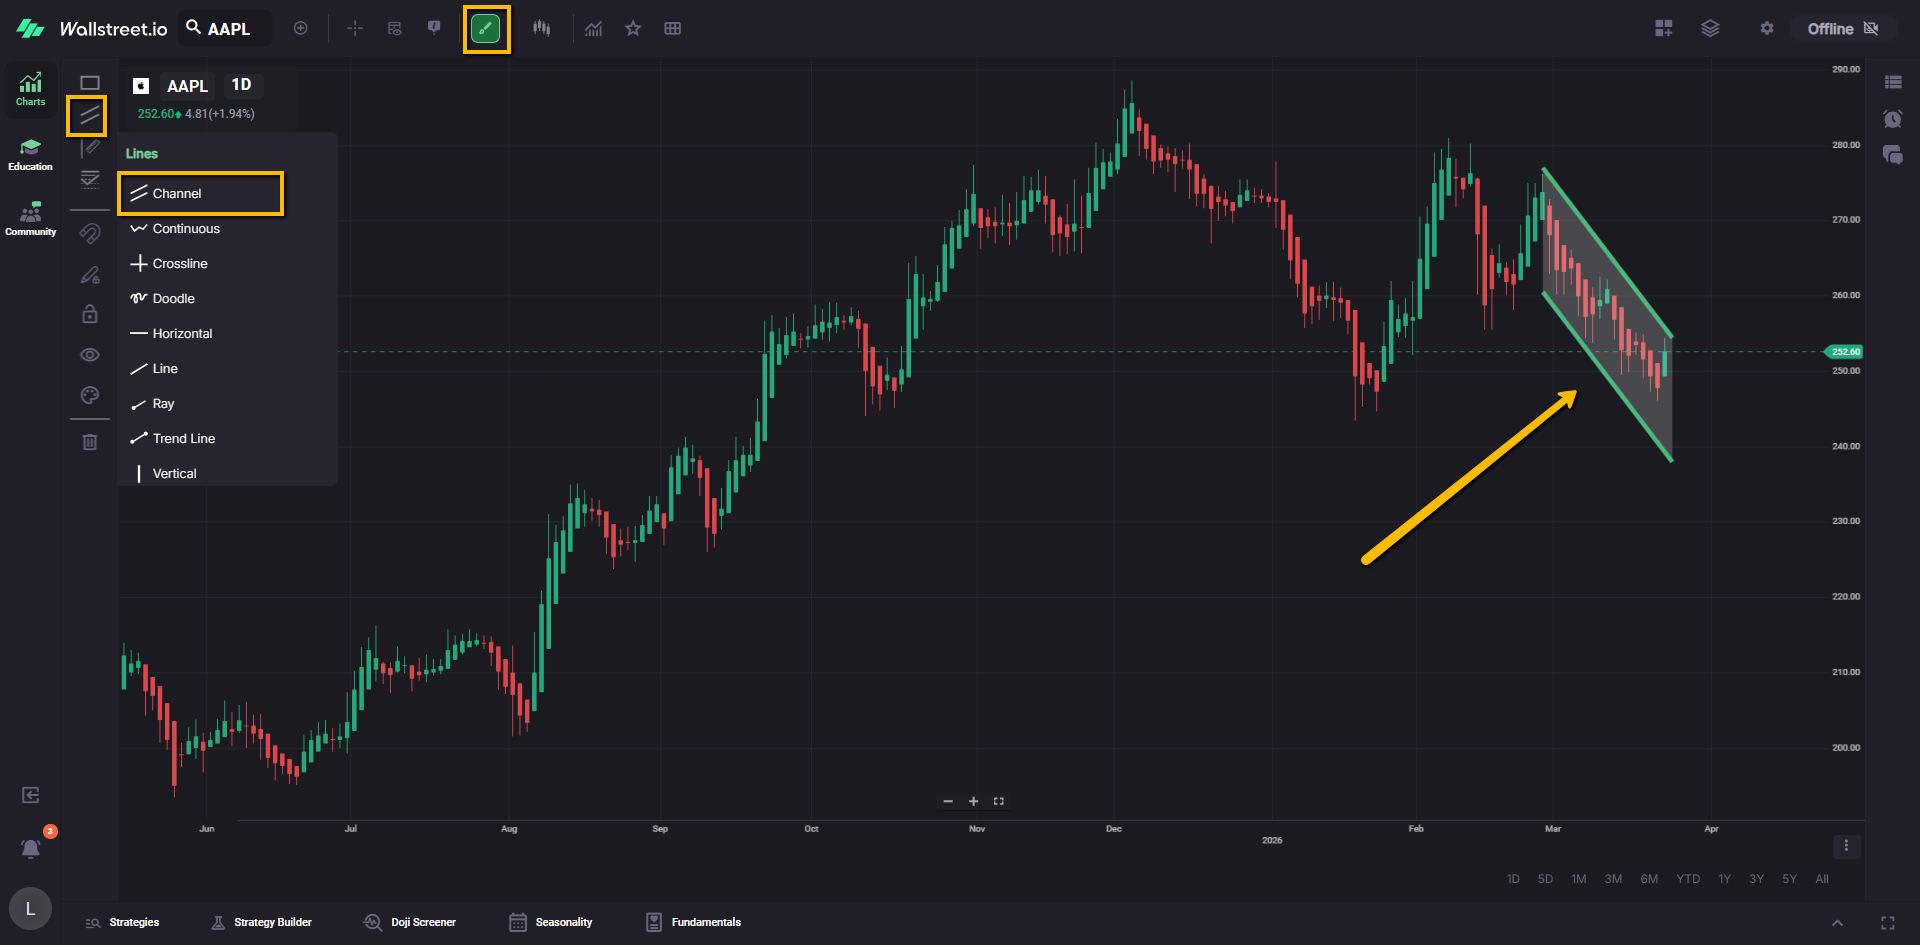
Channel
The Channel tool creates parallel lines that encompass a price range, helping to identify potential support and resistance levels within a trend. You can use channels to visualize price movements and potential trading opportunities within the defined range.
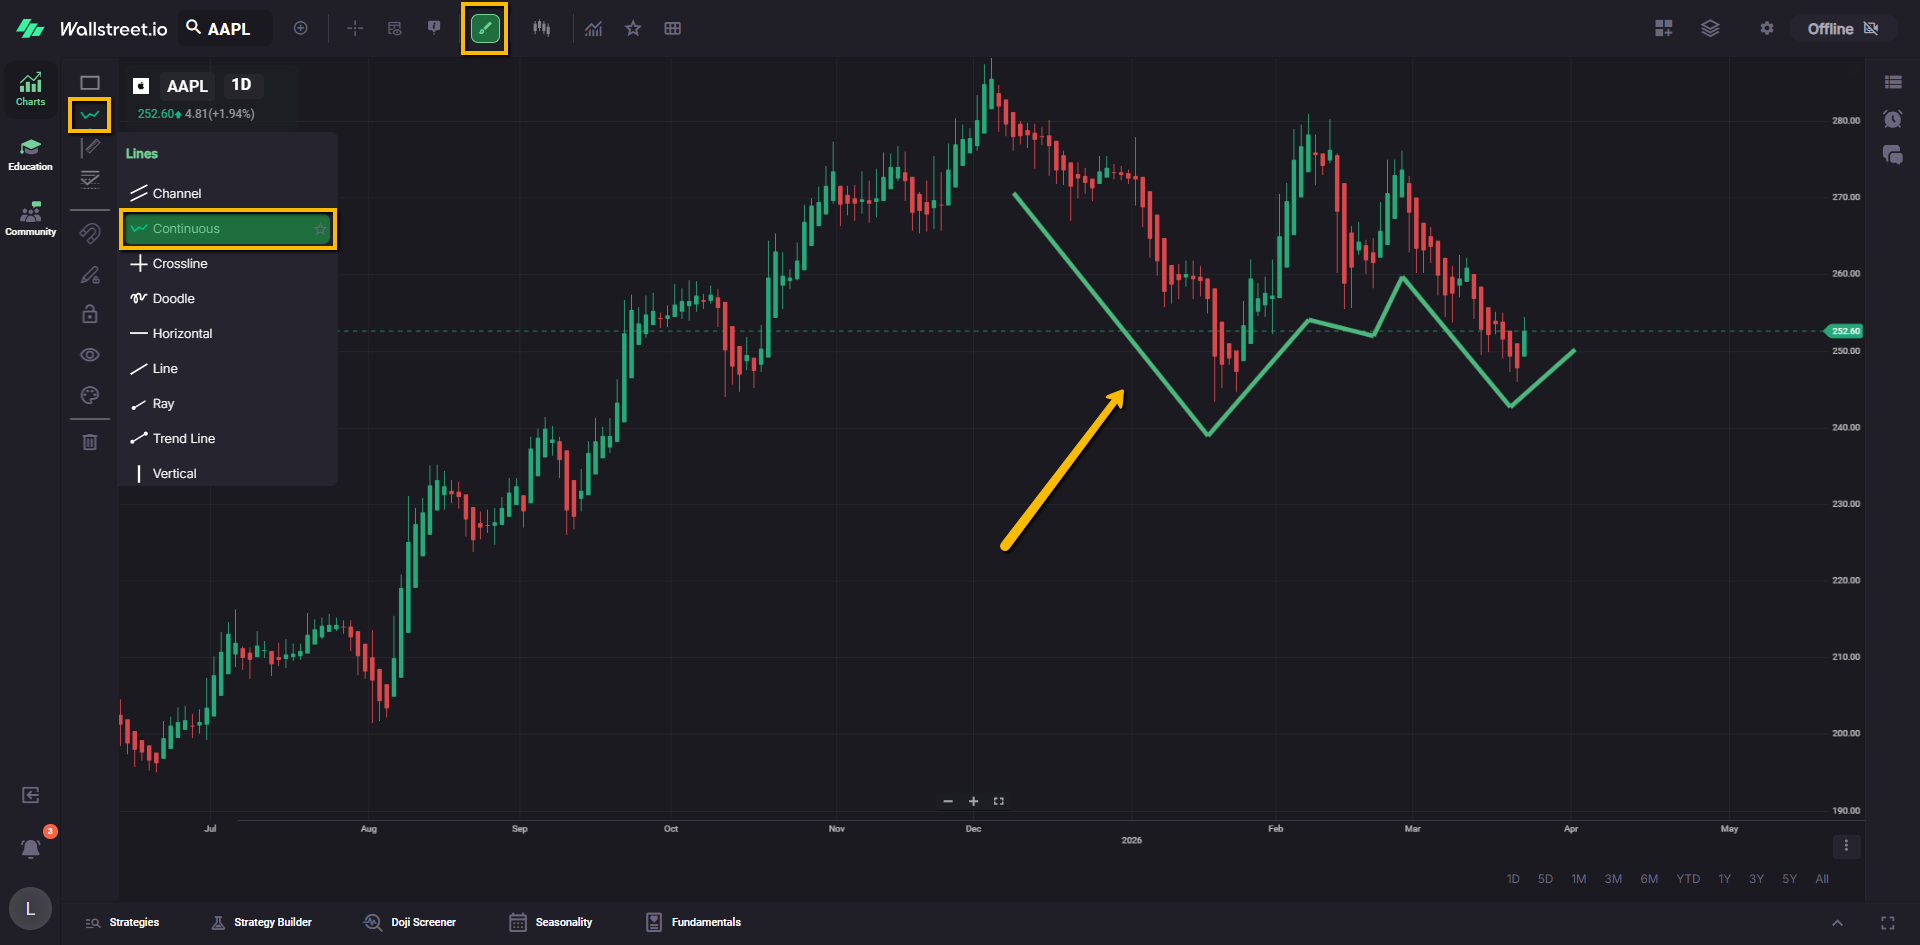
Continuous
The Continuous line tool allows you to draw free-form lines on the chart without any restrictions. It provides flexibility for creating custom lines or annotations to highlight specific areas or patterns on the chart.
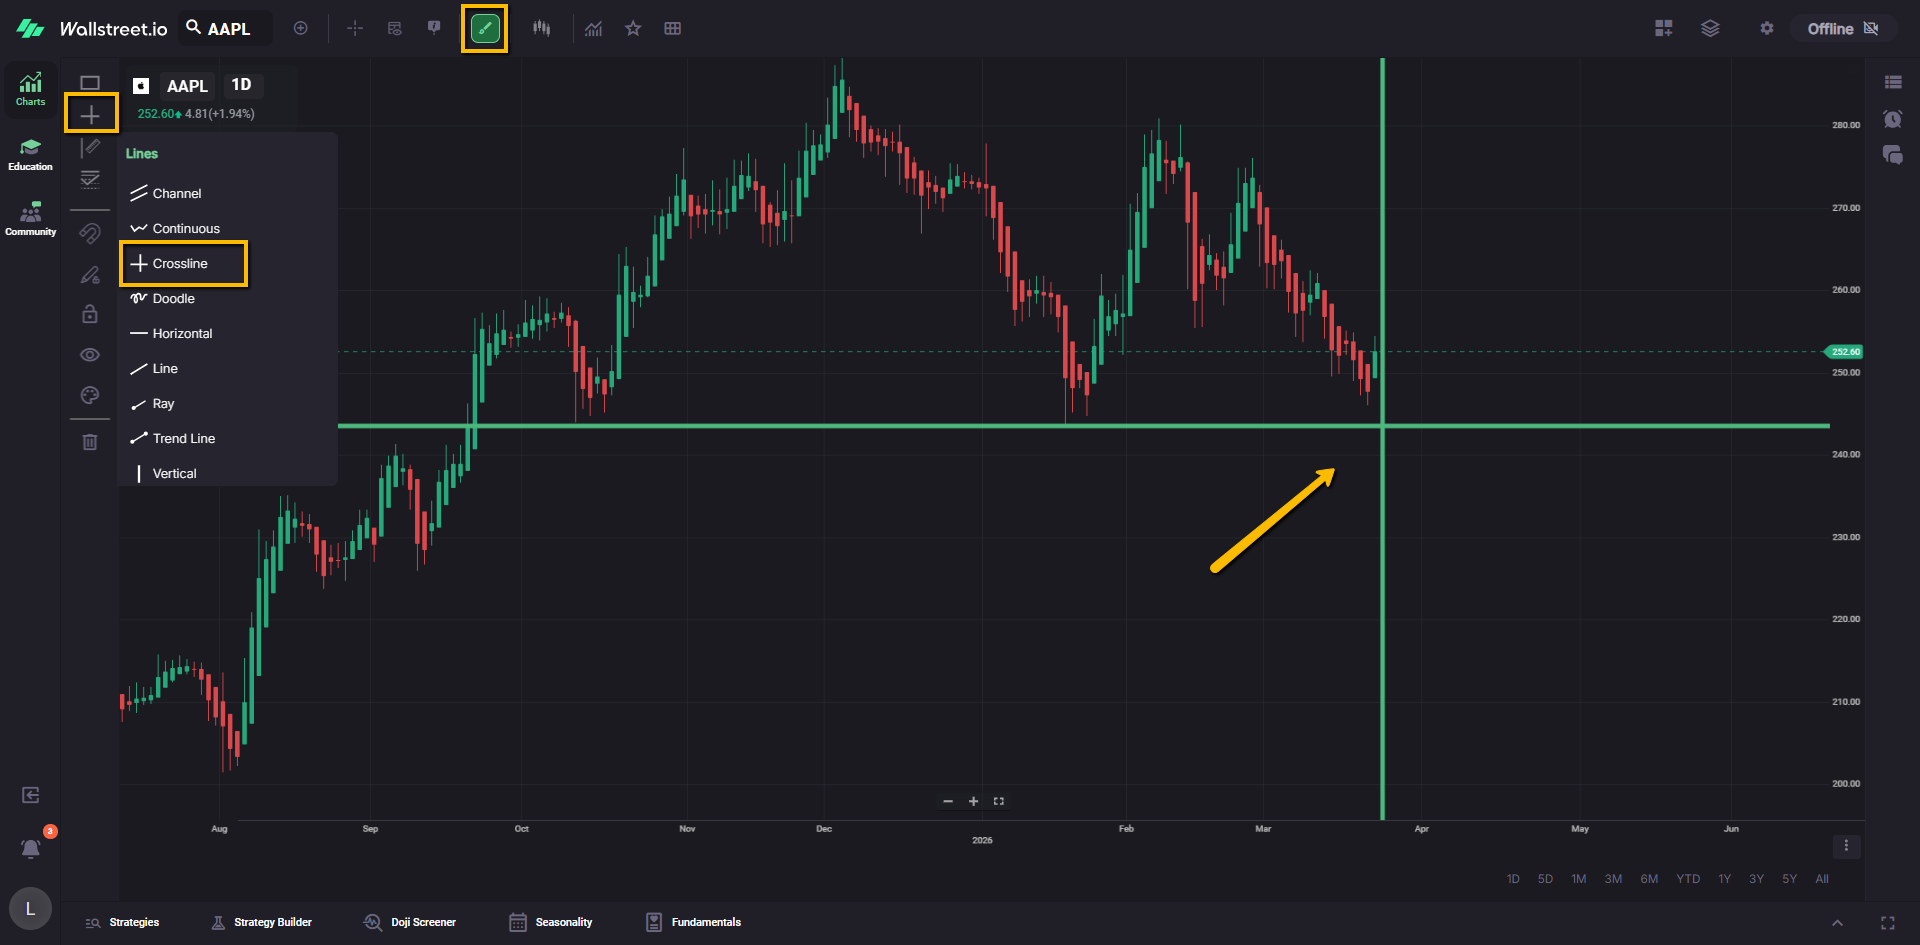
Crossline
The Crossline tool enables you to draw a horizontal and vertical line that intersect at a specific point on the chart. It helps identify precise price levels and facilitates comparative analysis between different time periods or data points.
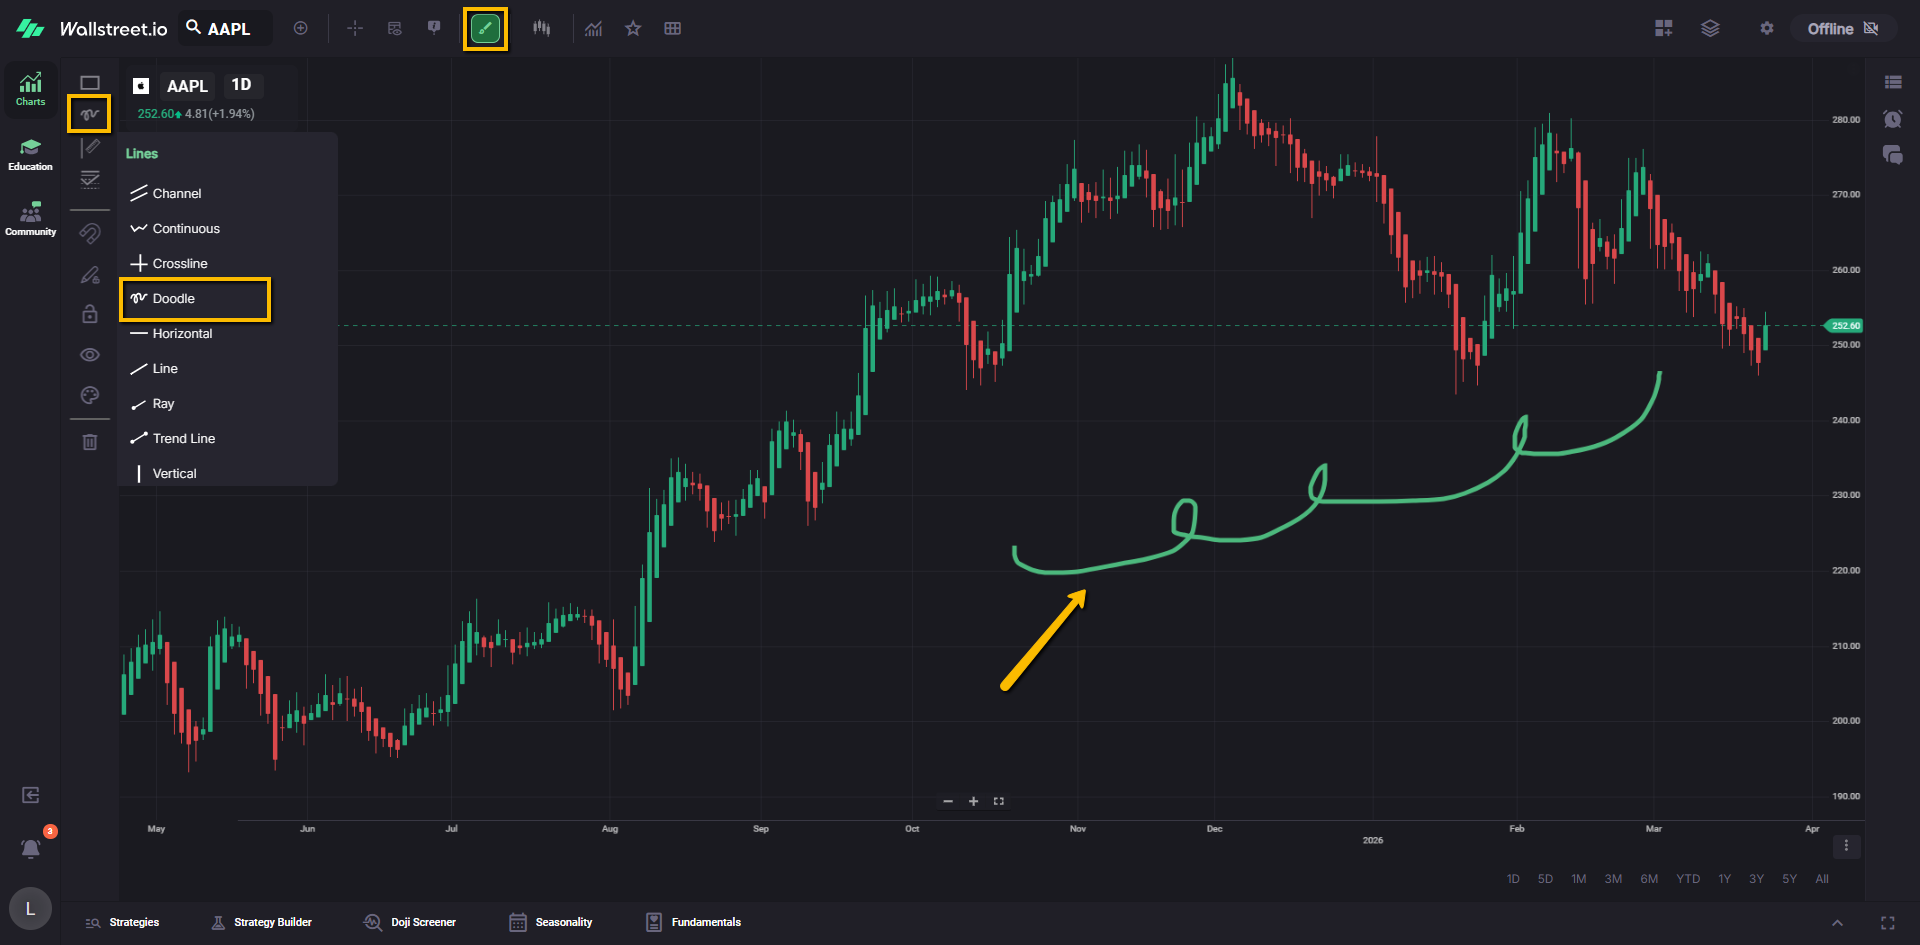
Doodle
The Doodle tool allows you to draw free-form lines, shapes, or annotations on the chart. It provides a creative way to add personalized markings, notes, or drawings to emphasize specific elements or observations.
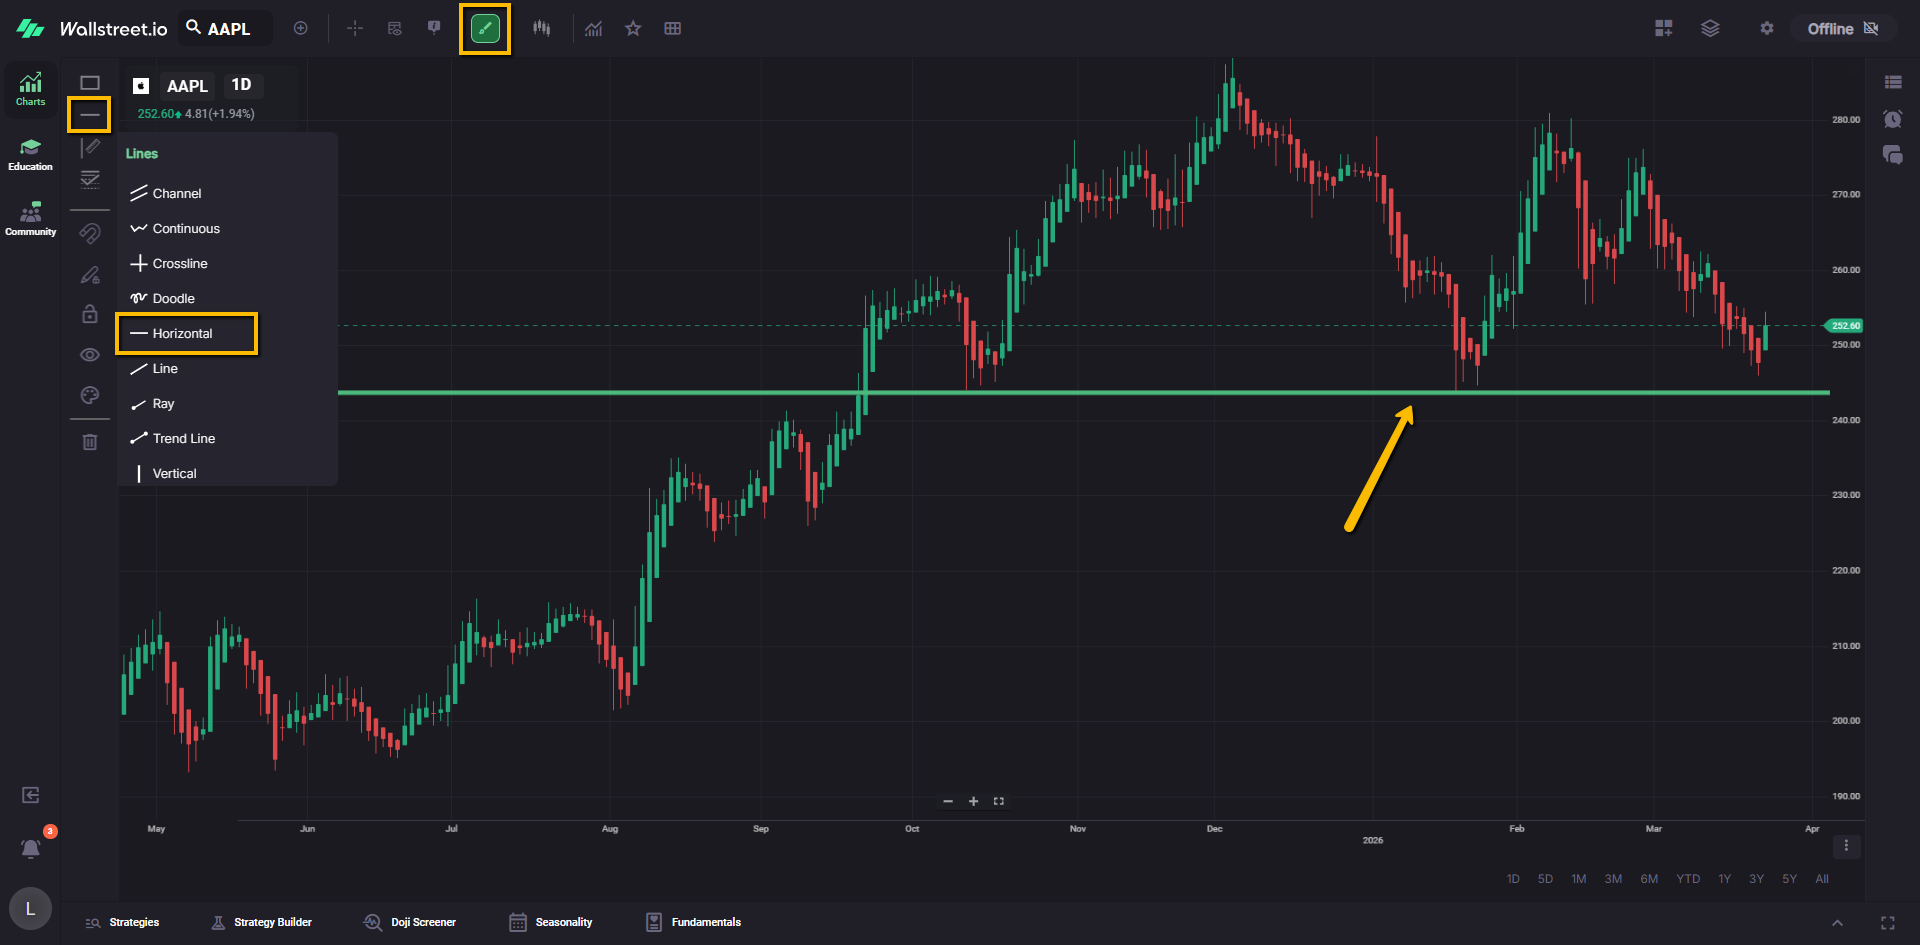
Horizontal
The Horizontal line tool enables you to draw a straight line horizontally across the chart. It is commonly used to mark specific price levels, support, or resistance zones.
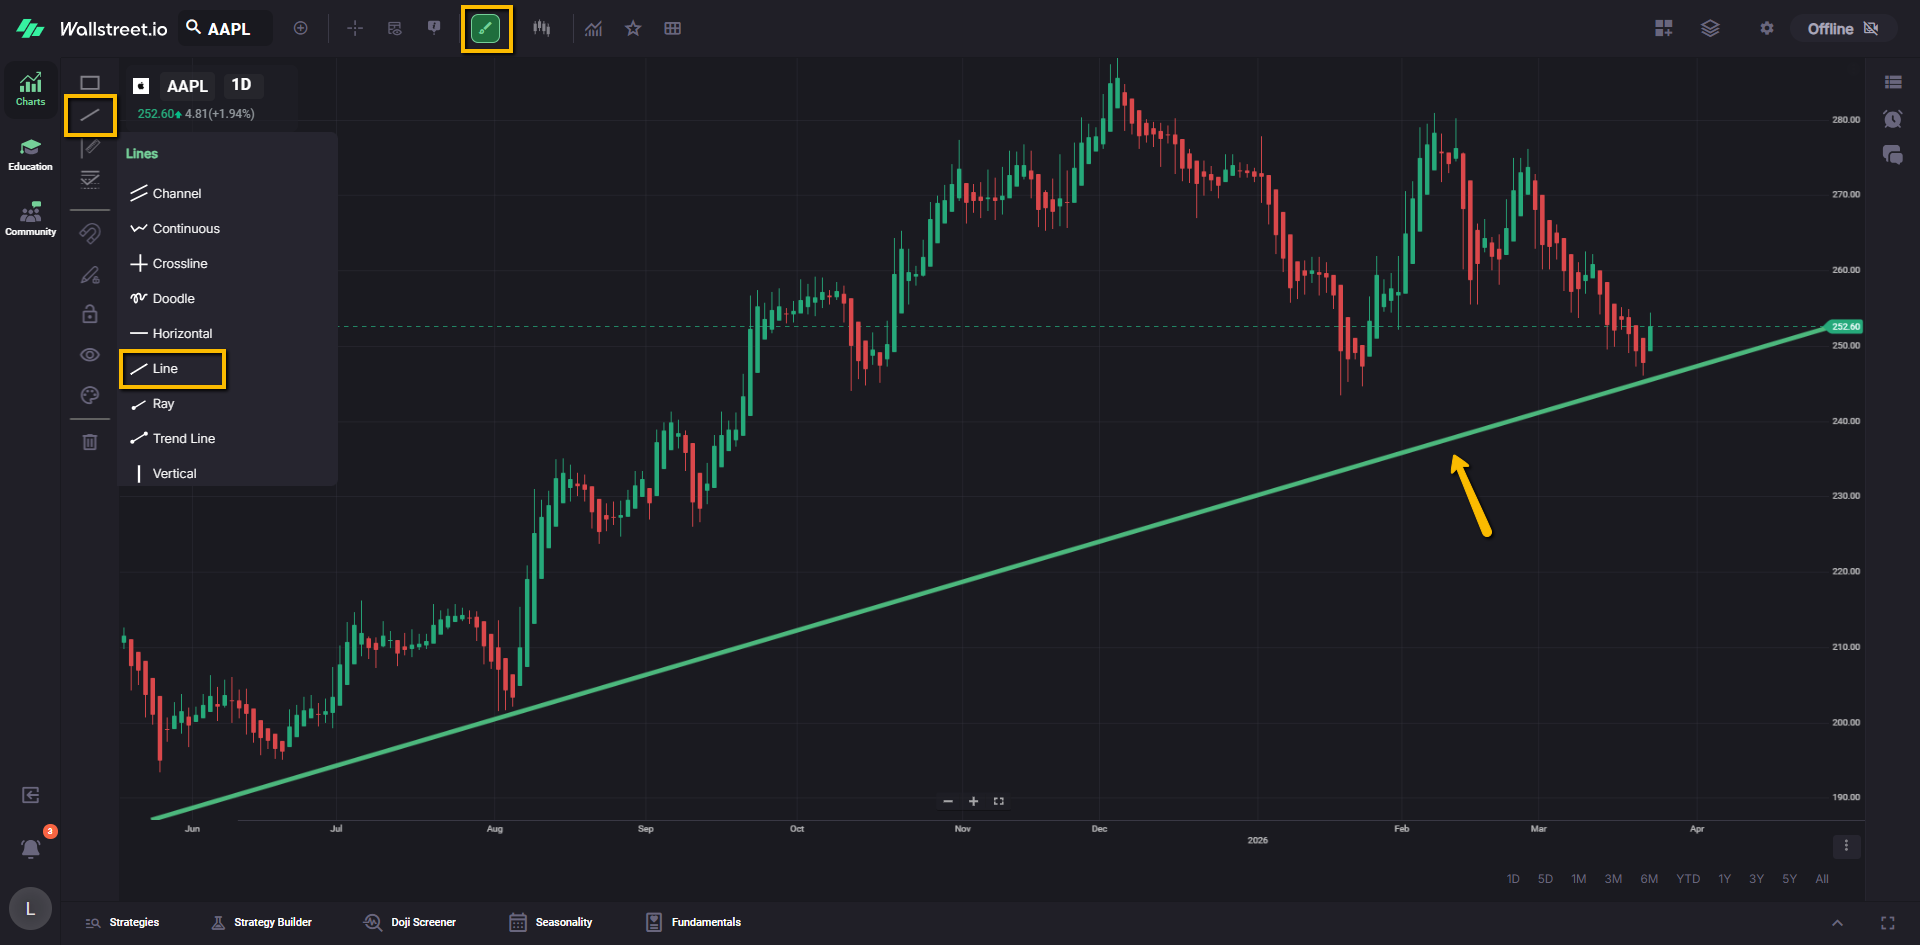
Line
The Line tool allows you to draw a straight line at any desired angle or position on the chart. It is versatile and can be used to represent trendlines, support or resistance levels, or other relevant lines of interest.
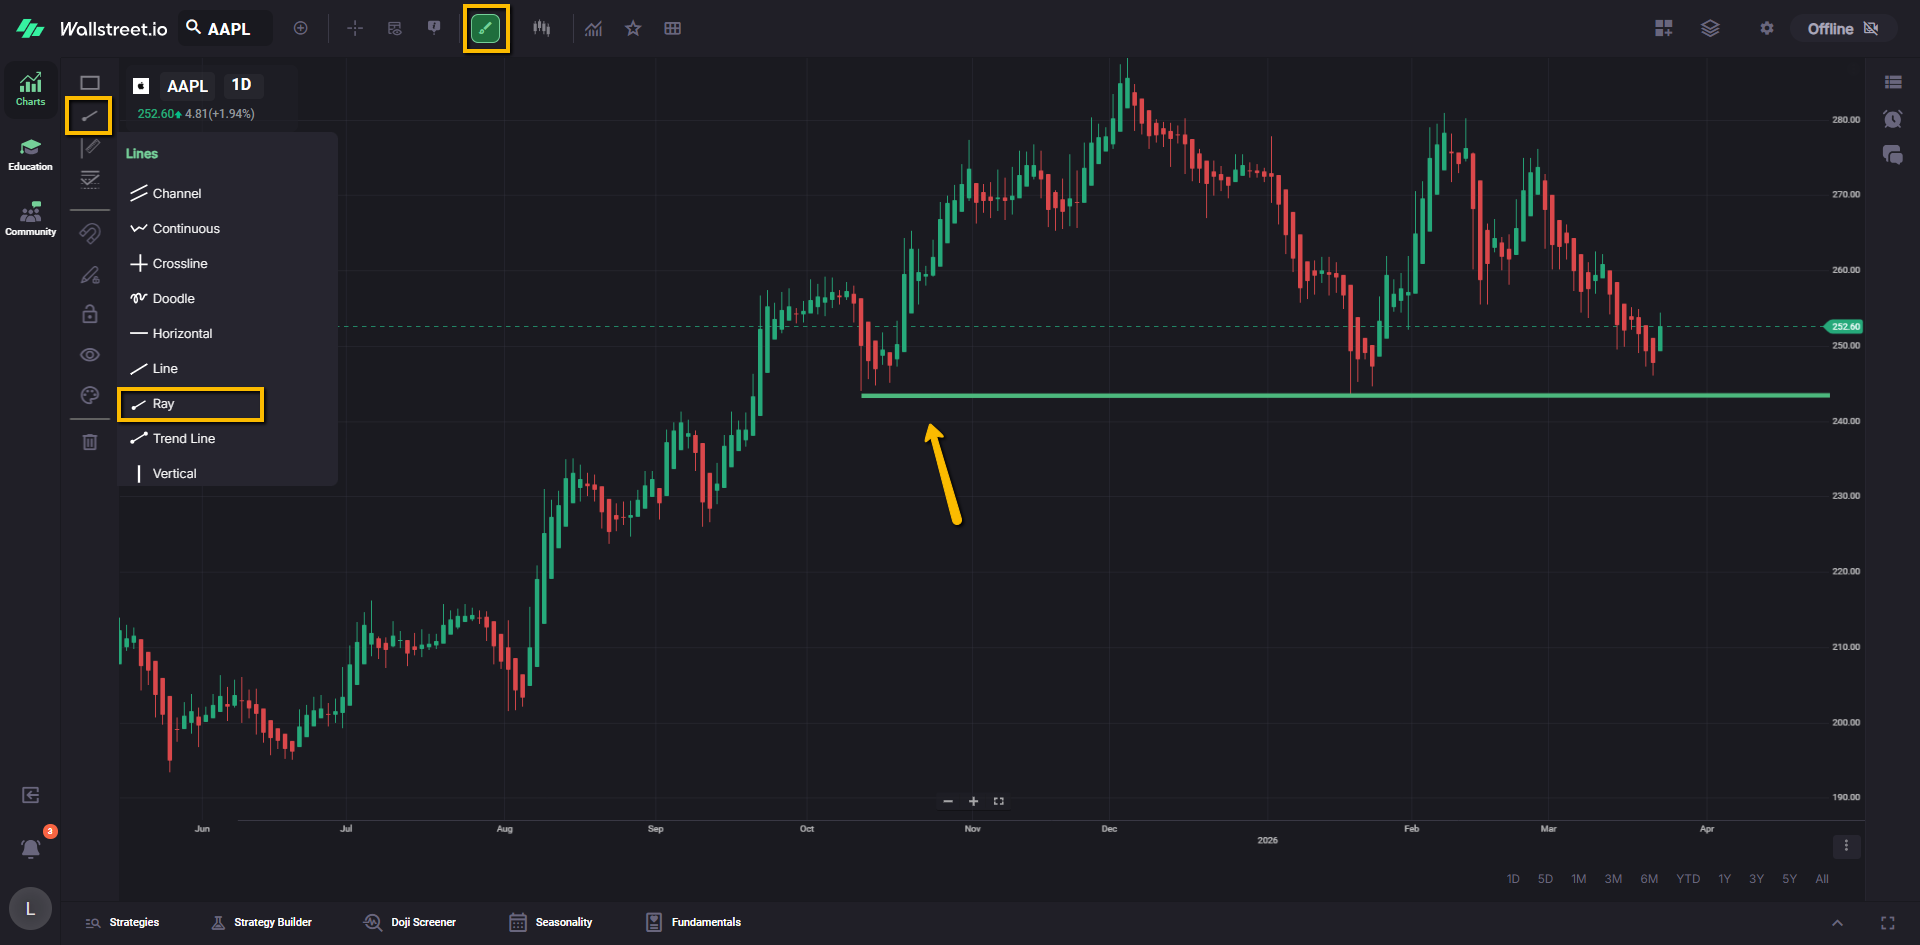
Ray
The Ray tool allows you to draw a straight line that extends infinitely in one direction from a specific starting point. It helps identify potential price targets or levels of interest based on the line's angle and position.
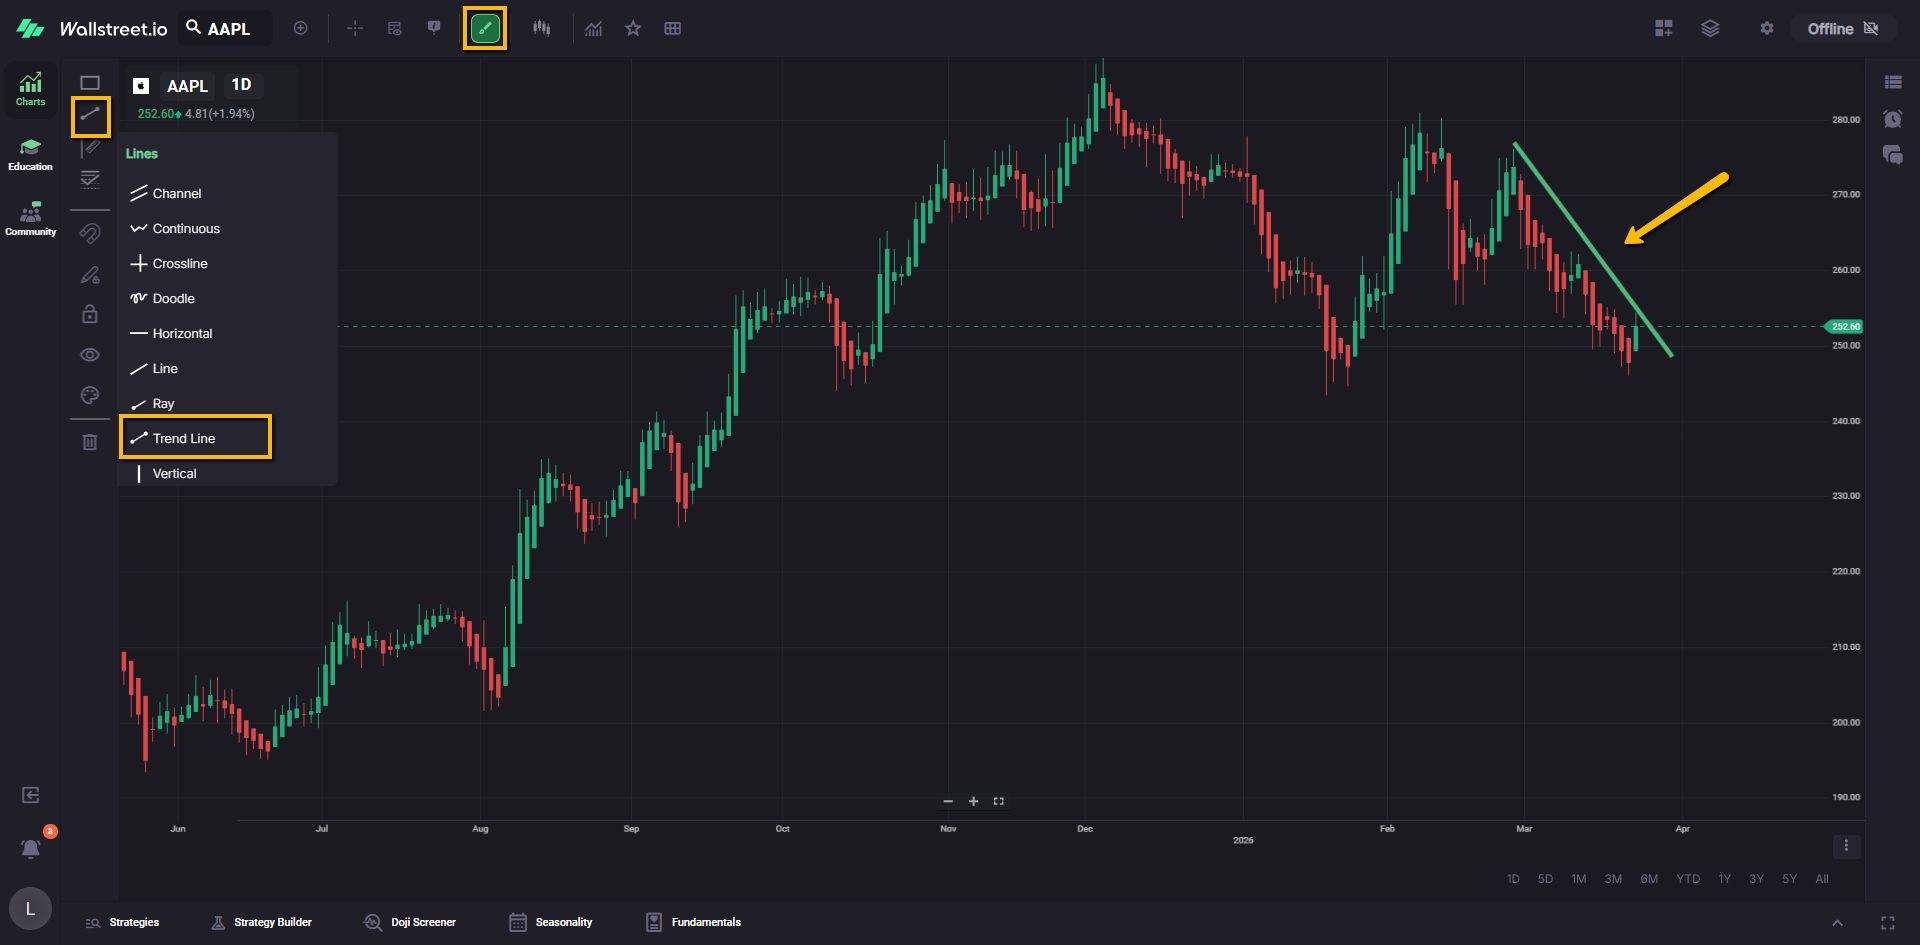
Trend Line
The Trendline tool enables you to draw a line that visually represents the trend direction and potential support or resistance levels. It is commonly used to identify and confirm trend patterns.
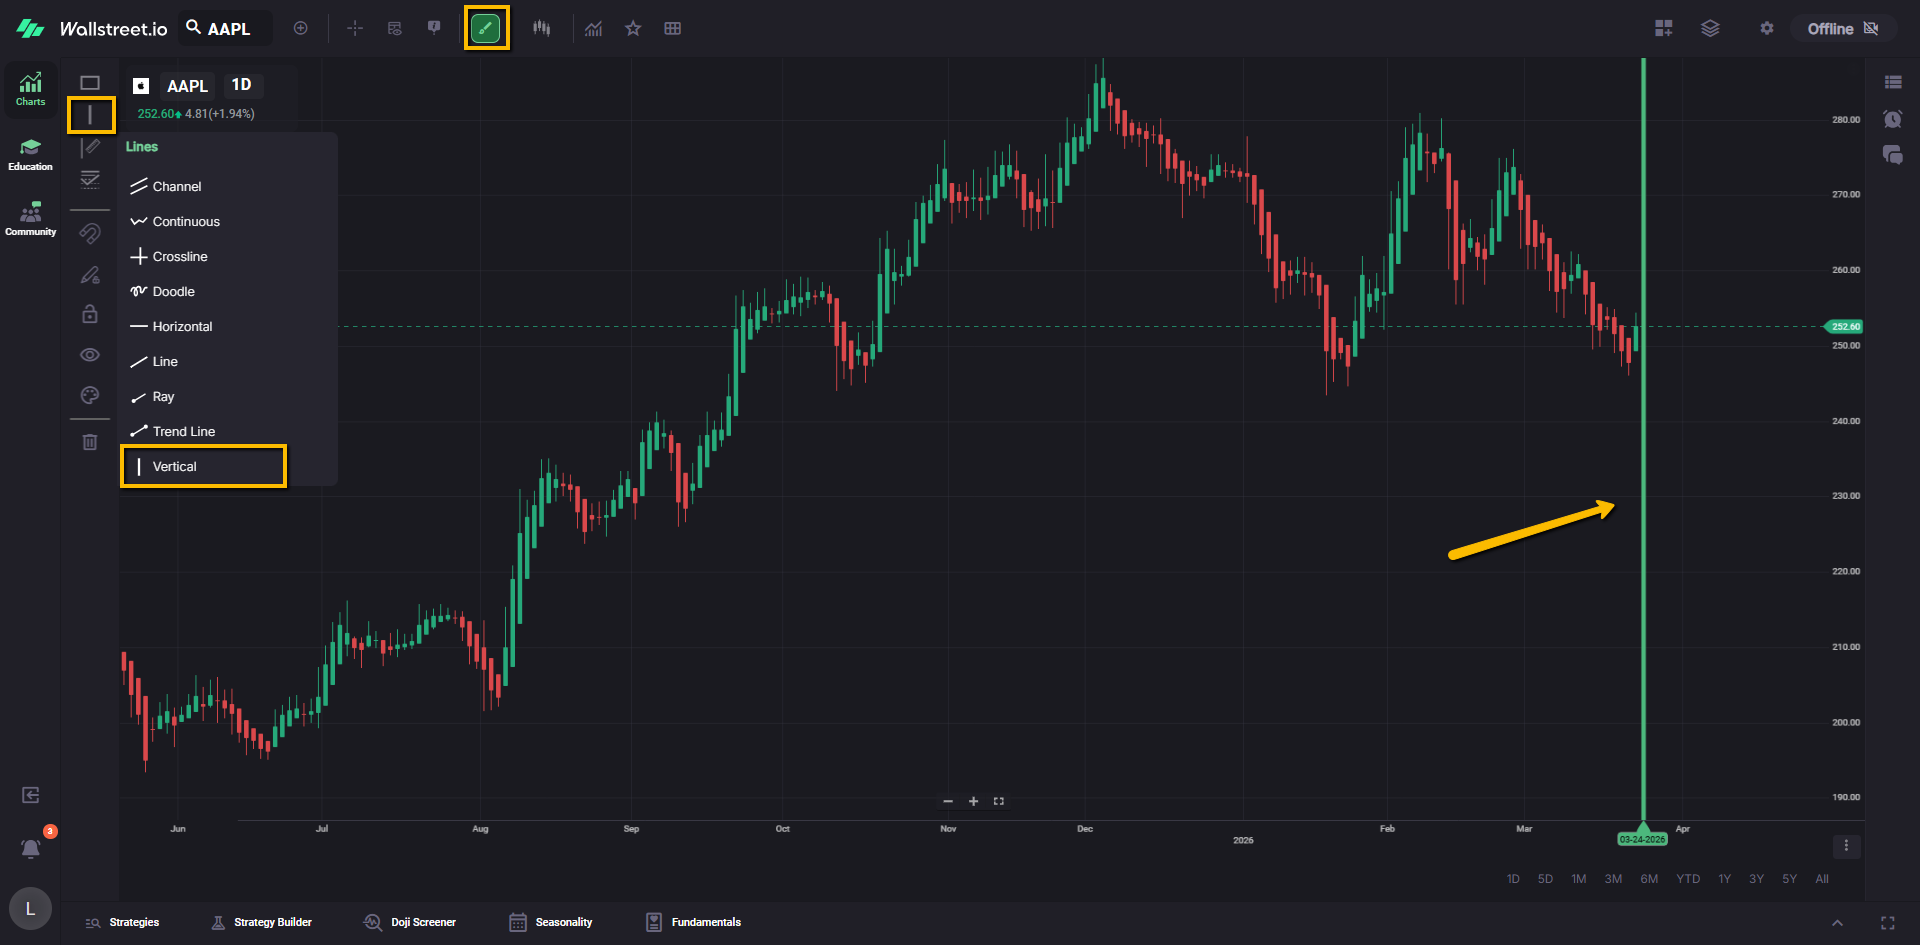
Vertical
The Vertical line tool allows you to draw a straight line vertically on the chart. It is useful for marking specific time periods or events, such as important news releases or market open/close times.
Technical/Stats
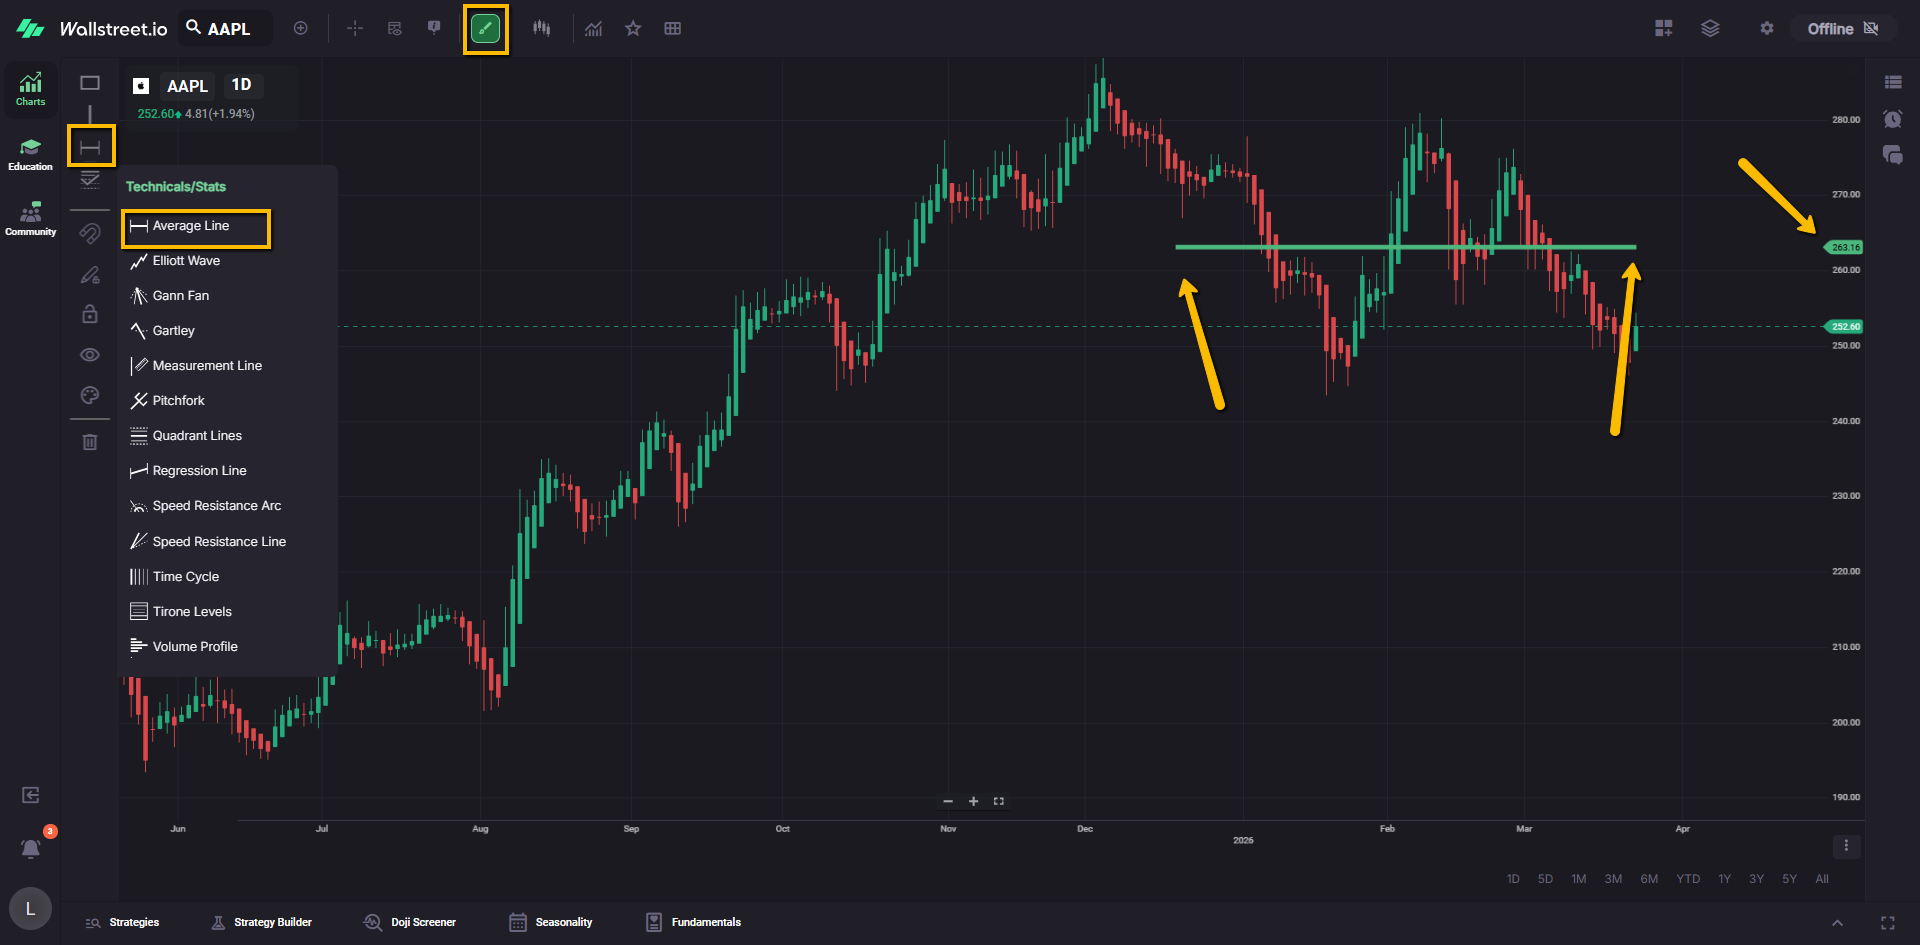
Average Line
The Average Line is a tool that calculates and plots the average value of a selected data series on the chart. It helps smooth out price fluctuations and provides a visual reference for identifying the overall trend direction.
Elliott Wave
The Elliott Wave is a technical analysis concept that identifies recurring price patterns and wave structures to forecast future price movements. It is based on the idea that markets move in predictable waves consisting of impulse waves (with the trend) and corrective waves (against the trend).
Gann Fan
The Gann Fan is a tool based on the principles of W.D. Gann, a famous trader and analyst. It consists of diagonal trendlines drawn at specific angles to identify potential support and resistance levels. The Gann Fan is used to analyze price and time relationships and helps you determine future price targets and trend direction.
Gartley
The Gartley pattern is a specific harmonic price pattern that incorporates Fibonacci retracement and extension levels. It helps you identify potential turning points and reversals in the market based on specific price ratios and geometric patterns.
Measurement line
The Measurement Line allows users to measure the distance or change in price between two points on the chart. It helps quantify price movements, assess market volatility, or determine the duration of specific price patterns or trends.
Pitchfork
The Pitchfork, also known as Andrews' Pitchfork, is a tool that uses three parallel trendlines to identify potential support and resistance levels. It is primarily used to analyze and project future price movements within the confines of a trending market.
Quadrant Lines
Quadrant Lines divide the chart into four quadrants based on specific reference points or price levels. They provide a visual framework for assessing price movements, trend changes, or identifying potential support and resistance areas within each quadrant.
Regression Line
The Regression Line is a statistical tool that plots a straight line through a series of data points to estimate the overall trend. It helps identify the general direction of price movement and serves as a visual guide for understanding trend strength and potential reversals.
Speed resistance arc
The Speed Resistance Arc is a curved line that represents a time and price resistance zone. It helps you identify potential levels where price acceleration may slow down or encounter resistance.
Speed resistance Line
The Speed Resistance Line is a straight line that connects two significant price points and helps you identify potential levels of support or resistance. It assists in analyzing price movements and determining trend strength and potential reversals.
Time cycle
Time Cycle analysis involves identifying recurring patterns and cycles in the market based on historical price data. It helps you anticipate potential turning points or periods of increased volatility based on past timing patterns.
Tirone levels
Tirone Levels are horizontal lines drawn on the chart at specific percentage intervals above and below a selected reference point. They help identify potential support and resistance levels based on the price's historical percentage movements.
Volume Profile
The Volume Profile is a statistical tool that displays the volume traded at each price level over a specified period. It helps identify areas of high trading activity (volume nodes) and potential support or resistance levels based on the volume distribution.
Fibonacci
Fib Arc
The Fibonacci Arc tool creates curved lines based on Fibonacci ratios, which can indicate potential support or resistance levels. These arcs are drawn from important price points and can help identify areas where price reversals or significant price movements may occur.
Fib Fan
The Fibonacci Fan tool draws trend lines based on Fibonacci ratios to identify potential support and resistance levels. It helps visualize the slope of price movements and can indicate areas where the price may find support or encounter resistance.
Fib Projection
The Fibonacci Projection tool assists in estimating potential future price targets or extensions of a price move. By applying Fibonacci ratios to the length of a previous price swing, you can project areas where the price may reach in the future.
Fib Retracement
The Fibonacci Retracement tool helps identify potential levels of support or resistance during a price correction within a trend. You can use this tool to measure the extent of a price retracement and anticipate possible areas where the price may reverse or find support/resistance.
Fib Time Zone
The Fibonacci Timezone tool is used to identify potential time-based price reversals or significant market movements. It divides a significant price move into time intervals based on Fibonacci ratios, indicating possible turning points or periods of increased volatility.