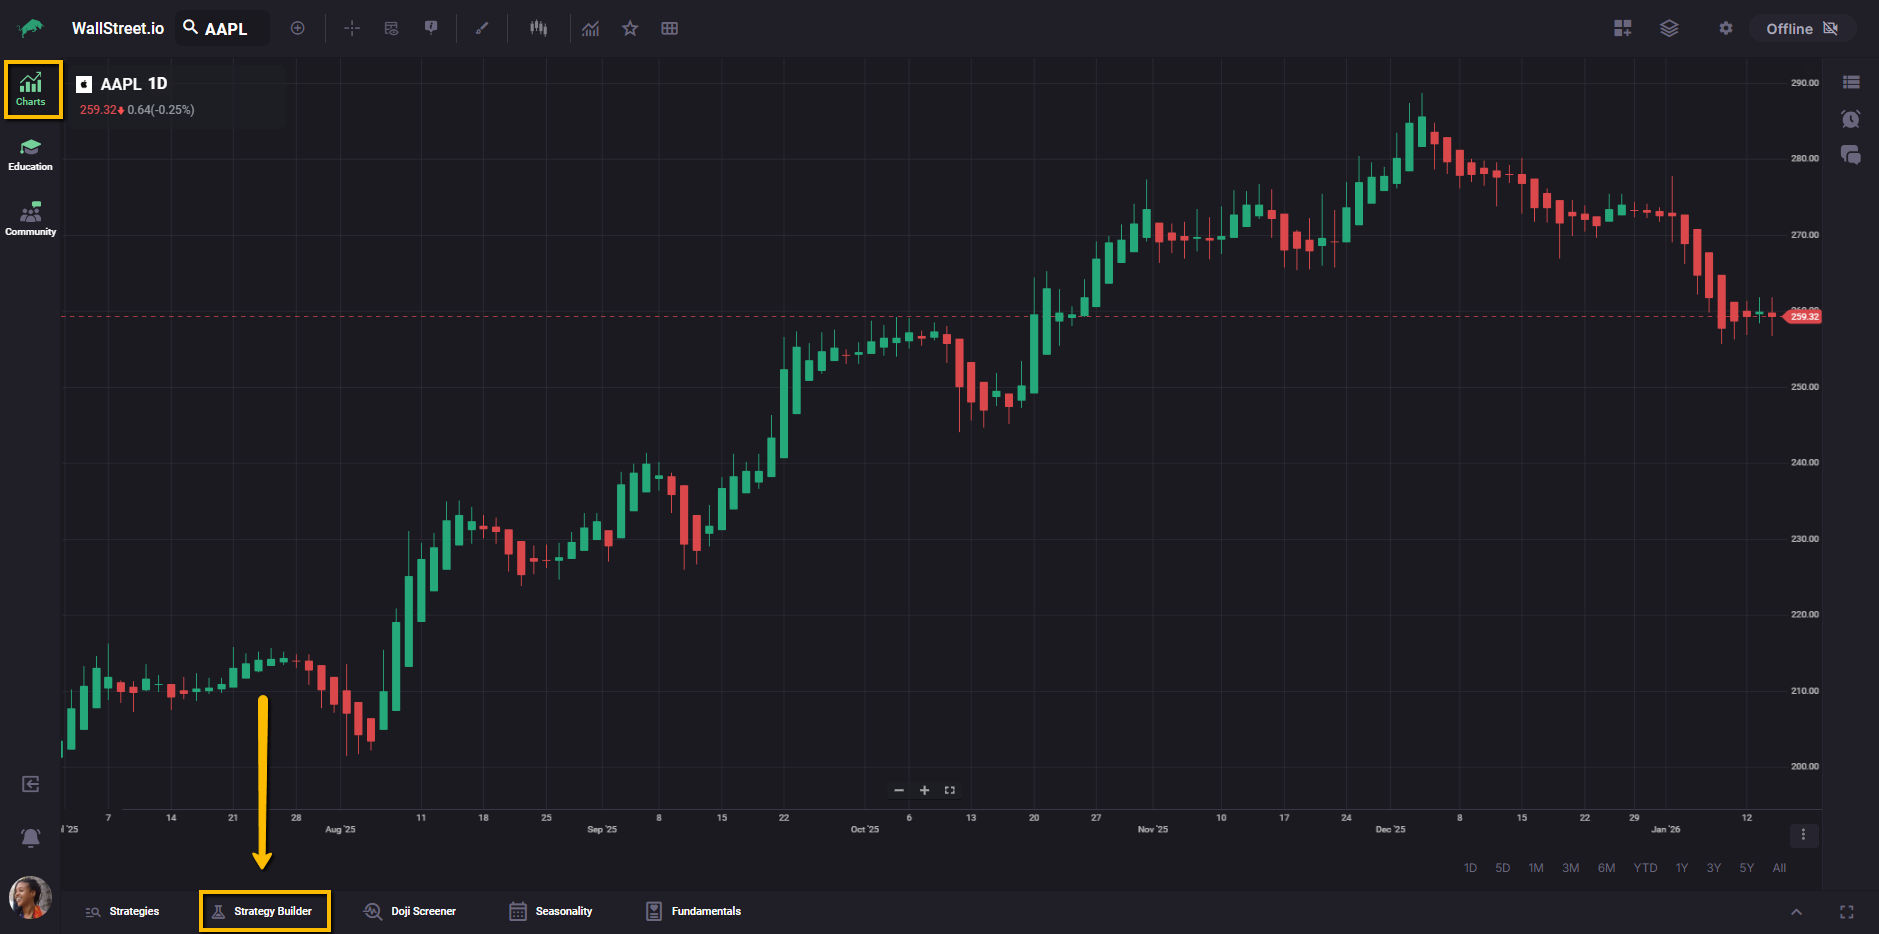
Strategy Builder Complete Guide
What this helps you do
This guide helps you understand the Strategy Builder layout, what each section controls, and how to read your results as you build. When you know what each block means, you can turn a trading idea into clear “Buy” and “Sell” rules, then quickly sanity-check the backtest before you decide whether it’s worth refining.
Strategy Builder at a glance
The Strategy Builder is where you build a rules-based strategy using Studies (indicators) and Interactions (the relationship between two values, like “is above” or “crosses below”).
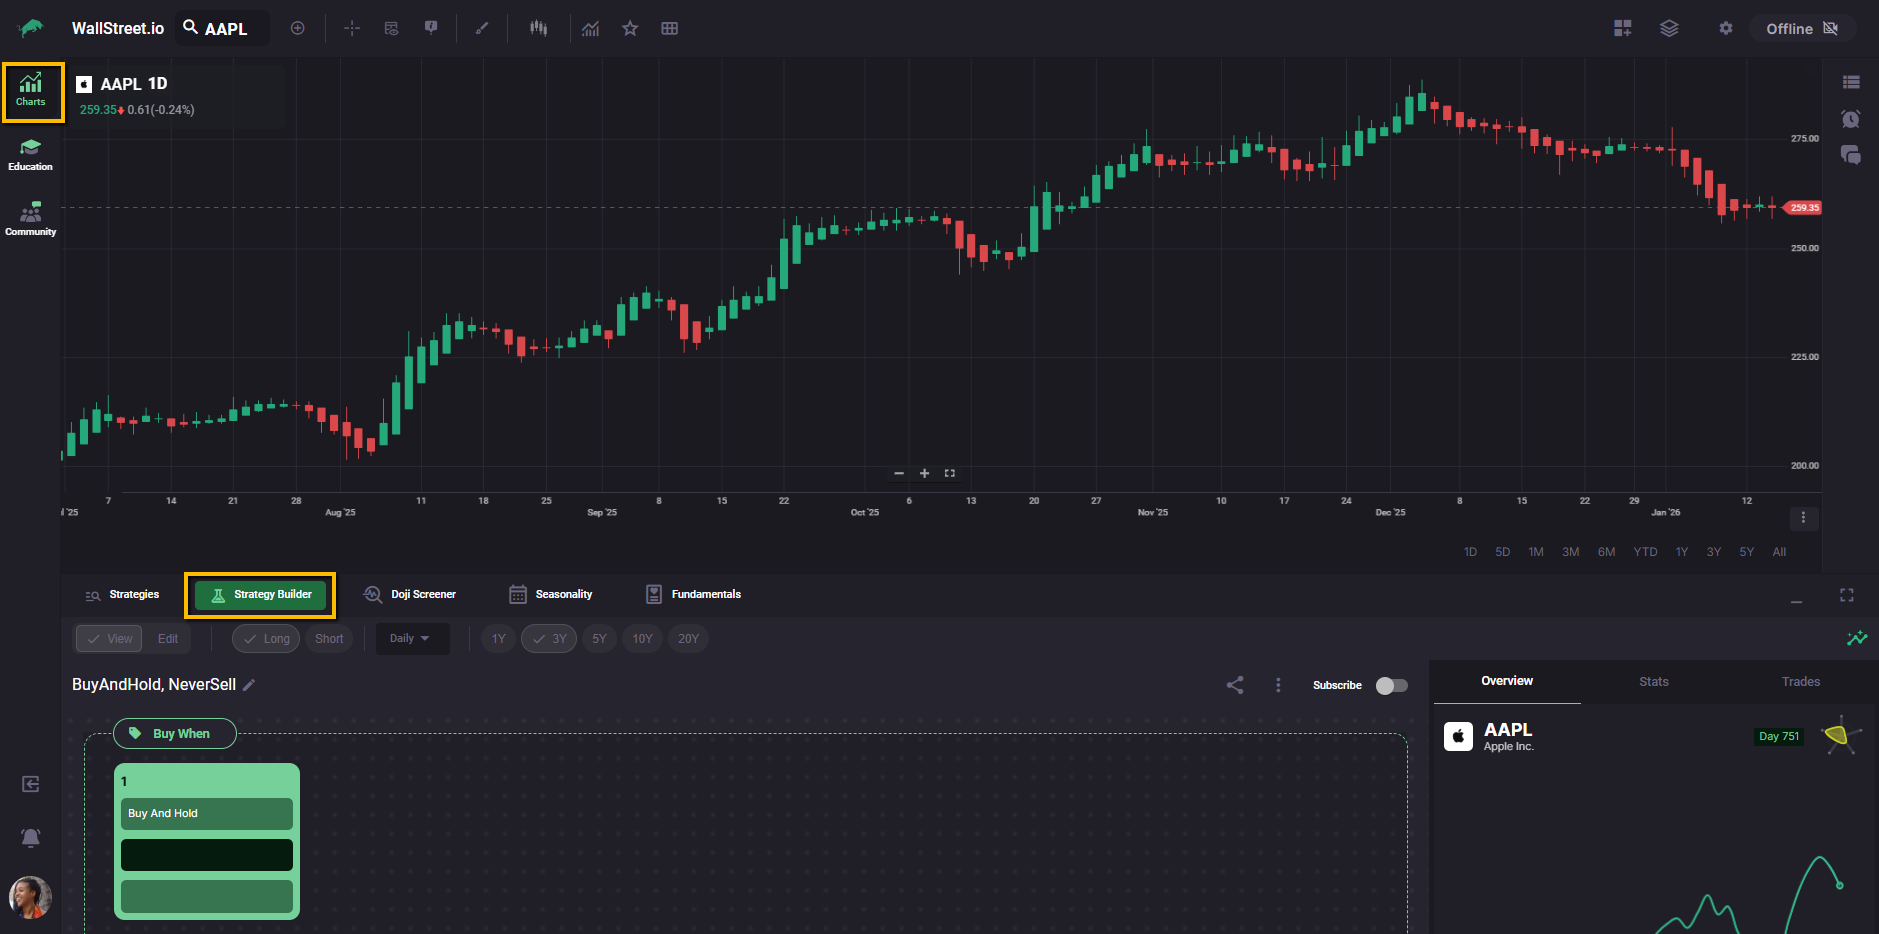
As you edit a strategy, results update in the Strategy Stats panel on the right so you can see how each change impacts performance.
In the Strategy Builder, you will typically see:
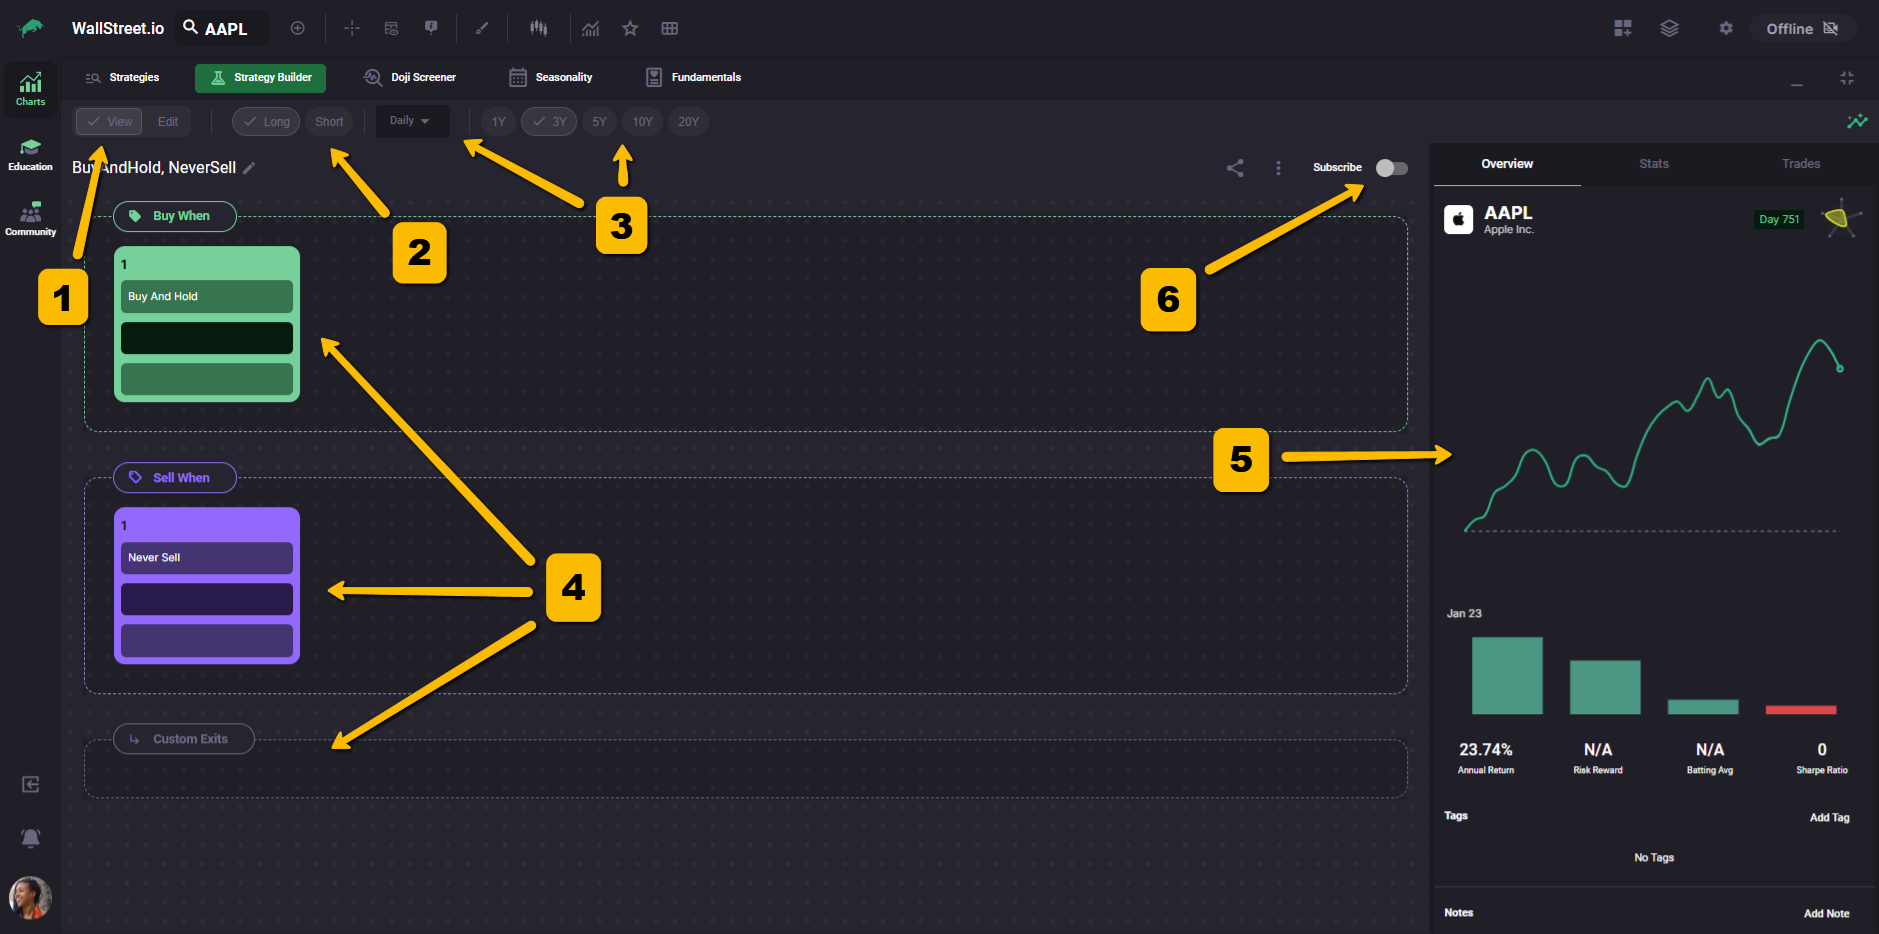
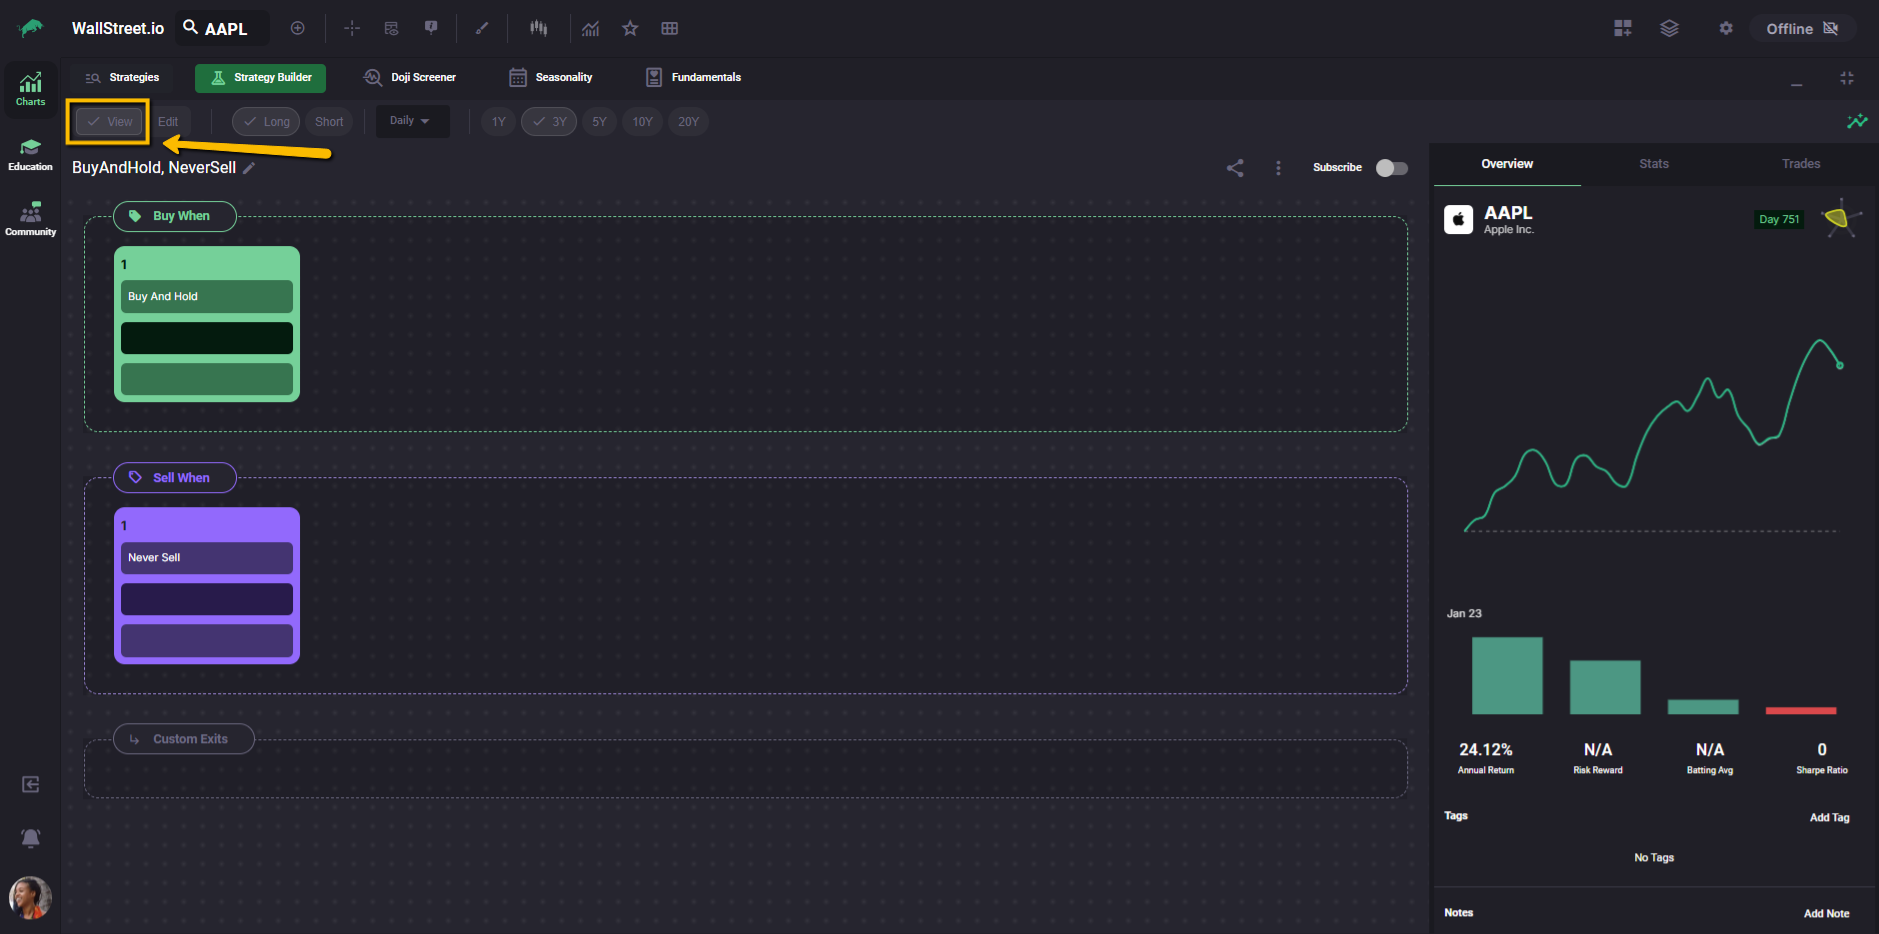
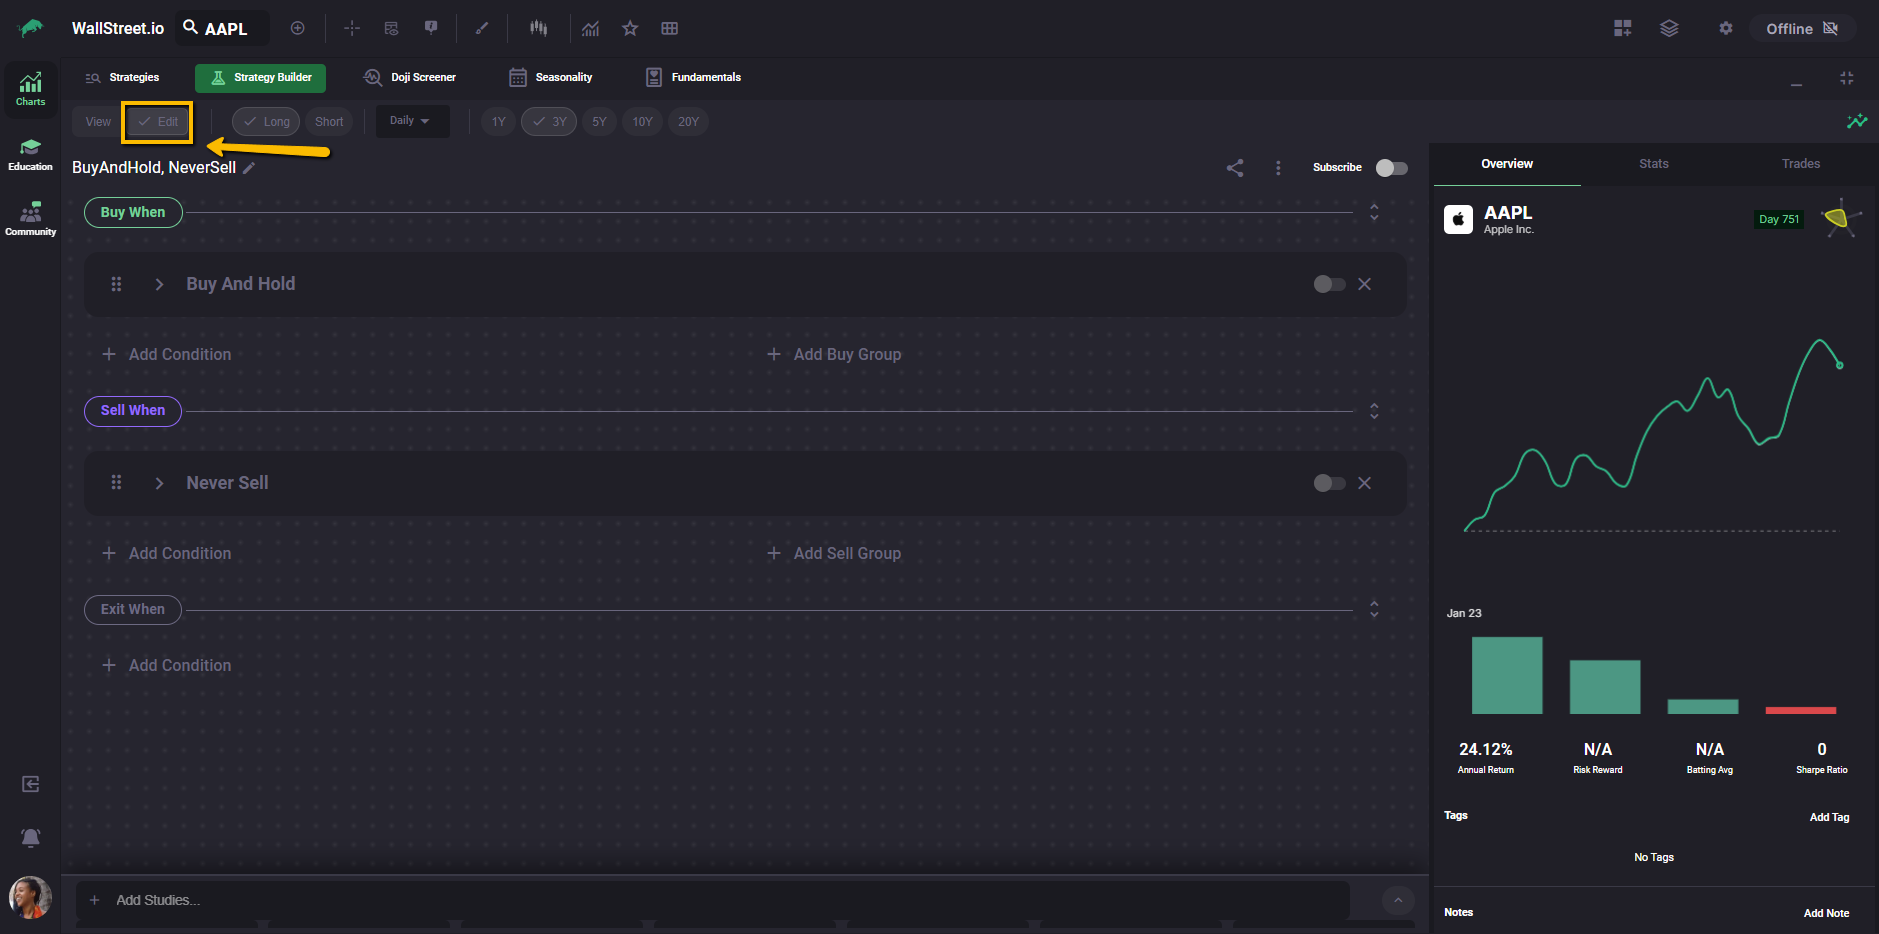
View Mode vs Edit Mode
View Mode is for reading. It shows each rule as a compact “card” so you can understand the strategy quickly.
Edit Mode is for building and changing rules.
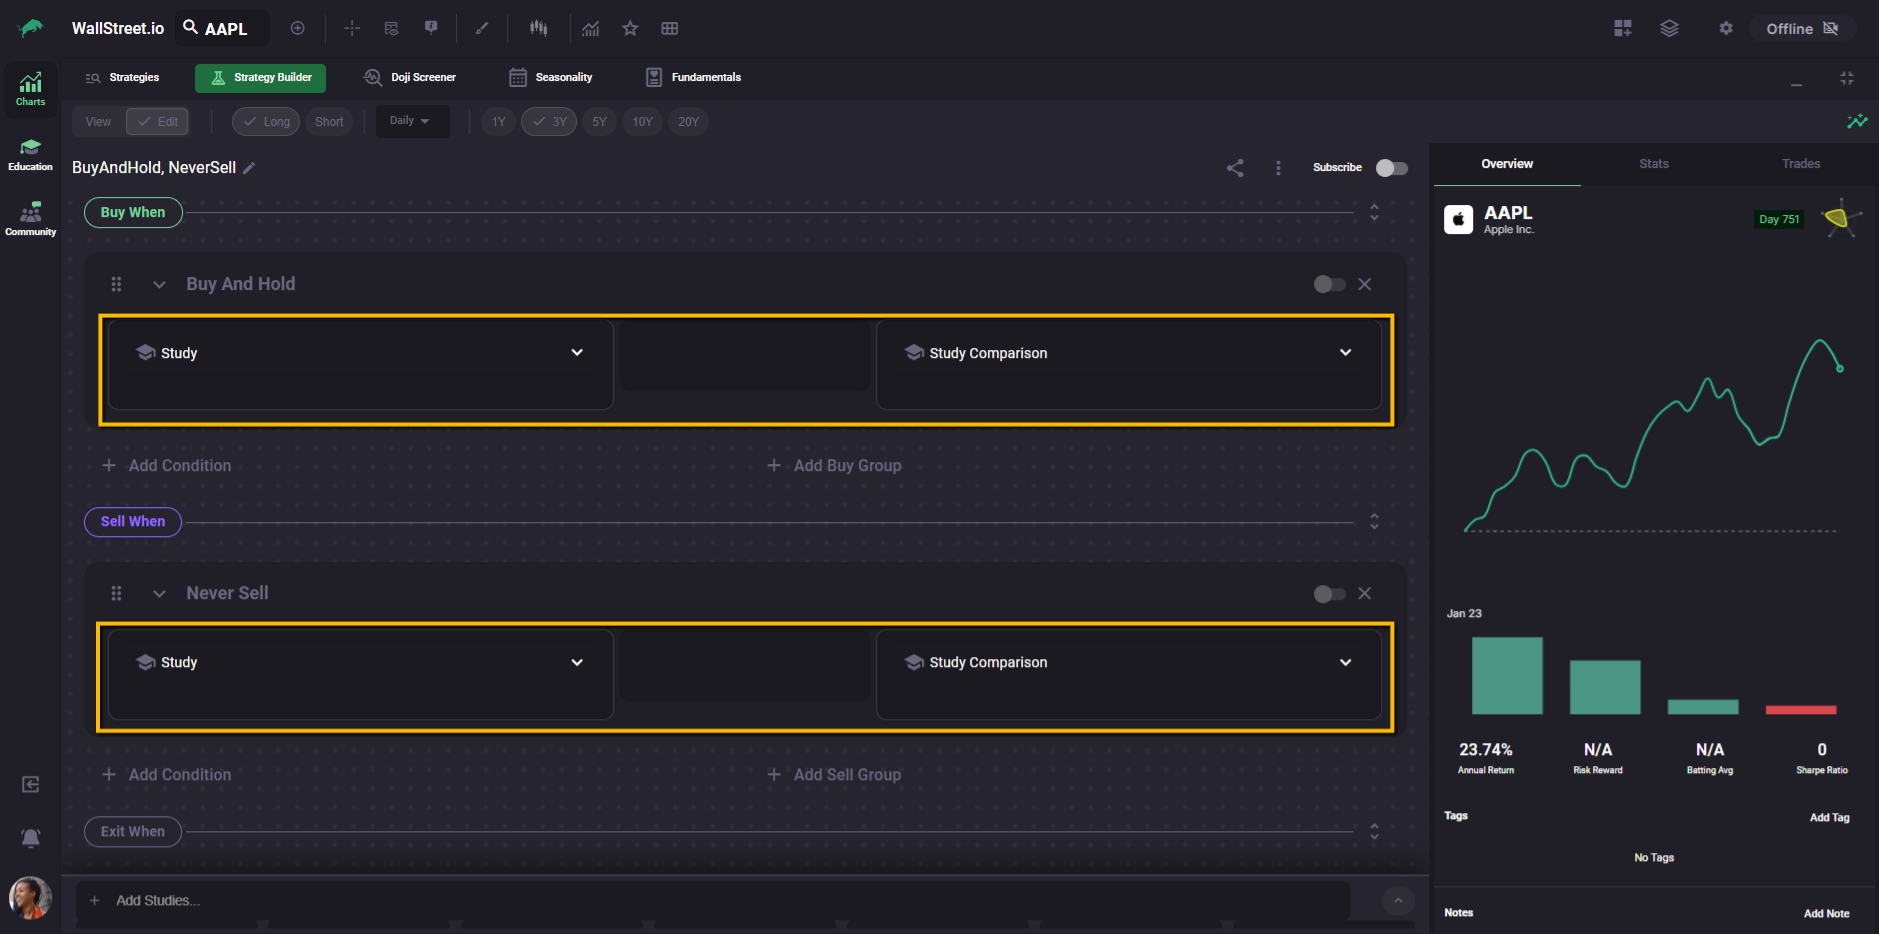
In Edit Mode, each condition expands into a structured row where you choose:
The three sections that define a strategy
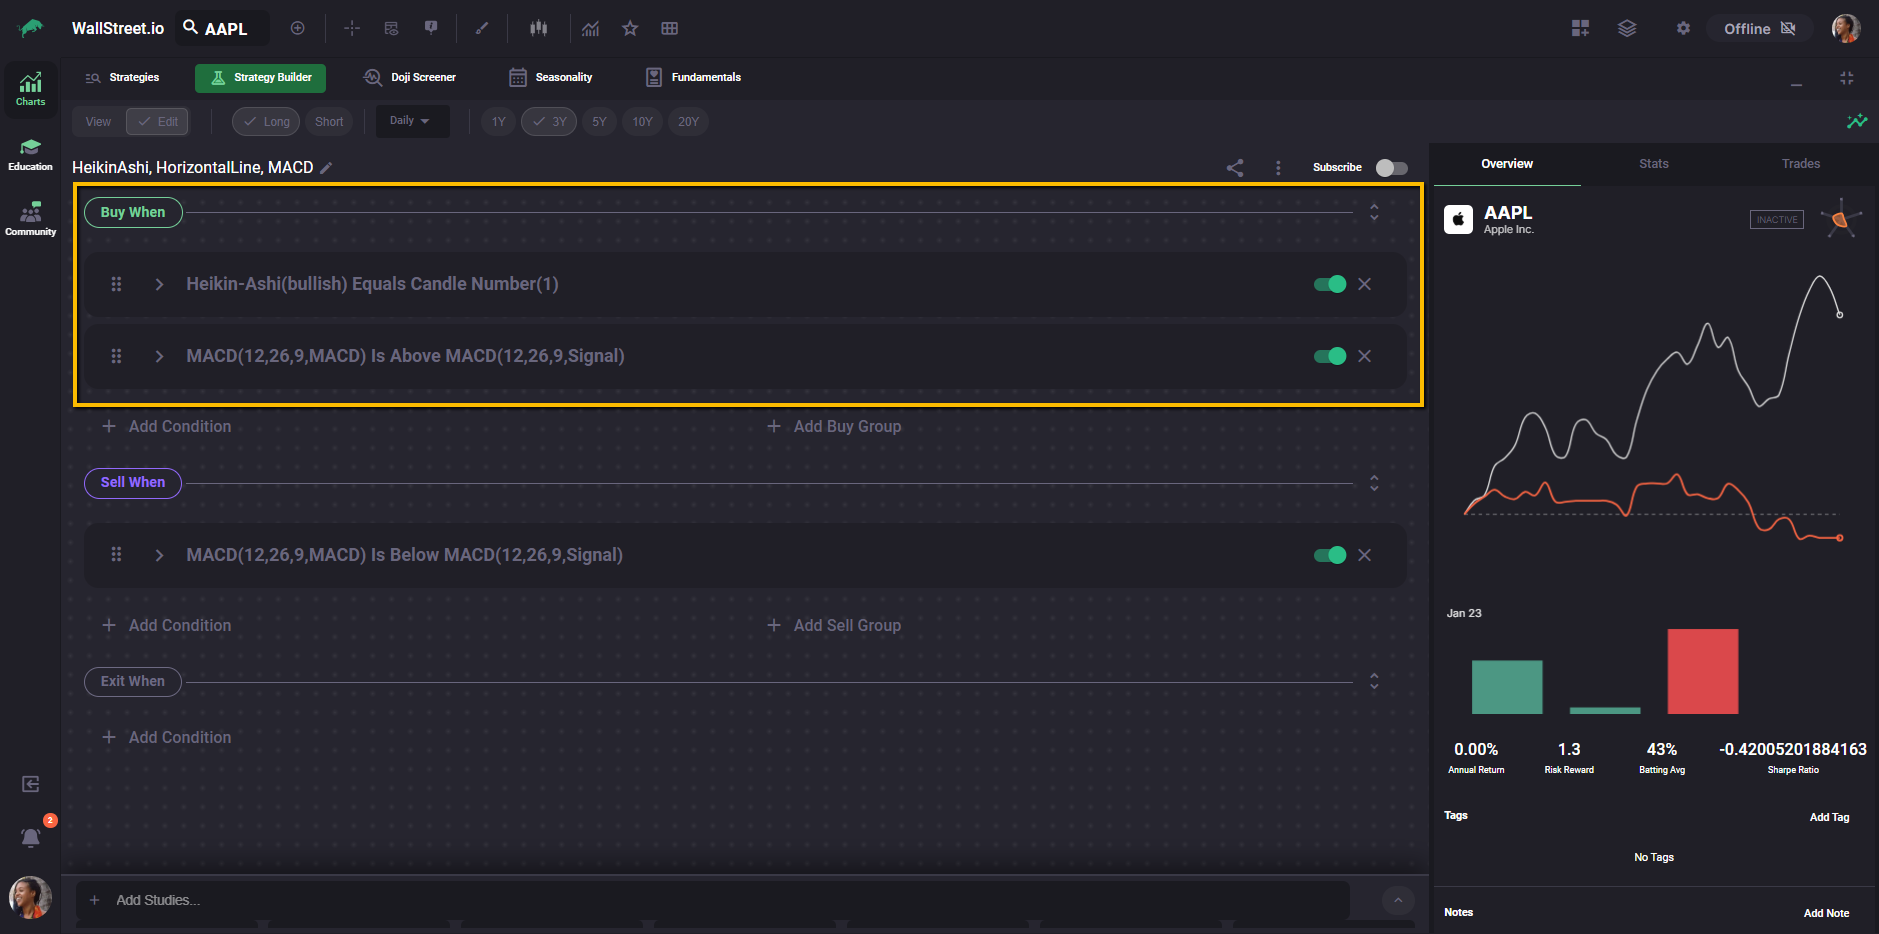
Buy When
This is your entry logic. A “Buy When” condition is what must be true to open a trade.
Example: “Buy when there’s a first bullish Heikin-Ashi candle.”
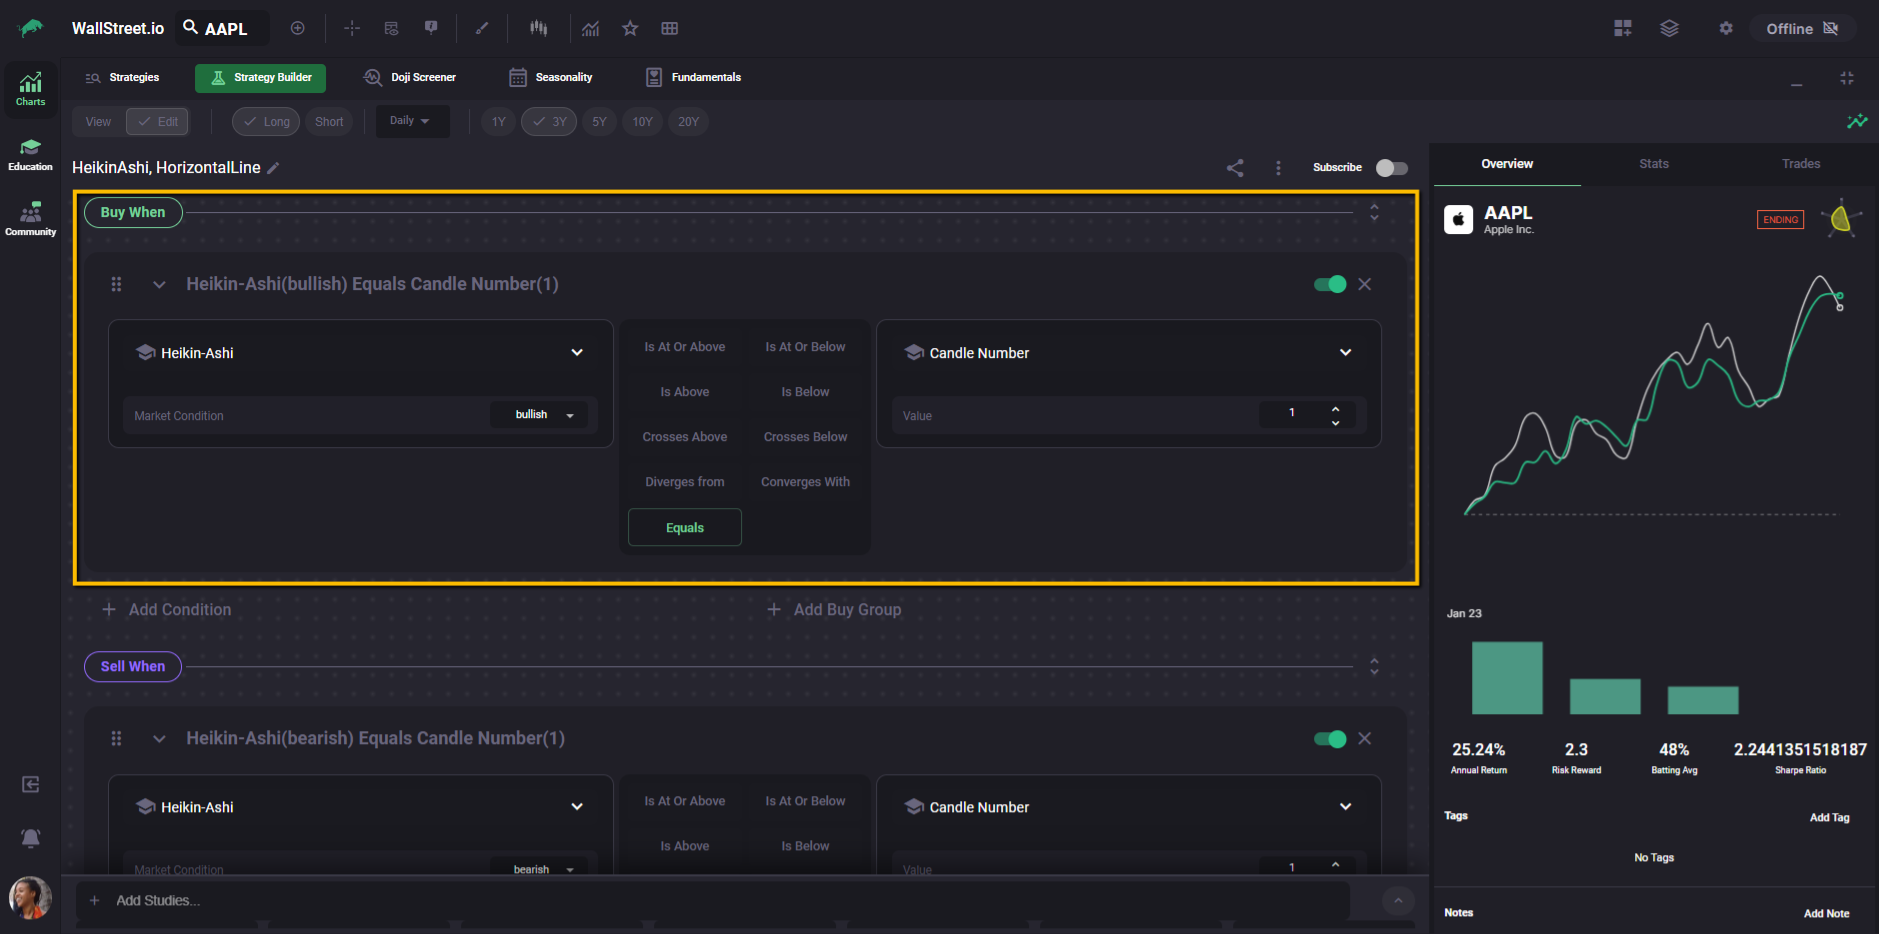
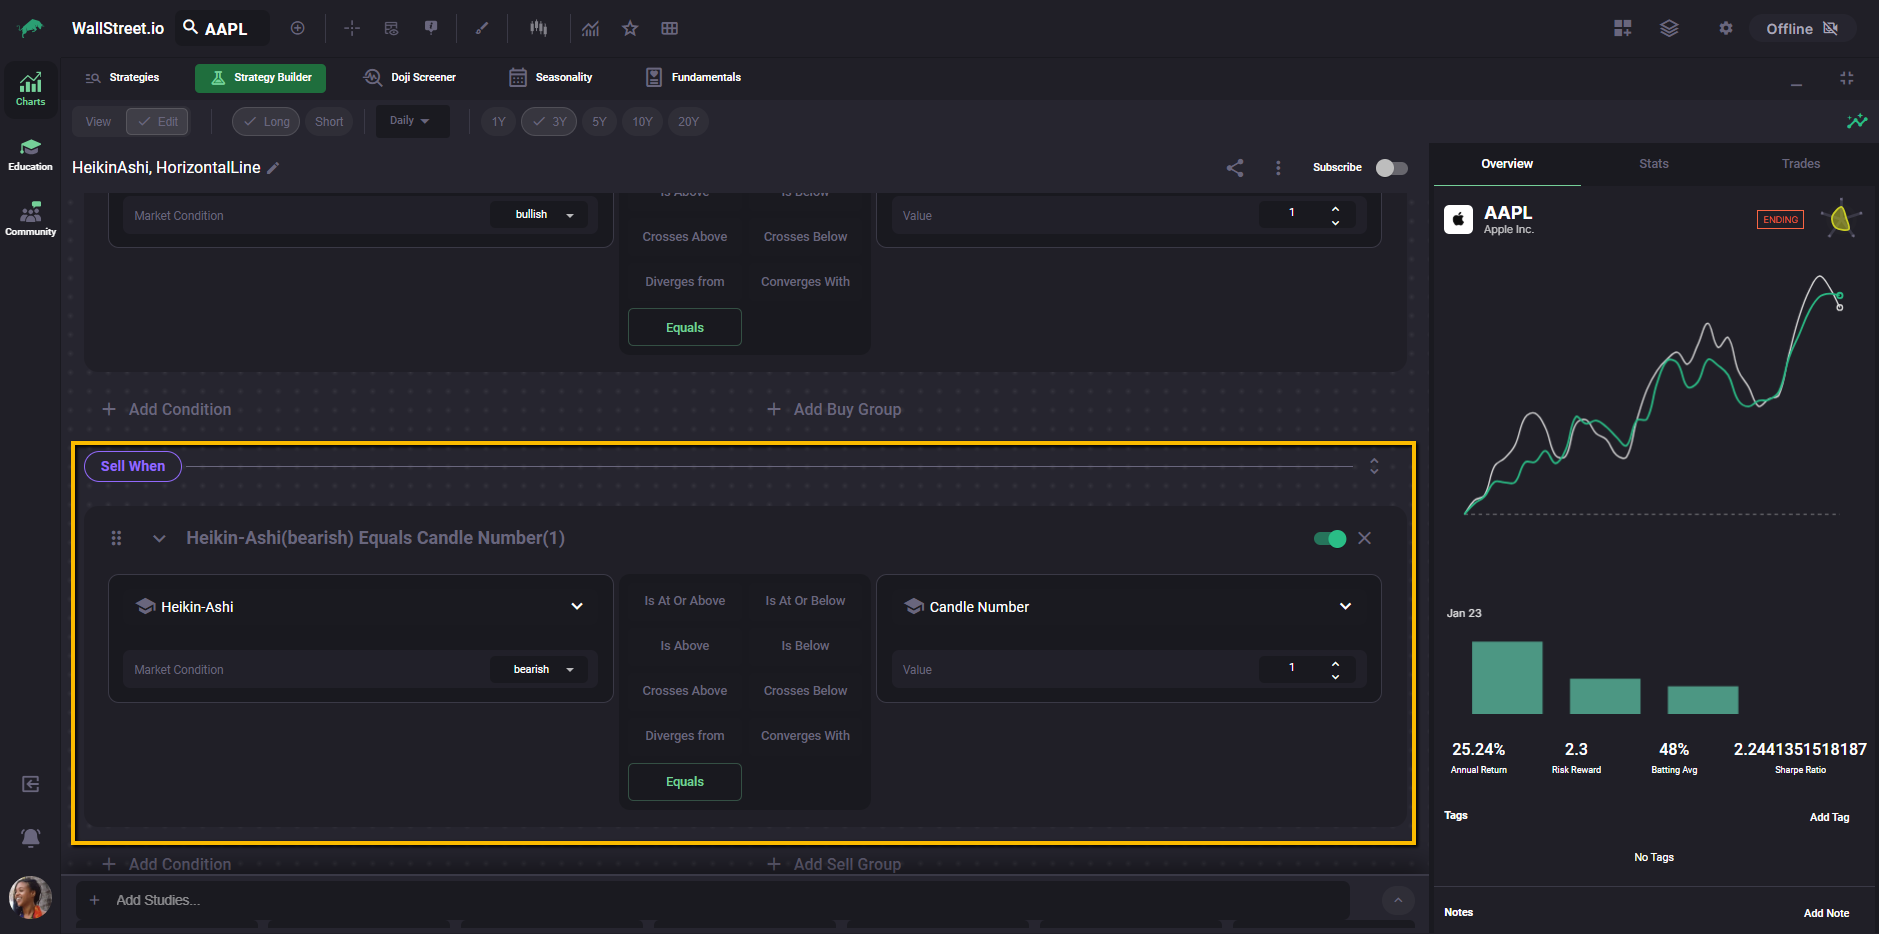
Sell When
This is your exit signal logic. A “Sell When” condition is what must be true to close a trade.
Example: “Sell when there’s a first bearish Heikin-Ashi candle.”
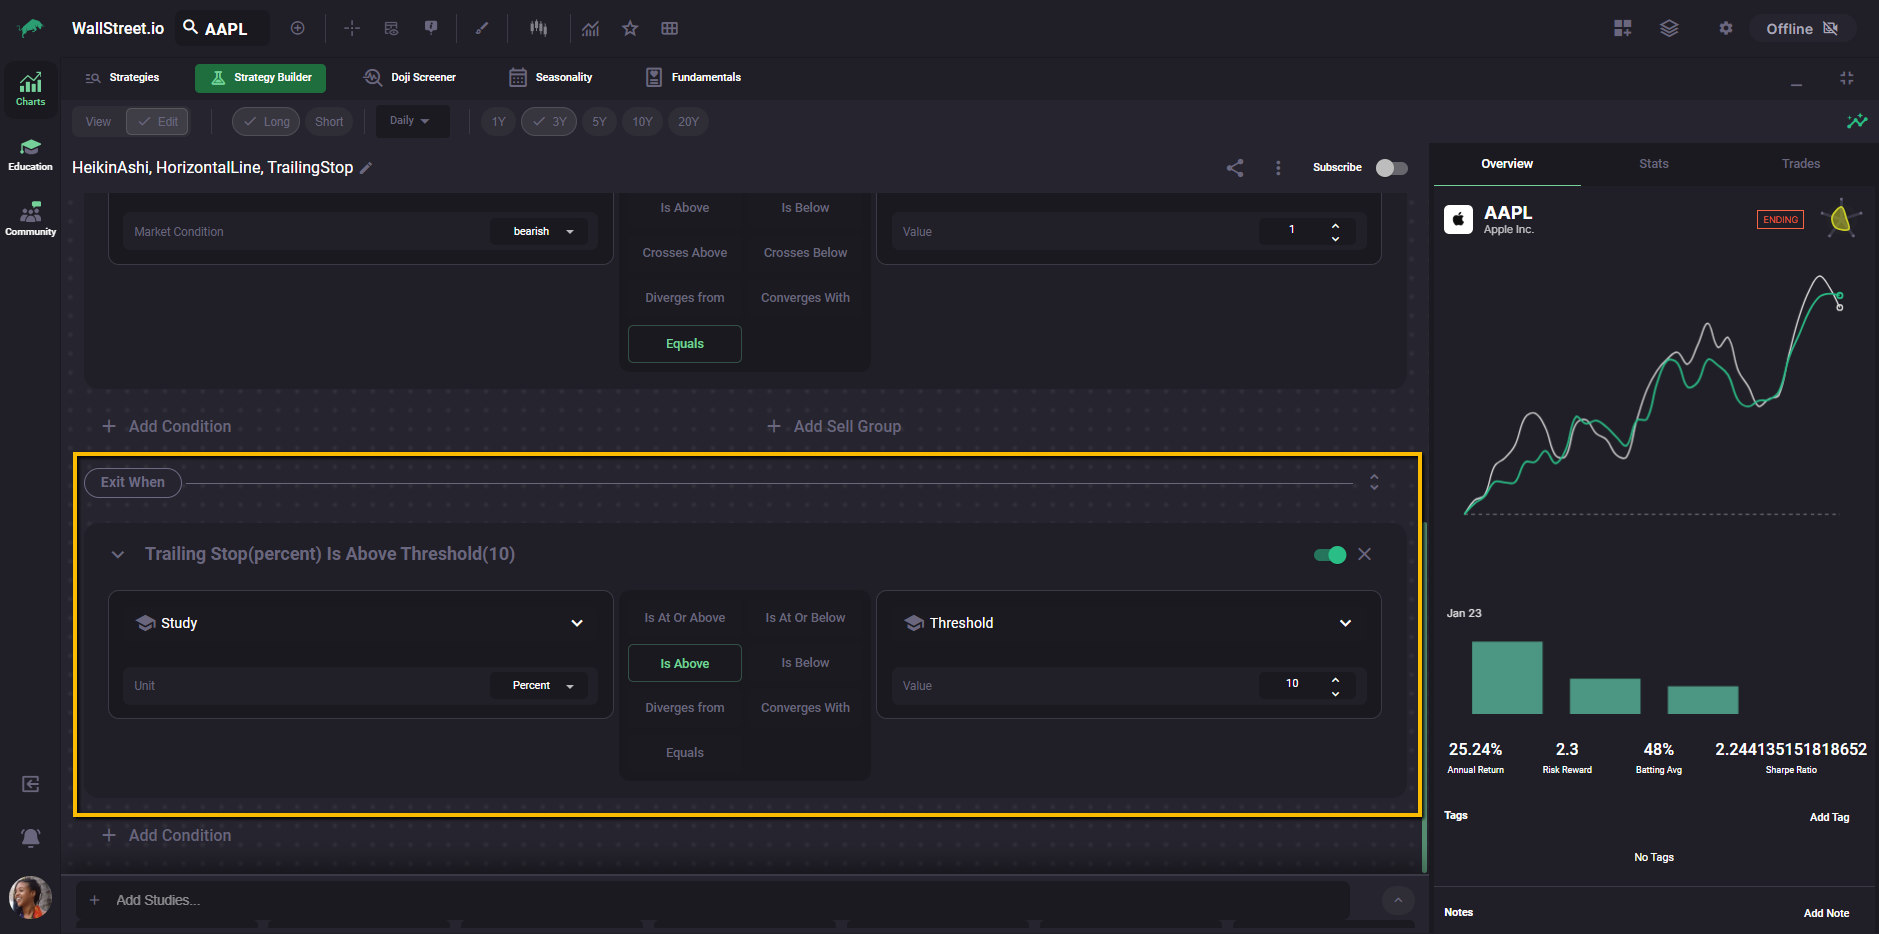
Exit When (Custom Exits)
This section is for rule-based exits that are not a traditional “Sell When signal,” like risk controls and trade management rules. This is where options like Profit Target or Stop Loss, Trade Length, and Trailing Stop live.
Profit Target or Stop Loss
Use this when you want an exit based on a defined profit target, a defined stop loss, or both.
Trade Length
Use this when you want to exit after a trade has been open for a set amount of time (a time-based exit).
Trailing Stop
Use this when you want the exit threshold to “trail” price as it moves in your favor. The trailing stop is measured from the highest price point reached and then triggers when price moves against that high by the percentage (or raw value) you set.
How exits are evaluated
A trade closes when either a Sell When signal triggers or a Custom Exit triggers, whichever happens first.
Sell When and Exit When are evaluated independently, and you do not need both to fire for a trade to close.
How a single condition is built
In Edit Mode, each condition is essentially a sentence:
Study + Interaction + Study Comparison
You start by choosing what to evaluate, then define how it behaves, and finally specify what it is compared against.
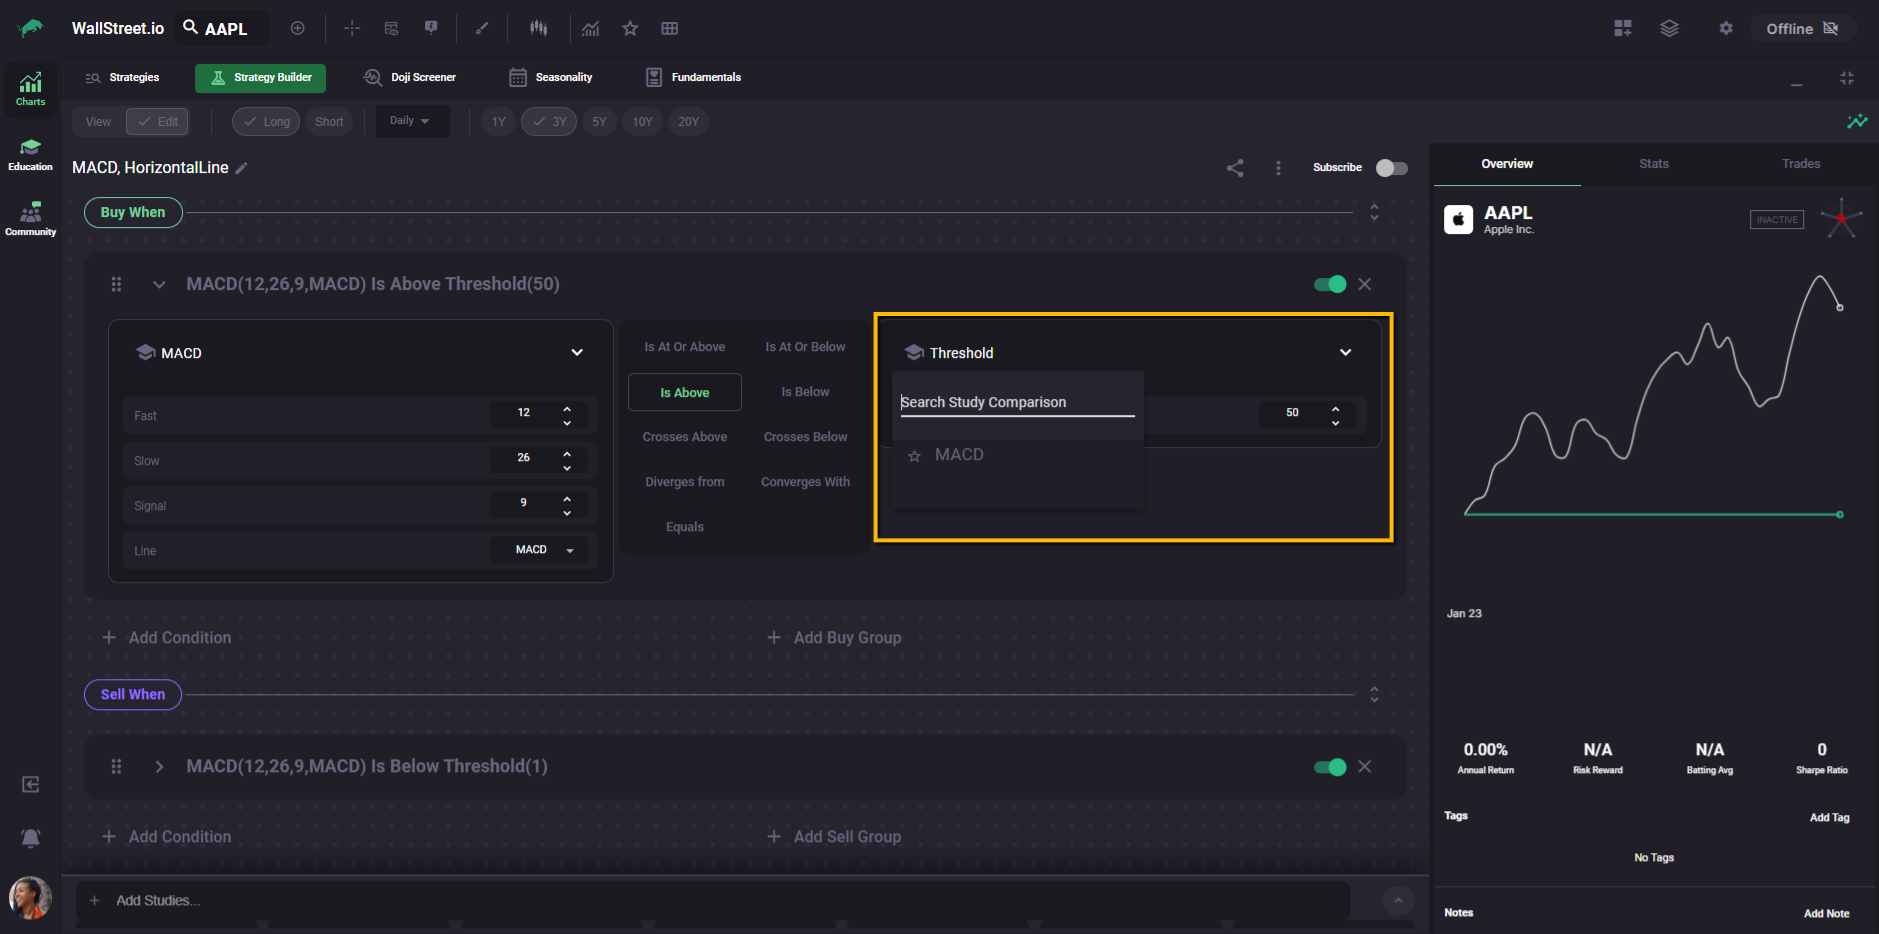
Choosing a study for a condition
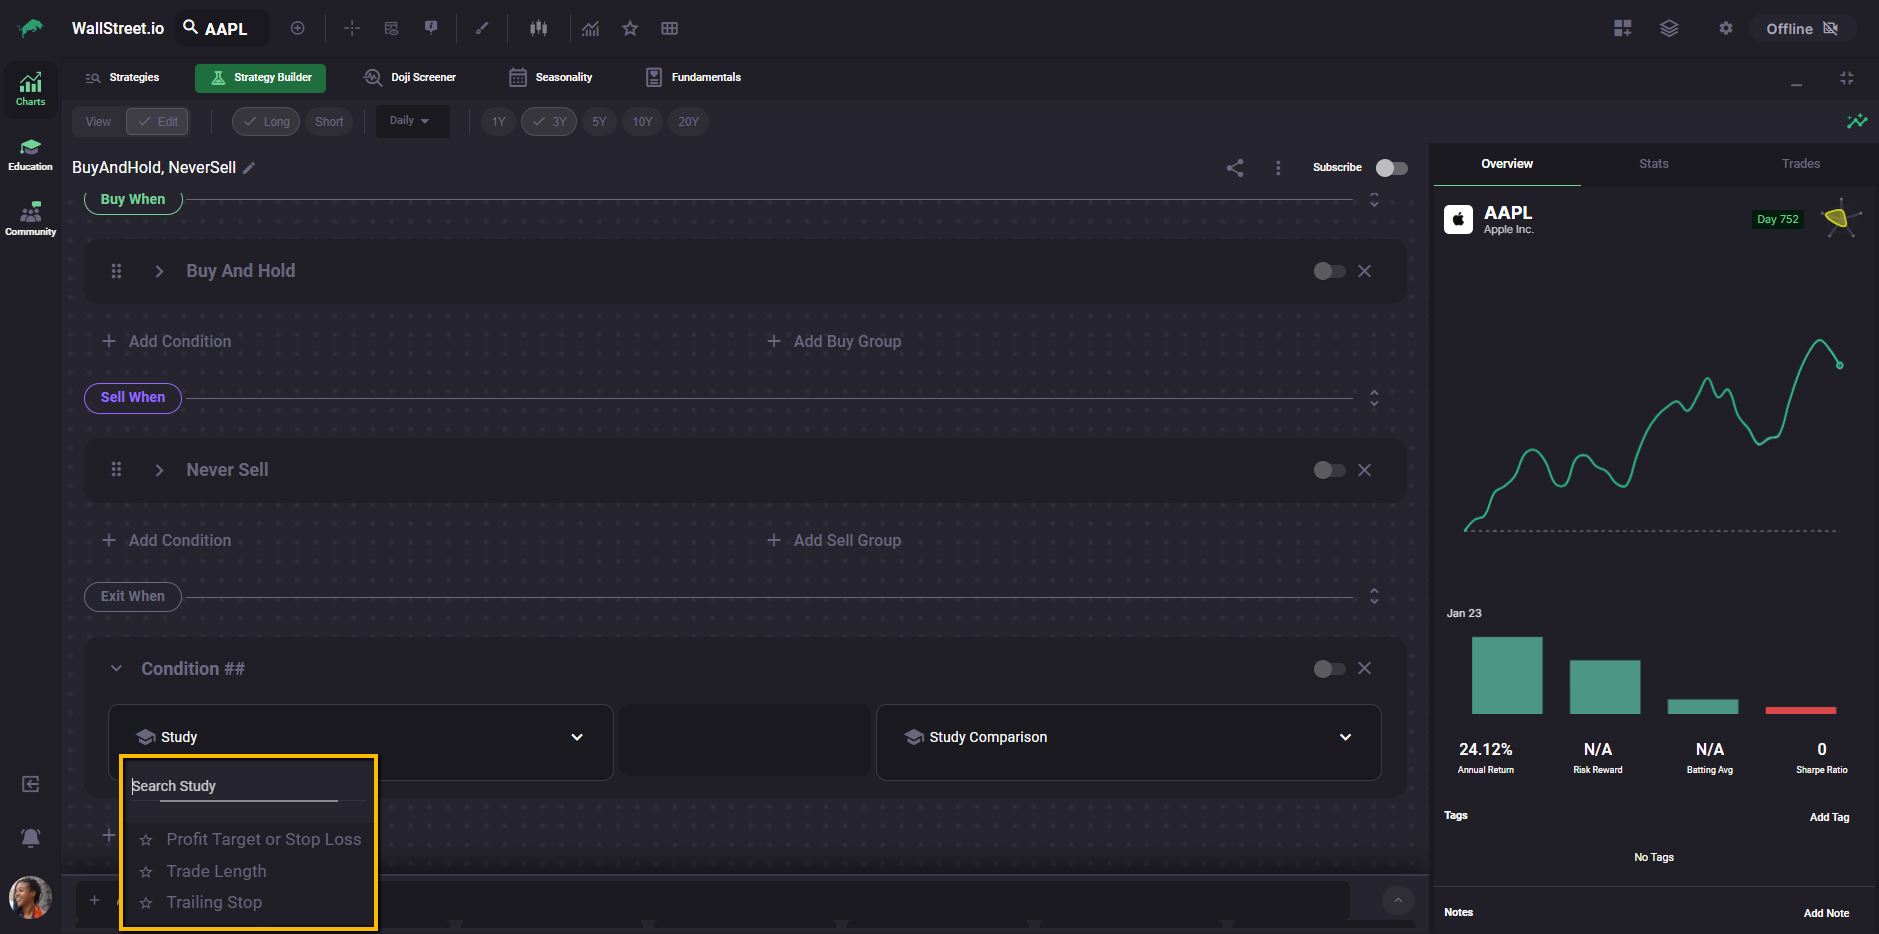
When you expand a condition in Edit Mode, the leftmost field is the Study selector. This is where every condition begins.
Clicking the Study field opens a searchable list of available studies. From here, you can scroll or type to find the indicator you want to use, then select it to populate the condition.
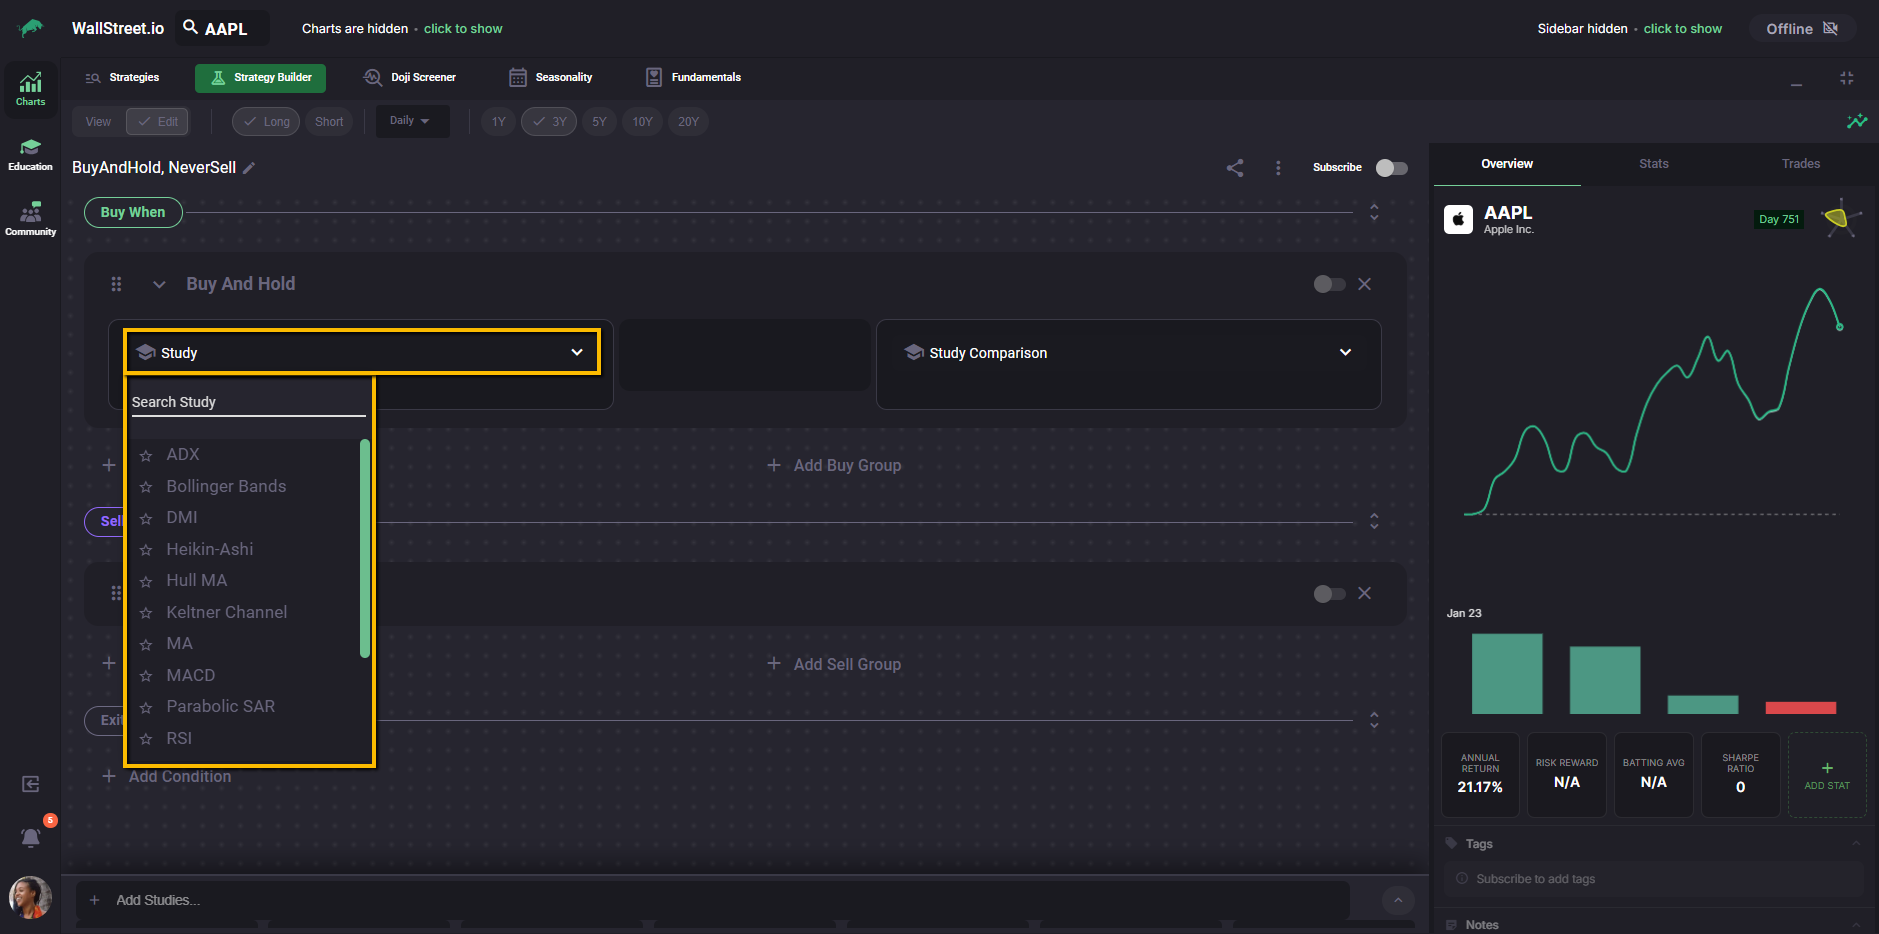
Once a study is selected, the condition row expands to reveal:
At this point, the condition becomes configurable. You’re no longer choosing what to evaluate, but how it should behave and what it should be compared against.
This dropdown-based method is the most direct way to add a study when you’re building conditions one at a time or learning how individual studies behave inside the Strategy Builder.
Interactions and comparisons
Once a study is selected, the Interaction area appears as a set of buttons you can click.
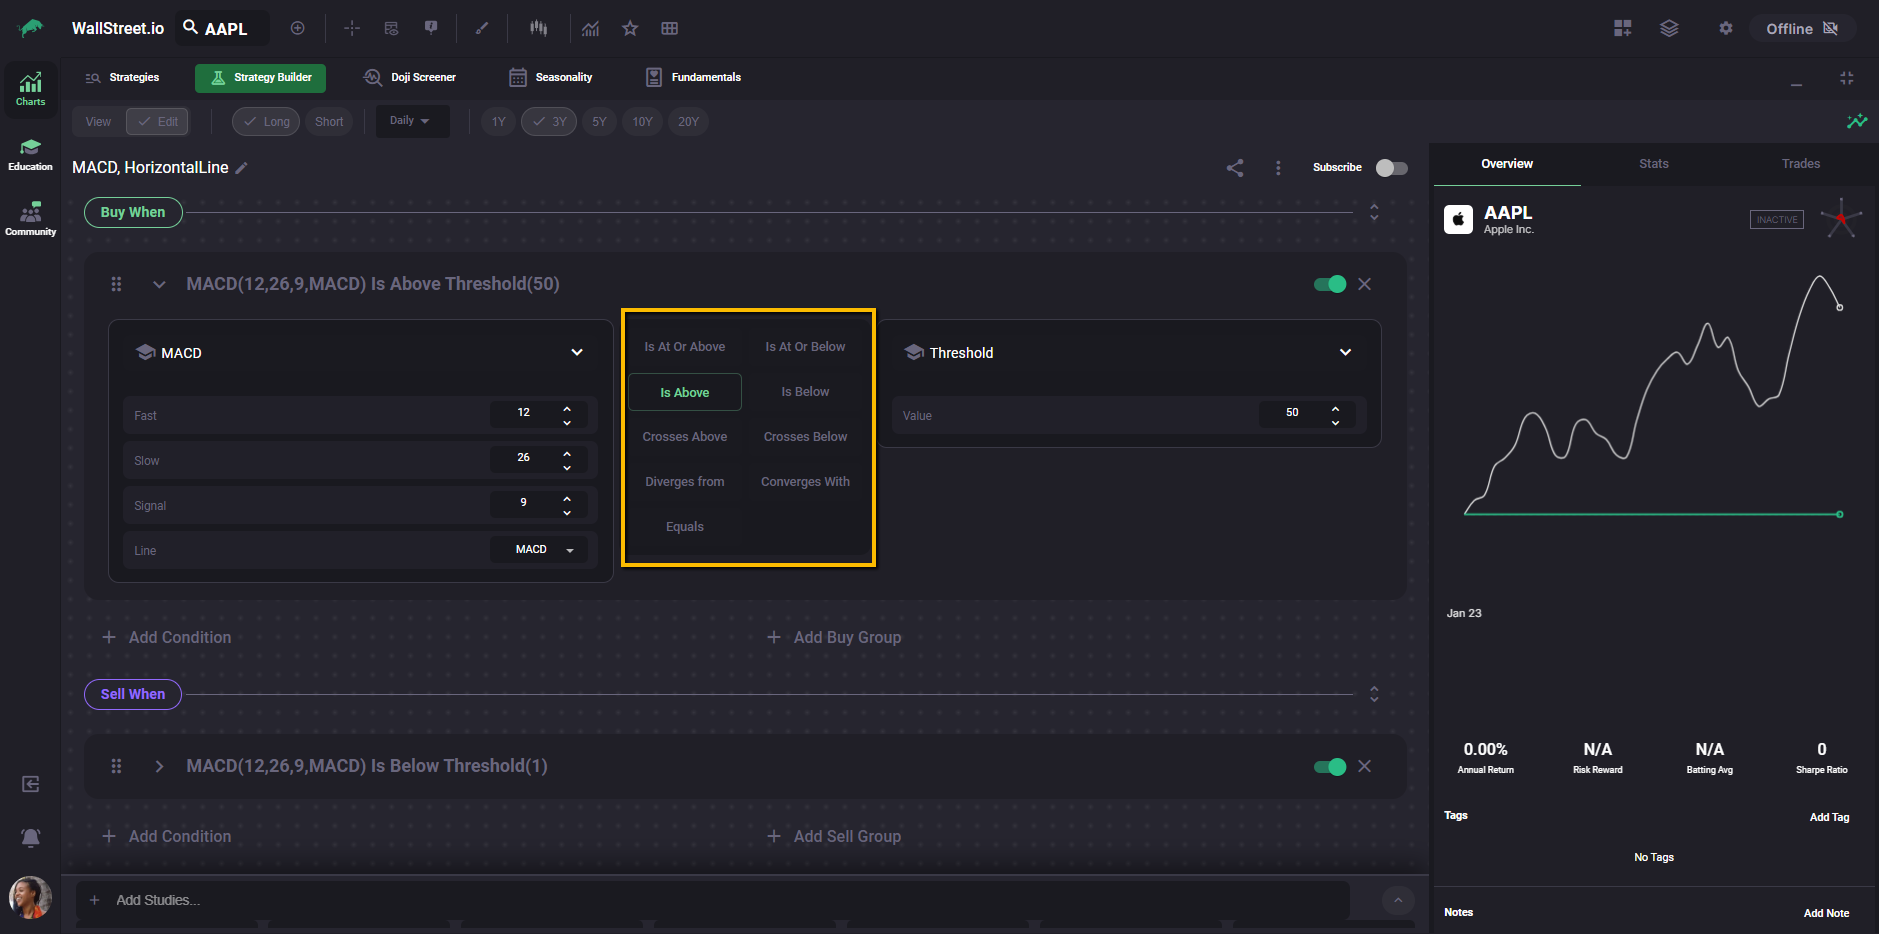
The Interaction defines how the value on the left is evaluated against the value on the right. You can think of it as the “verb” in the condition.
Examples of common interaction types include:
These interaction types control when a condition becomes true and how often it can trigger.
The right-side Study Comparison area can represent another study line (for example, MACD line vs Signal line) or a fixed value, such as a threshold, depending on what you’re building.
Because interactions are central to strategy behavior, they are covered in detail in the Interactions Complete Guide, which explains how each interaction works, how they differ from one another, and how they affect trade timing.
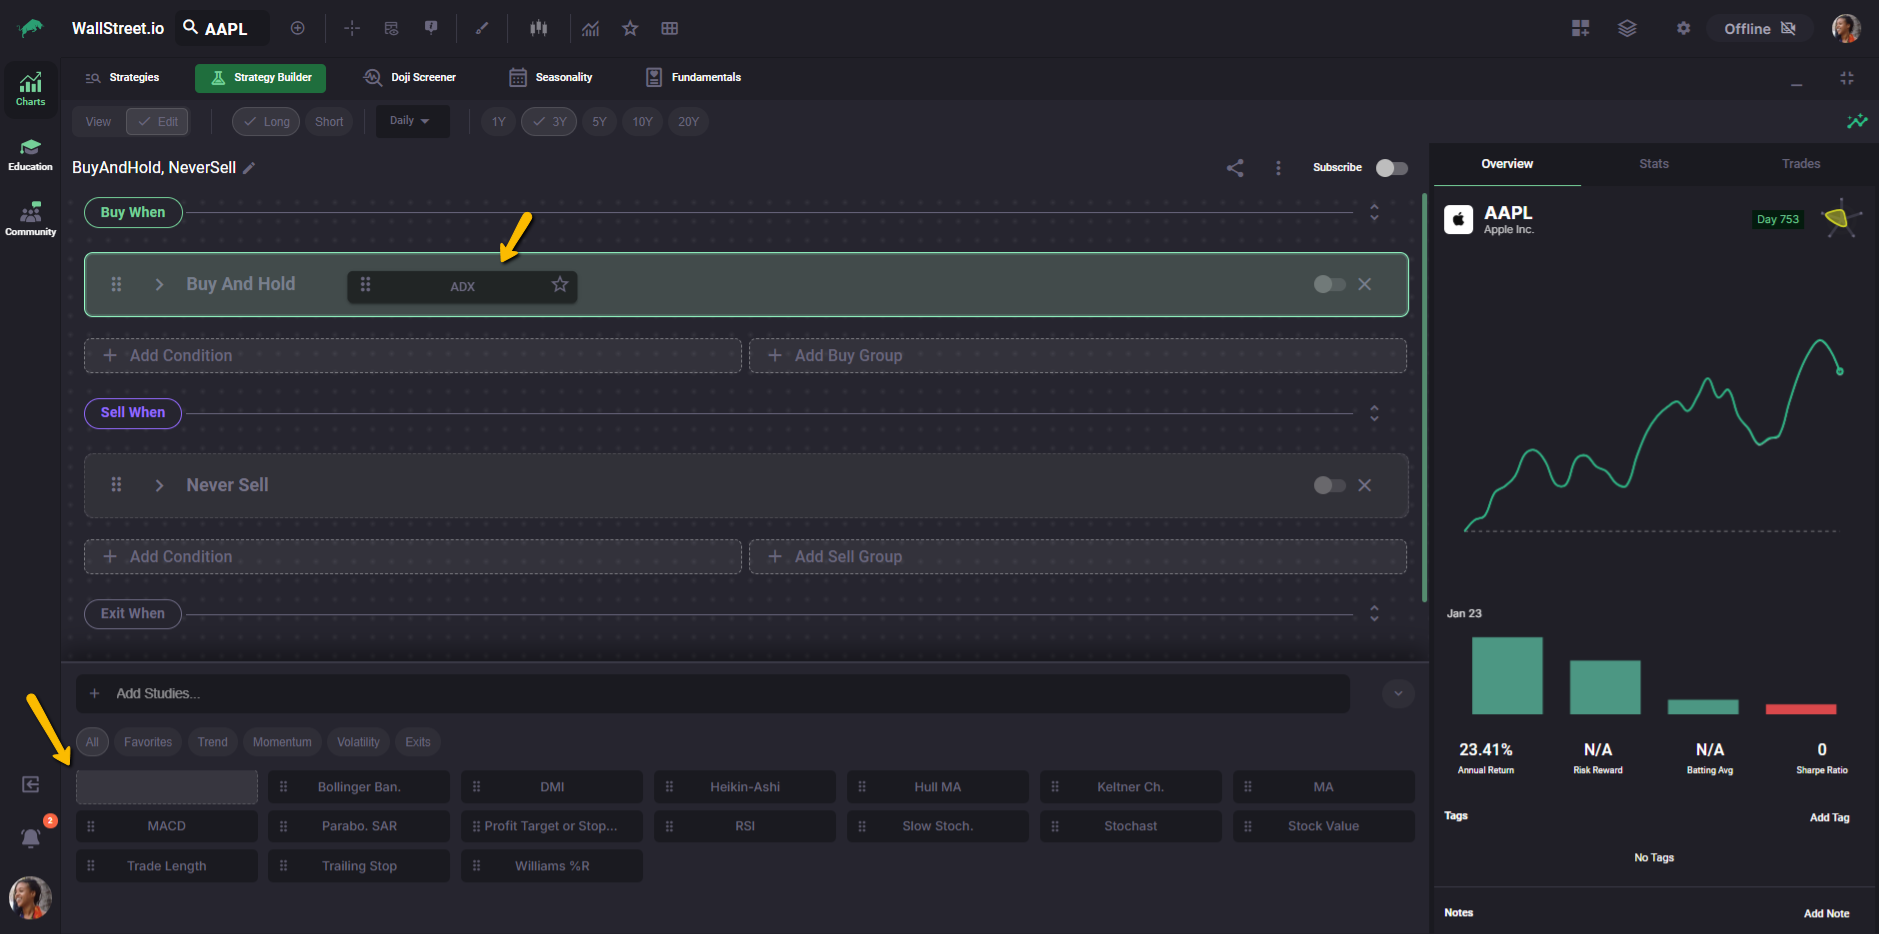
Adding studies faster with the Add Studies panel
In Edit Mode, you can also add studies using the Add Studies panel at the bottom of the Strategy Builder.
When the panel is collapsed, you’ll see a thin bar labeled Add Studies… at the bottom of the builder. Expand it to browse and insert studies more quickly.
Once open, the panel lets you:
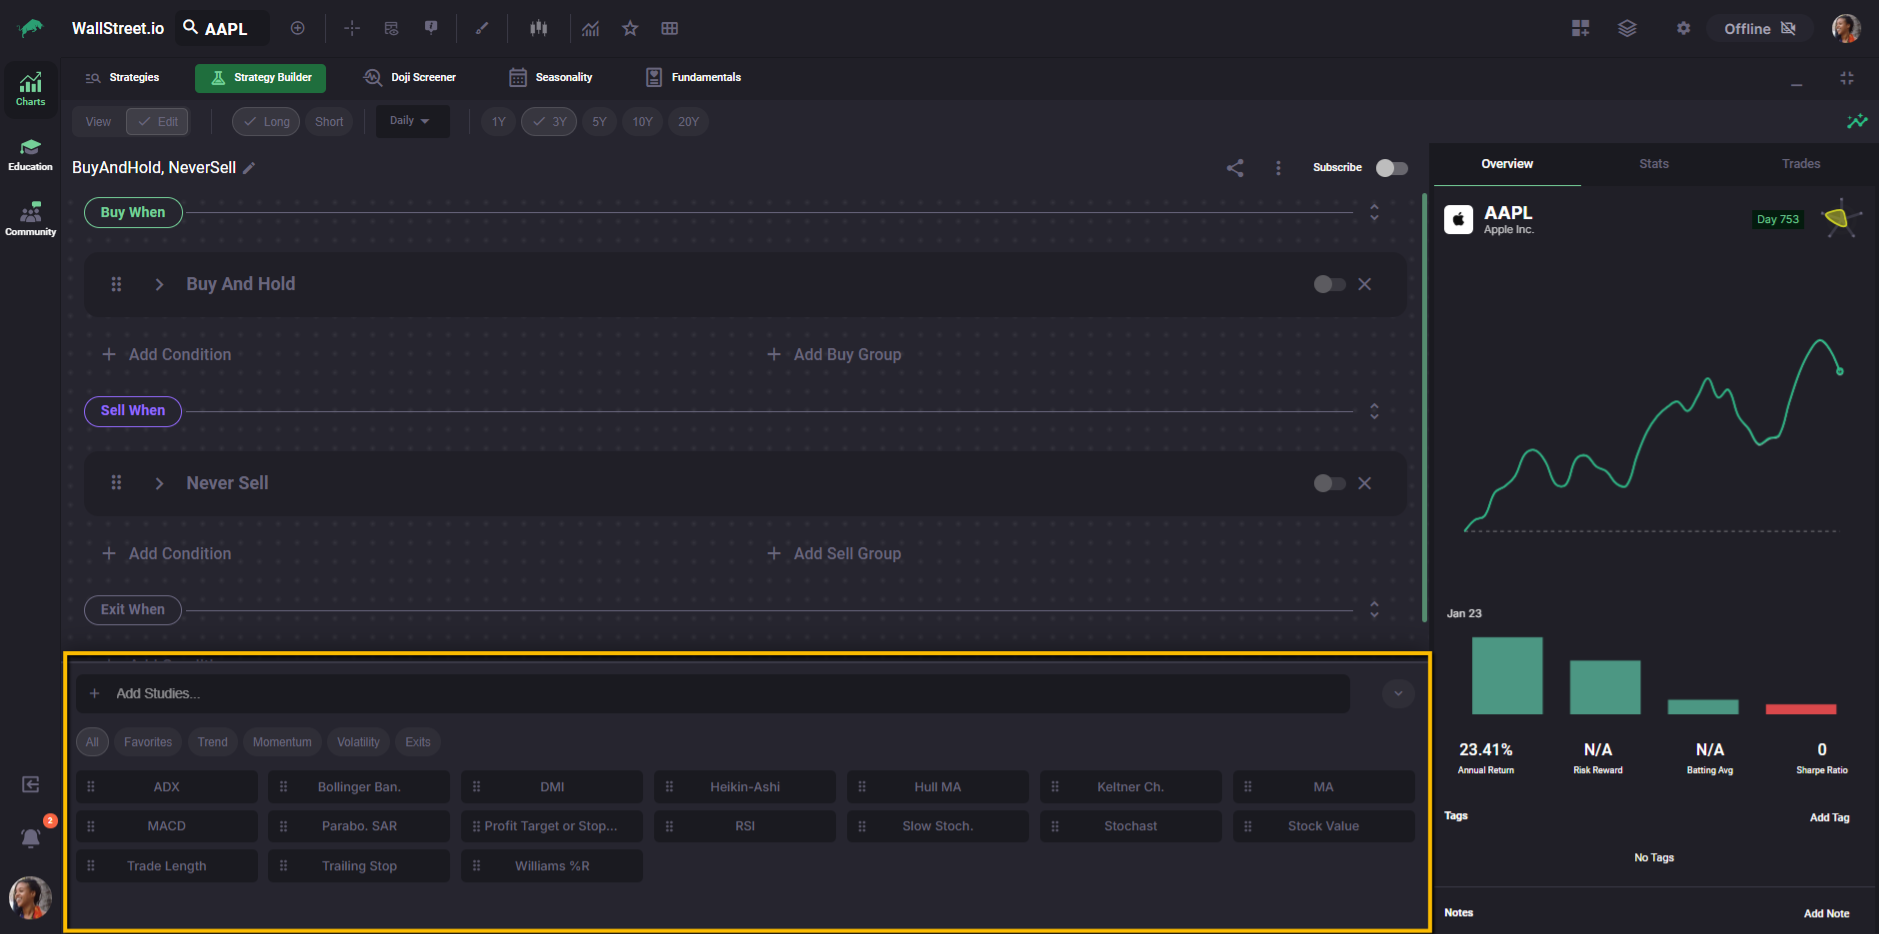
To insert a study quickly, drag a study from the panel and drop it onto the condition row where you want it. This is a fast way to build out Buy When and Sell When conditions without repeatedly opening dropdown menus.
Once you select a Study from the first menu (example: MACD), the Interaction area appears as a set of buttons you can click.
How conditions and groups work (AND vs OR)
In the Strategy Builder, conditions can be combined in two ways: AND logic inside a group, and OR logic between groups.
When you add multiple conditions inside the same group, the strategy treats them as AND. That means every condition in that group must be true for the signal to trigger.
When you add another group, the strategy treats groups as OR. That means any one group can trigger the signal.
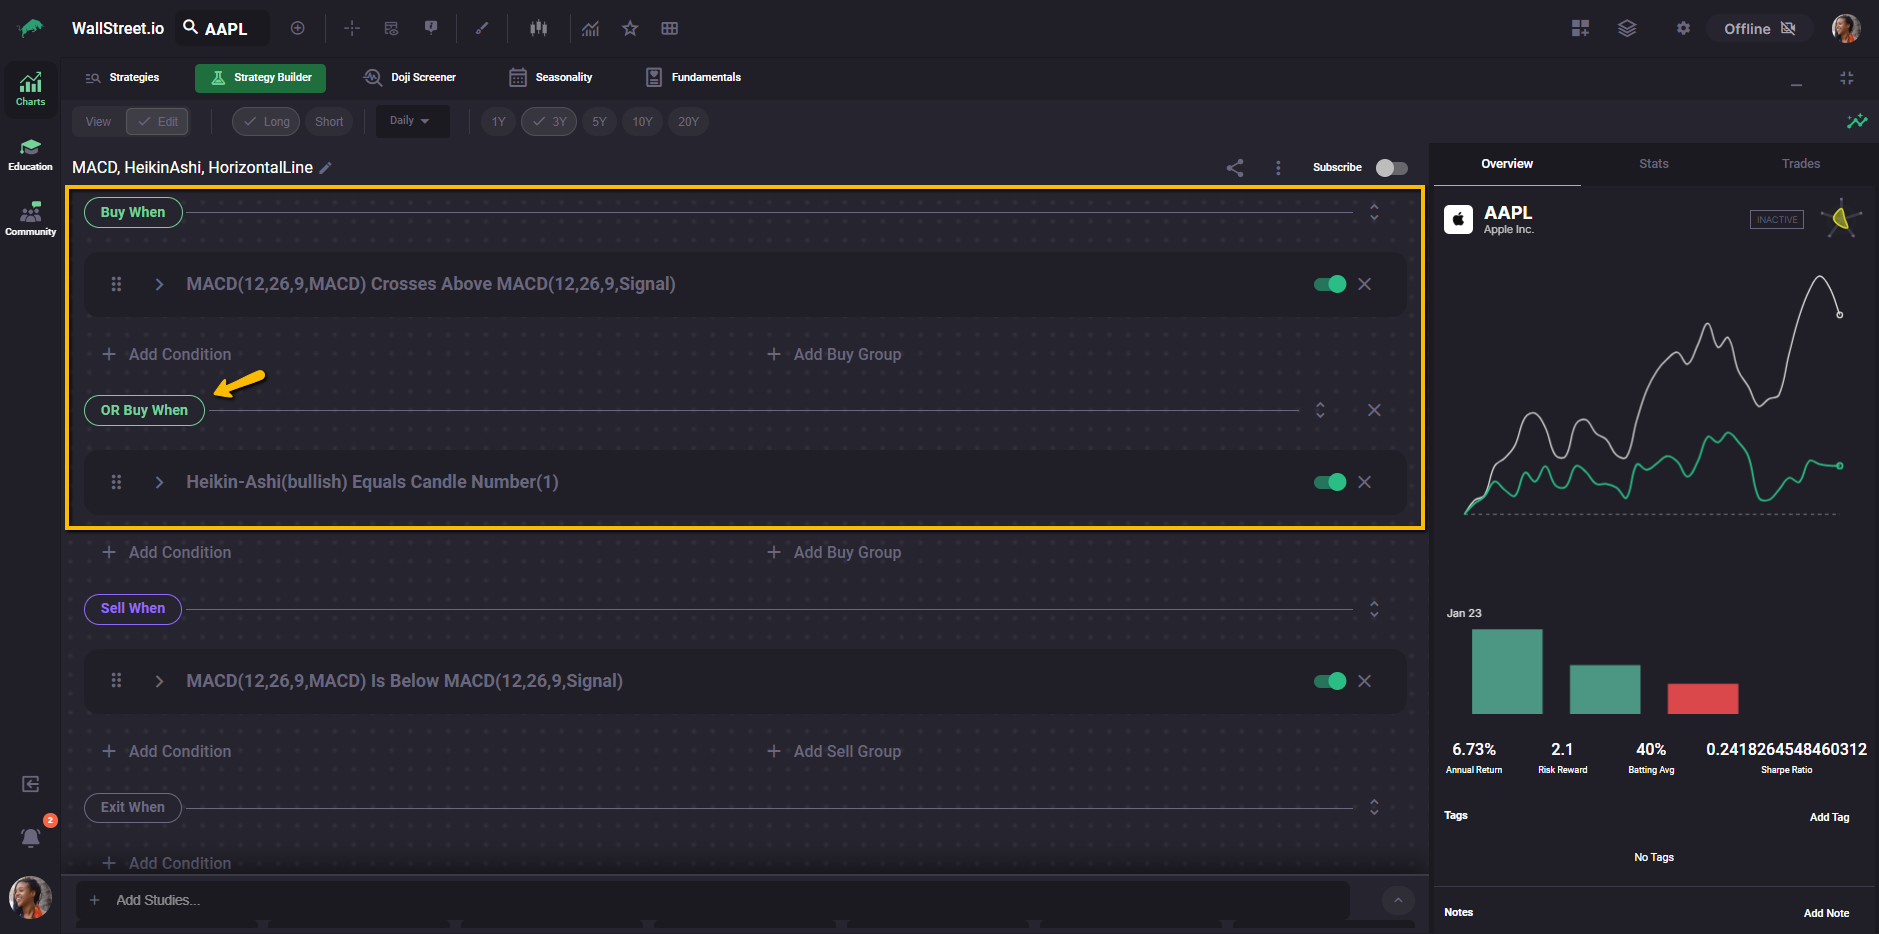
You build this structure using two buttons:
In practice, this means:
A Buy When or Sell When signal is considered true when all conditions inside at least one group are true.
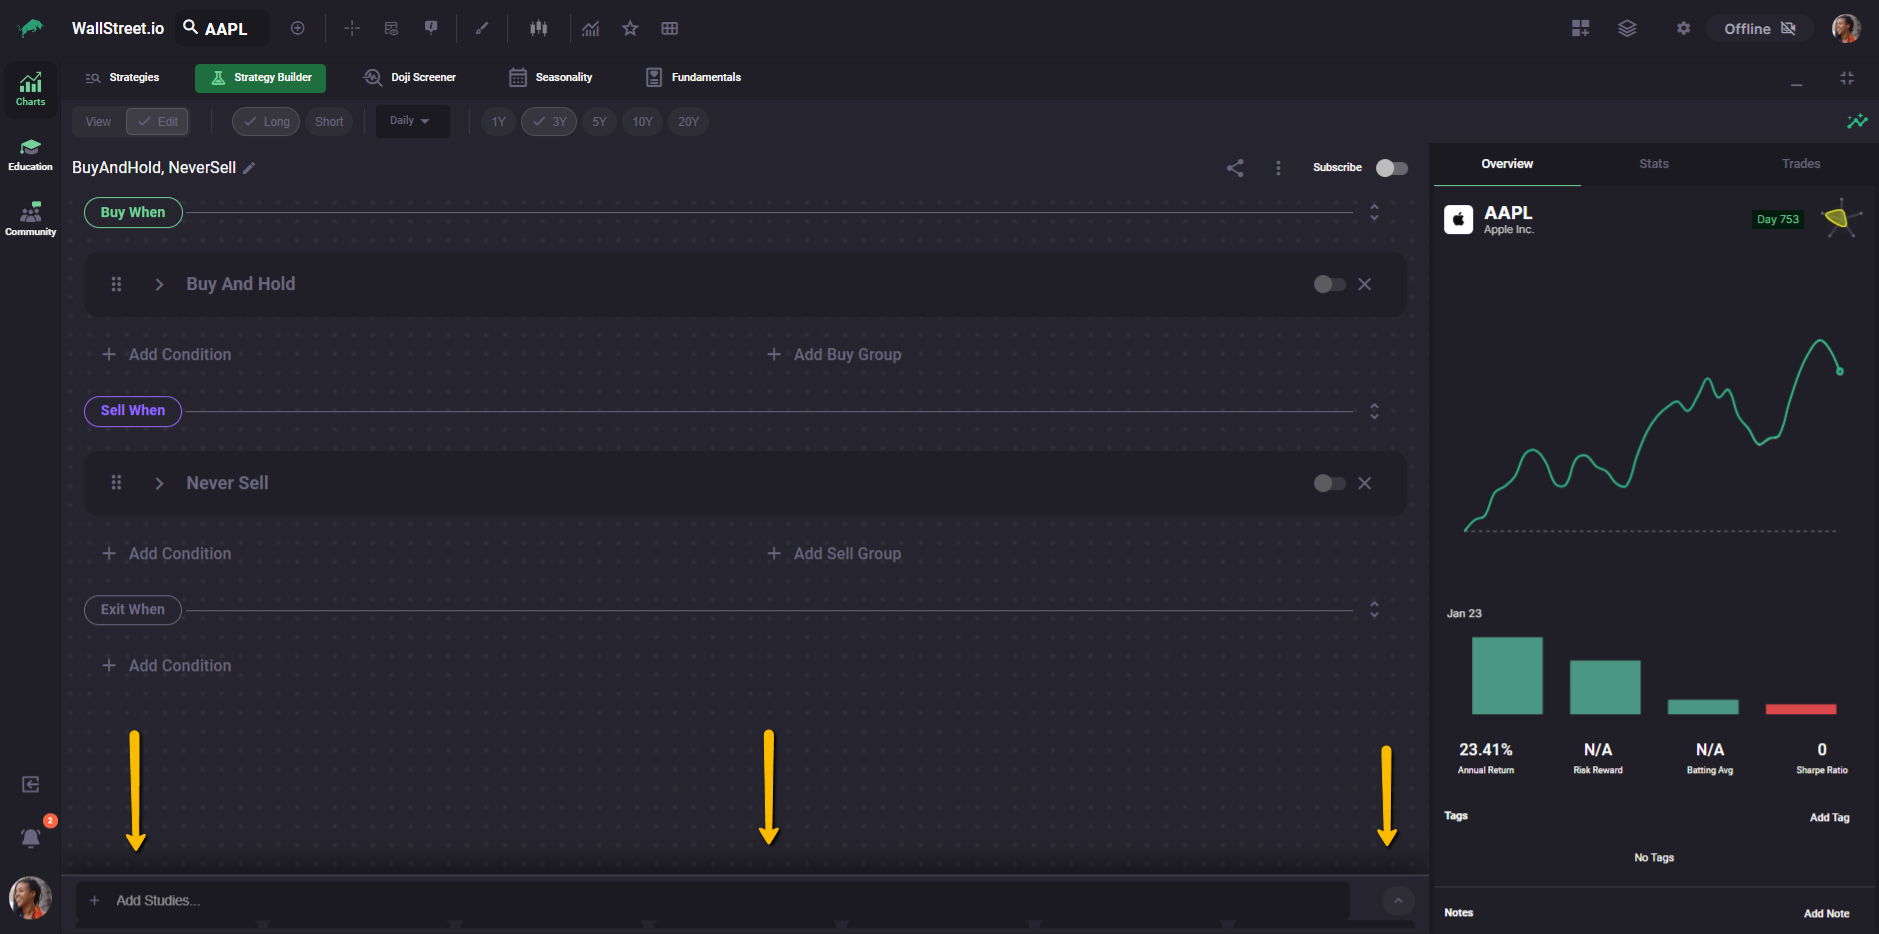
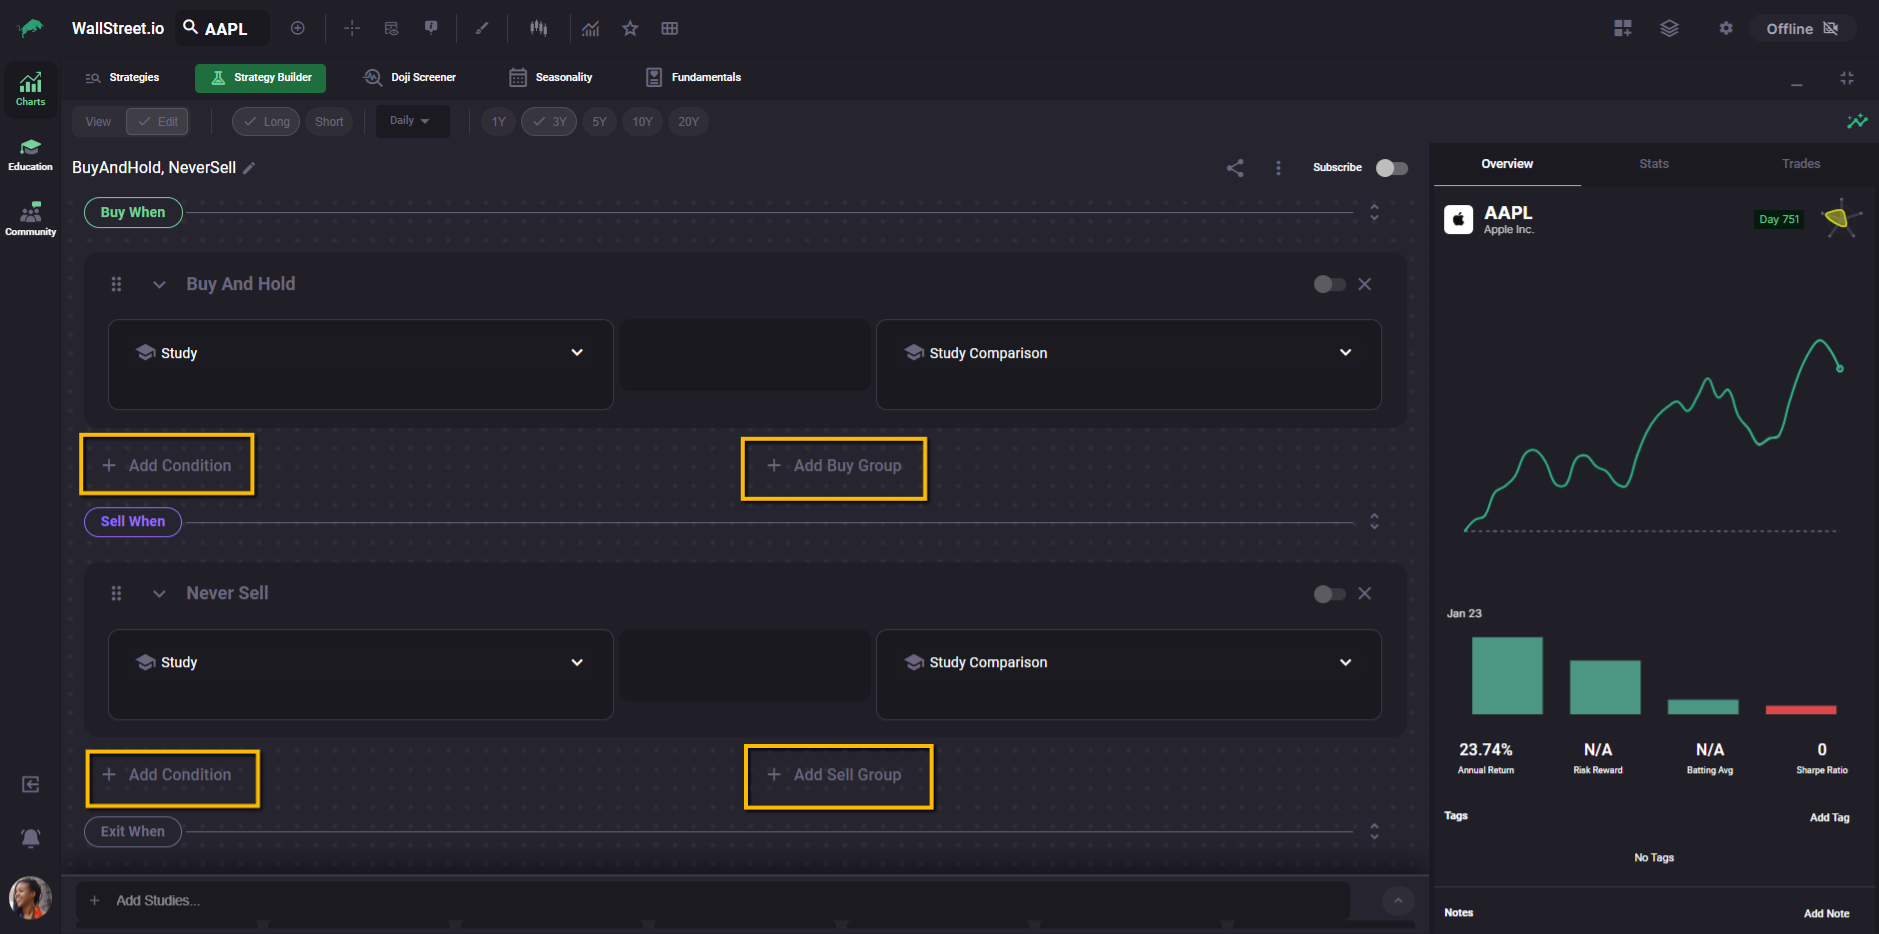
Default logic when the Strategy Builder is first loaded
When you open the Strategy Builder in Edit Mode and no custom logic has been defined yet, the builder does not start with empty logic blocks.
Instead, it loads a default placeholder strategy:
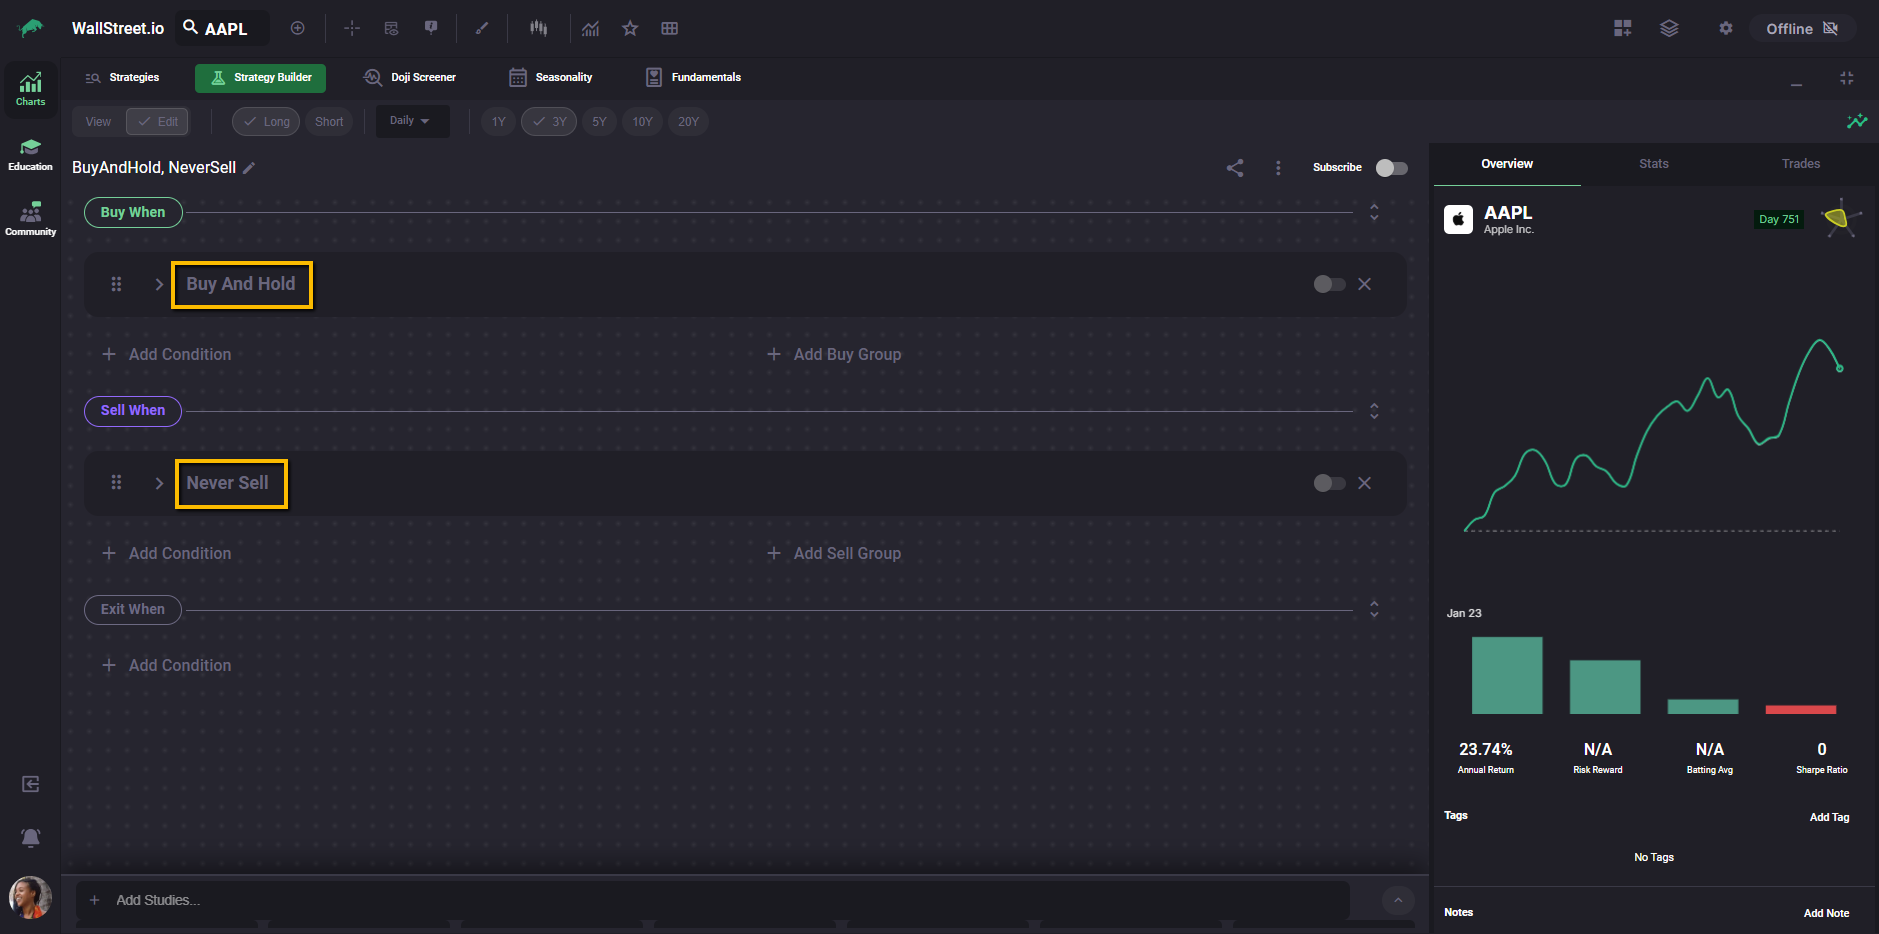
This default combination is why placeholder strategies across the platform are labeled BuyAndHold, NeverSell.
These defaults give you a starting strategy that is already defined, so the Strategy Builder is not in an empty state when you first open it. In practice, you may see the Strategy Stats panel populate with results immediately, even before you add or change any conditions.
Where to go next
This guide is designed to help you understand how the Strategy Builder is structured, how conditions are evaluated, and how to read what you’re building as logic instead of UI.
It does not try to tell you which strategies to build or which indicators to use. That part is intentionally left to more focused guides.
If you want to keep going, here are the most natural next steps:
Learn how Buy, Sell, and Exit rules are evaluated over time, how trade states change, and why a strategy can be Active, Ending, or Inactive on a given day.
Dive deeper into how each interaction behaves, when it triggers, and how small changes in interaction choice can dramatically affect trade timing and frequency.
Walk through practical examples of turning a market idea into a testable strategy, step by step, using real setups instead of abstract logic.
Once you’re comfortable with the structure, the Strategy Builder becomes less about clicking controls and more about expressing ideas clearly and testing them honestly.