Elder Impulse System
Definition
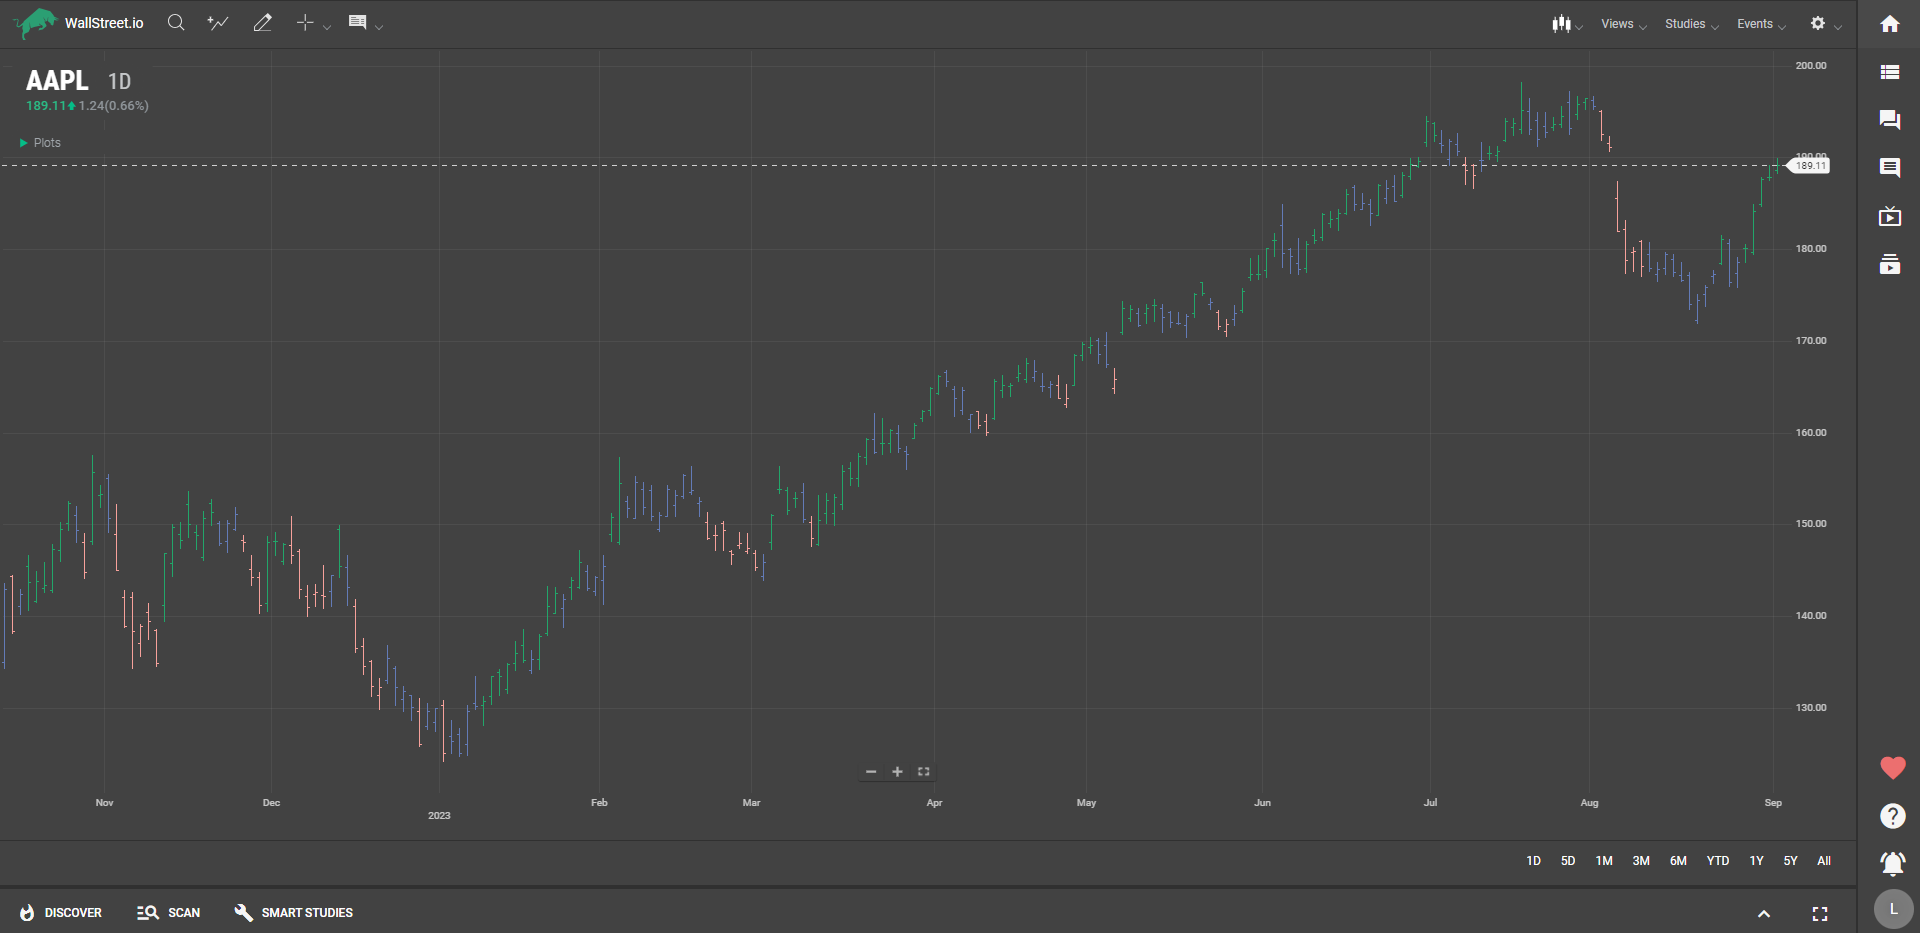
The Elder Impulse System (EIS) is a technical indicator that uses both an exponential moving average (EMA) and the MACD histogram to signal potential trading opportunities. The chart is colored to easily show bullish, bearish, or neutral conditions.

Suggested Trading Use
When you observe a series of green bars, it's a sign that the market is experiencing upward momentum according to both the EMA and MACD histogram. This could be a good point to consider entering or maintaining a long position.
Red bars, on the other hand, suggest that the market is in a downward phase as per both the EMA and MACD histogram. You might see this as a cue to consider entering a short position or to be cautious with existing long positions.
Blue bars indicate conflicting signals between the EMA and MACD histogram, suggesting a lack of a clear trend. In such conditions, you may want to hold off on making new trades until a clearer trend emerges.
Using the Elder Impulse System can help you quickly assess the market's current momentum and make trading decisions accordingly.

 Discover Tab Reference Guide
 Discover Tab How-To Guide
 Smart Studies How-To Guide
 Smart Studies Reference Guide
 Scan Tab Reference Guide
 Scan Tab How-To Guide
 Watchlists How-To guide
 Watchlists Reference Guide
 Chatrooms Reference Guide
 Community Wall How-To Guide
 Community Wall Reference Guide
 Streams Reference Guide
 Streams How-To Guide