GoNoGo - Trend
Definition
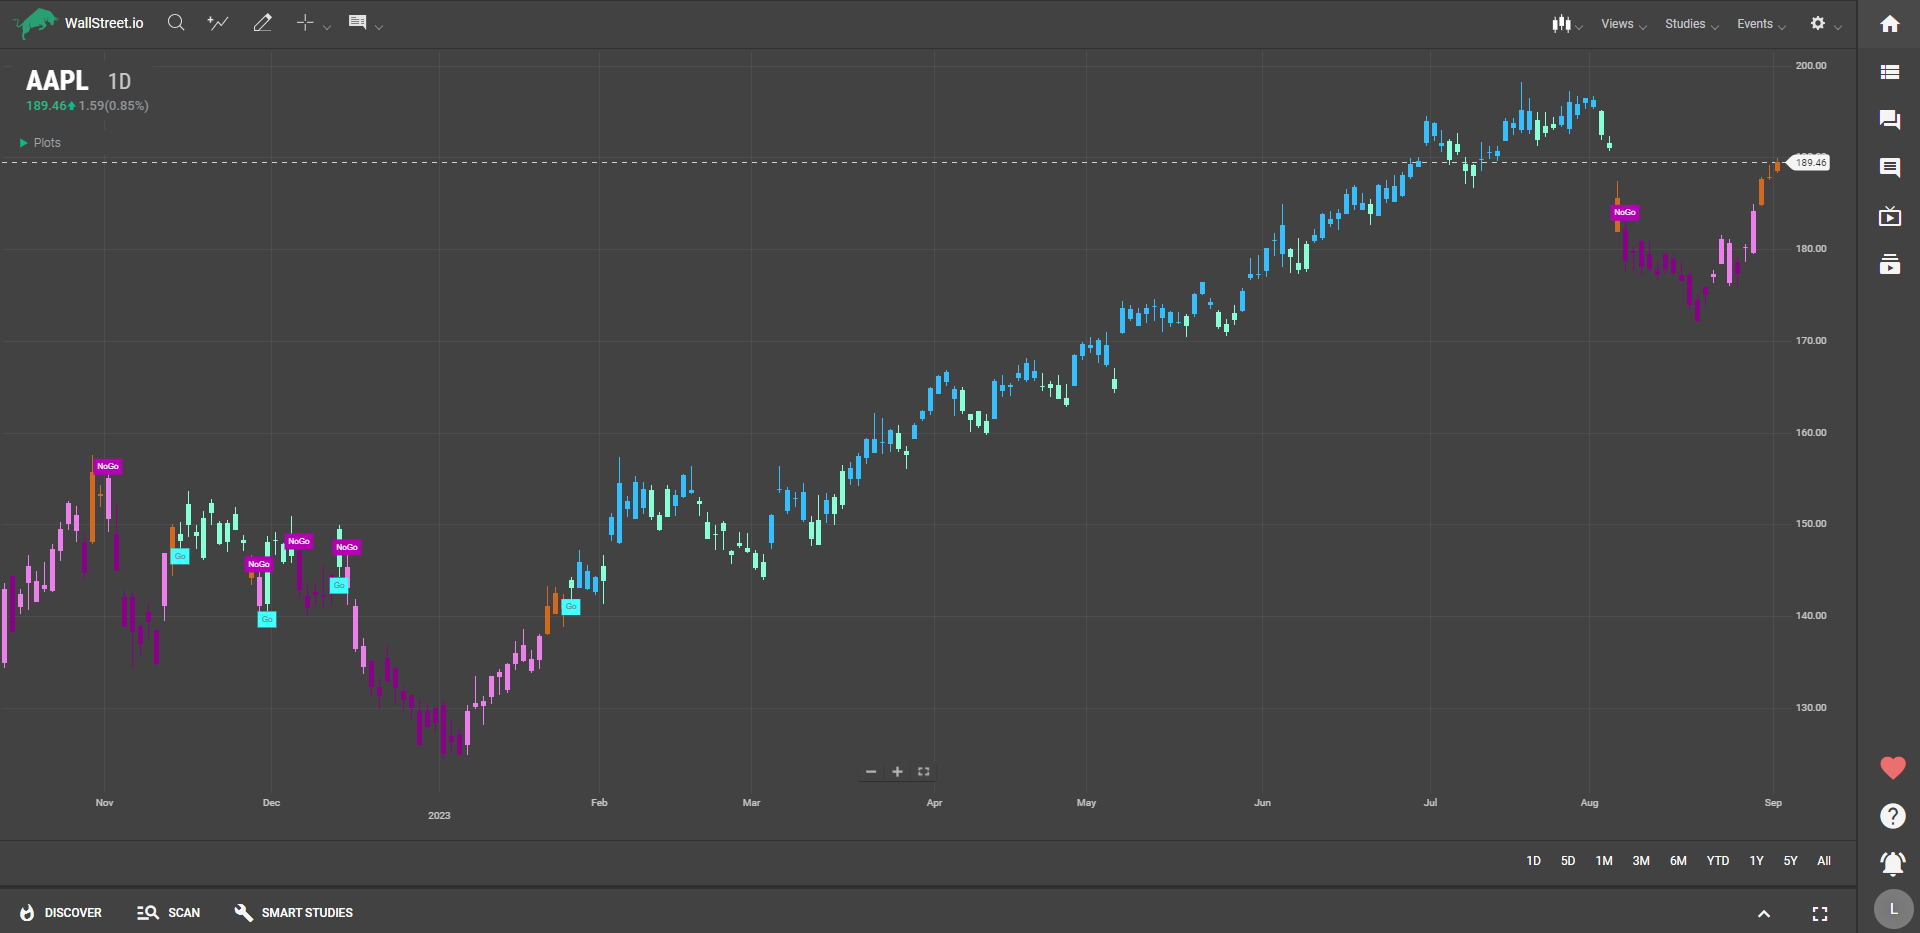
The GoNoGo - Trend study is a visual tool that colors the price bars of a security based on the strength of its current trend. This study aims to make it easy to identify the prevailing market trend at a glance. The color-coded bars range from bright blue, signaling a strong bullish trend, to dark purple, indicating an intensified bearish environment.
Suggested Trading Use
When you see bright blue bars, it suggests a strong bullish environment, making it a good time to consider entering long positions or holding onto existing ones. Aqua bars are slightly less bullish and often appear when a new upward trend is starting or a strong bullish trend begins to weaken—still a decent time to be long but be cautious.
Amber bars signal uncertainty in the market. This is often seen during a transition phase from a bull to a bear trend or vice versa. It's a period where you may want to adopt a wait-and-see approach before making any new trades.
Pink bars suggest a mildly bearish environment. If you're in a long position, these could serve as a warning to consider reducing exposure. For those inclined to short, pink bars may offer a low-risk entry point.
Dark purple bars represent a strong bearish trend. This is usually a signal to exit long positions or enter short trades if that aligns with your trading strategy.
By paying attention to these color cues, you can get a quick read on market trends and adjust your trading strategy accordingly.