Money Flow Index (MFI)
Definition
The Money Flow Index (MFI) is like a more advanced version of the Relative Strength Index (RSI), but it factors in trading volume. It calculates an oscillator value between 0 and 100 by taking the Typical Price (the average of the high, low, and close) and multiplying it by volume. This volume-weighted measure provides a nuanced view of market strength or weakness.
Suggested Trading Use
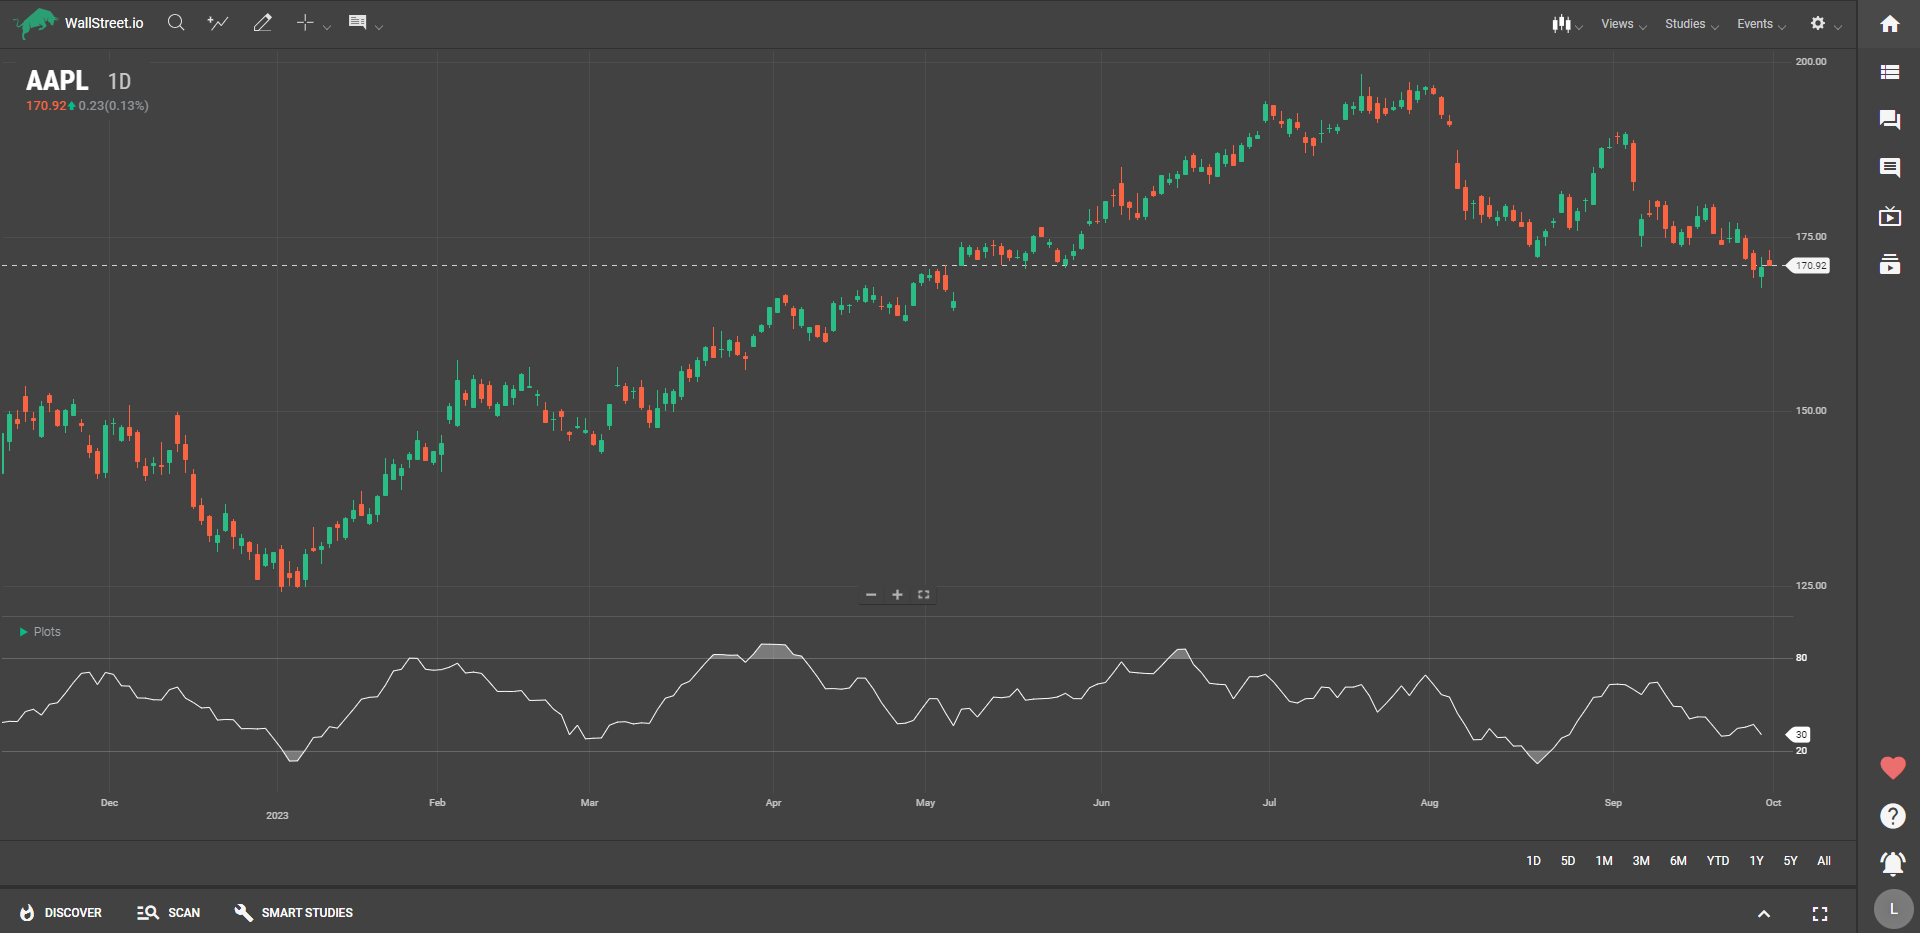
MFI can help you gauge the intensity behind price moves. When the indicator rises above 70, it often suggests that the asset is overbought, and you might consider taking profits or going short. Conversely, if the indicator falls below 30, the asset is likely oversold, and you might think about buying.
Keep an eye on divergences between MFI and price movement as well; they can signal impending trend reversals. Use this tool to better understand the force behind price changes and to identify potential turning points in the market.