Strategy Logic Guide
What this helps you do
This guide helps you understand how strategies decide when to enter and when to exit a trade. By breaking down Buy and Sell logic into simple True or False conditions, you’ll be able to read any strategy with confidence, understand why a trade is Active, Ending, or Inactive, and troubleshoot your own logic when building custom strategies.
It gives you a clear mental model for how indicators combine into rules, how rule groups work, and how the platform evaluates those rules bar by bar.
What a strategy really is
You can think of a strategy as a simple rule set that asks a yes or no question about price behavior.
In the background, the Strategy Builder is looking at past data and answering questions like:
“When A happens, how often does B happen afterward, and with what risk and reward?”
On the chart, that logic shows up as conditions that can be either True or False on any given bar. Those conditions are built from indicators you already know, such as MACD, Heikin Ashi candles, RSI, moving averages, and others.
This guide explains how those conditions combine into Buy and Sell logic, and how that logic becomes the trade stages you see on the platform.
Single conditions
In the following diagram, you see the simplest possible case: one condition built from one indicator.
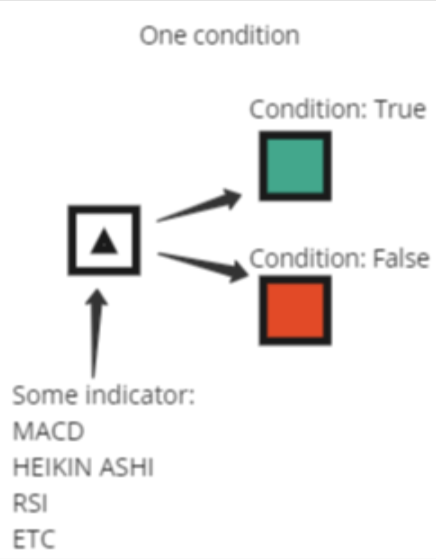
Examples of single conditions:
For each bar, that condition is evaluated and can only be in one of two states:
When a strategy uses a single condition as its Buy or Sell trigger, the logic is direct:
Groups of conditions (”AND” logic)
Most strategies are built from groups of conditions, not just a single one. This lets you combine several indicators so that a trade only triggers when multiple things line up at the same time.
Examples of grouped Buy conditions:
Inside a group like this, the logic is:
This is standard AND logic.
The following diagram is basically showing:
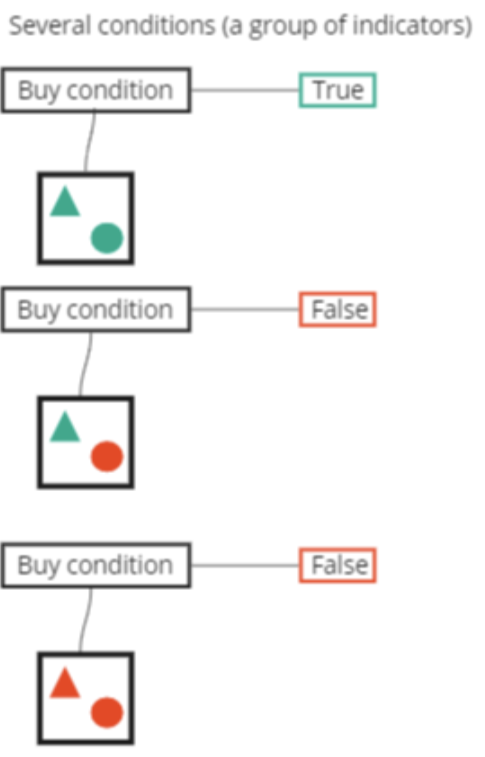
You can read this as:
“Only enter when all of my checklist items are checked.”
Either/or logic (OR between groups)
Sometimes you want more than one way for a trade to qualify. For example, maybe you are willing to buy either on a breakout or on a pullback.
To model that, a strategy can use separate groups of conditions that are linked with an OR.
Think of it as:
Each group can have its own internal “AND” logic, just like in the previous section. The difference is in how the top level decides whether the Buy or Sell condition is True.
For a Buy or Sell condition built from several groups with OR logic:
That is what the following diagram represents:
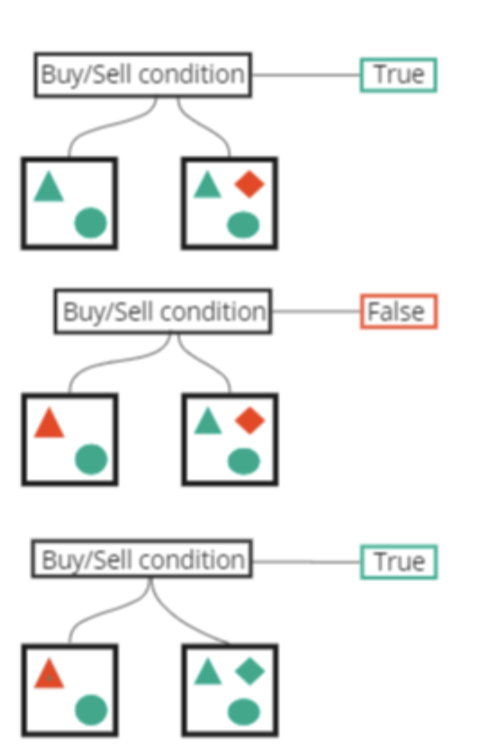
You can read this as:
“Enter the trade if this set of rules is met, or if that alternative set of rules is met.”
How Buy and Sell conditions work together
So far, everything has been about one side of the trade at a time. In a real strategy, you always have both:
On every bar, the platform evaluates:
Those two answers combine into the trade state. This is what the following diagram shows:
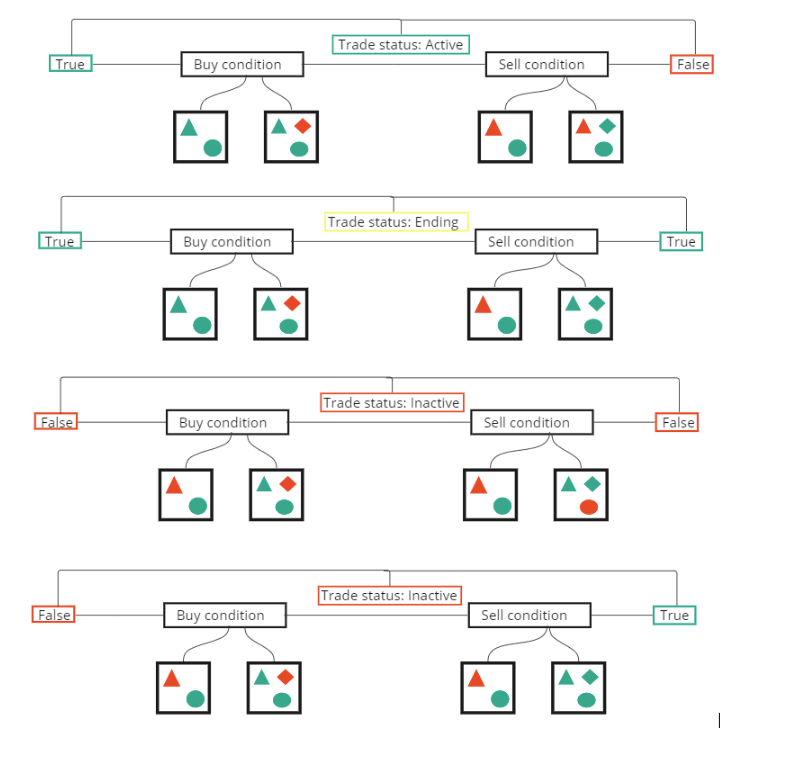
For long strategies, you can read the logic like this:
Trade status: Active
The entry rules are satisfied and the exit rules are not. The strategy considers the long trade currently on.
Trade status: Ending
The entry rules are still satisfied, but the exit rules have also turned True. This marks the bar where the trade is closing. In practice you treat this as the last bar of the trade.
Trade status: Inactive (no position)
This can happen in two ways:
Neither your entry rules nor your exit rules are satisfied. There is no open position and nothing special is happening.
The exit rules are satisfied but the entry rules are not. For a long strategy, this still counts as “no trade on.” It simply means your selling conditions are present without an active long position.
The key point is that a long trade is only considered active when the Buy condition is True and the Sell condition is False. Every other combination is treated as “not in a trade” on that bar.
For short strategies, you invert the meaning:
The True or False logic works the same way. The only difference is the direction of the trade.
How this connects to strategy stages on the platform
When you subscribe to a strategy on Wallstreet.io, you see stages such as Starting, Active, Ending, and Inactive in the Strategy Notifications, in the Strategies scan results, and in the View Stats panel.
Behind the scenes, those stages come directly from the logic you just saw.
You can read them like this:
This is the first bar where the strategy detects a new trade. Buy is True and Sell is False, and there was no active position on the previous bar. It marks the beginning of a new sequence of Active bars.
The trade is on and the entry rules remain satisfied. Buy is True and Sell is False, and the strategy is counting how many bars the trade has been open.
This is the bar where the Sell logic turns True while the strategy still has an open trade. It is the closing bar for that trade.
There is no position on. Either the entry rules are not met, the exit rules have already been processed, or both.
Once you understand how the True and False states combine, these stages stop feeling mysterious. You can always trace them back to:
How to reason about a strategy you are reviewing
When you are reviewing a pre-built strategy or one you built yourself, it helps to walk through the logic in plain language.
For example, reviewing the strategy below you might say:
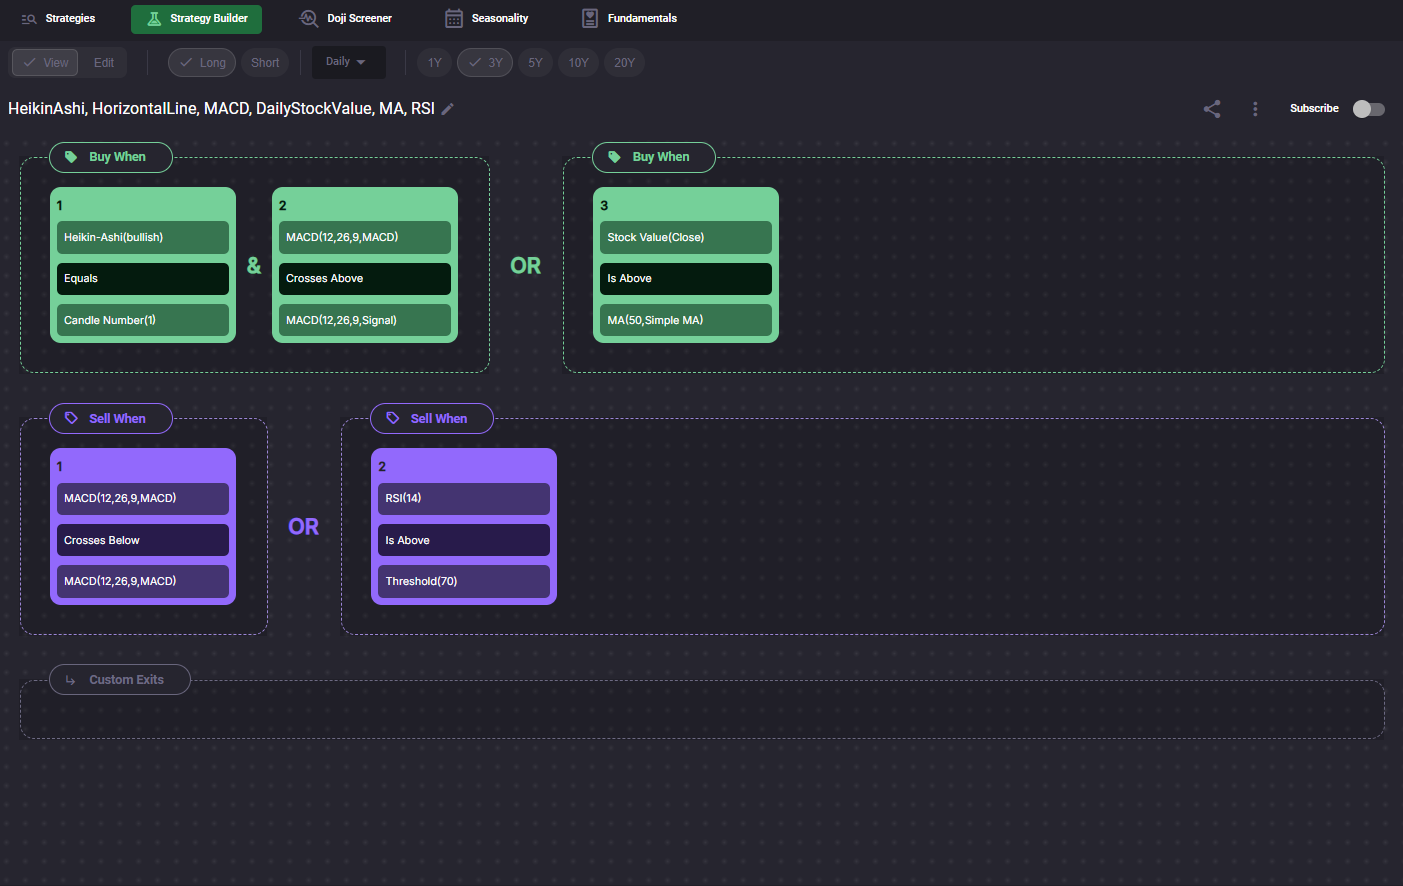
Then you can mentally map that explanation to the diagrams:
This way, you can read strategy logic as a checklist instead of a tangle of indicators.