Market Facilitation Index
Definition
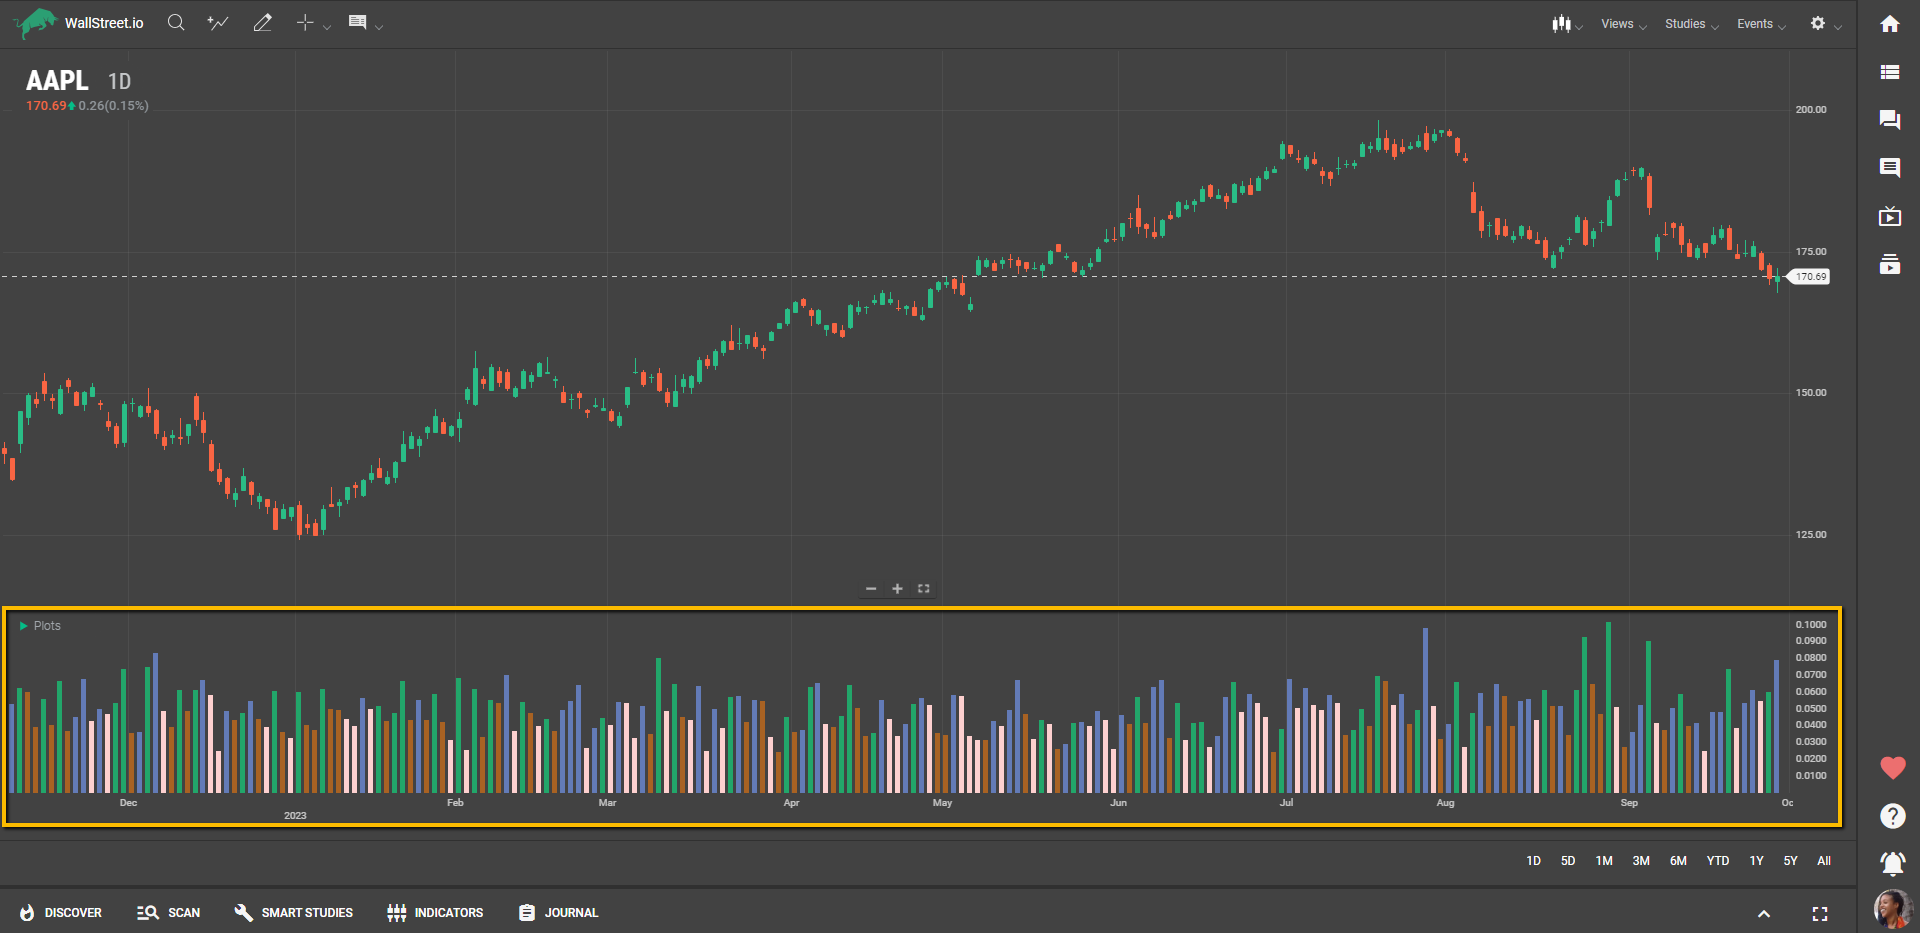
The Market Facilitation Index (MFI) is a histogram-based study that offers a unique perspective on how volume impacts price. Unlike many other indicators, MFI doesn't focus on direction but rather on the relationship between price range and volume. The index measures whether the volume is effective in driving the price movement. Through a color-coded histogram, the MFI categorizes market conditions into four states: Green, Fade (Brown), Fake (Blue), and Squat (Pink).
Suggested Trading Use
You'll find the MFI especially useful for gauging the quality of price action in real-time. When the histogram is Green, it indicates that both volume and momentum are on the rise, a favorable condition for trend followers. A Brown bar signifies fading momentum, advising you to tread carefully. Blue suggests caution, as it indicates a mismatch between volume and price change, often seen as market uncertainty. Lastly, Pink indicates a struggle between buyers and sellers, and you may want to wait for a clearer direction to emerge.
By paying close attention to these color codes, you can get a sense of the market’s underlying dynamics and adjust your strategies accordingly. MFI helps you understand how effectively the market is responding to volume, giving you an edge in crafting responsive and agile trading tactics.