Price Alerts Complete Guide
What this helps you do
This guide helps you use Price Alerts to keep track of key price levels without babysitting a chart. You will learn where to find the Alerts panel, how to create and manage alerts (including One-Click Doji Price Alerts), and how the Alert Logs work.
This matters because you can stay on top of important price moves without constantly watching the market, so you act when it counts instead of reacting late.
What Price Alerts are
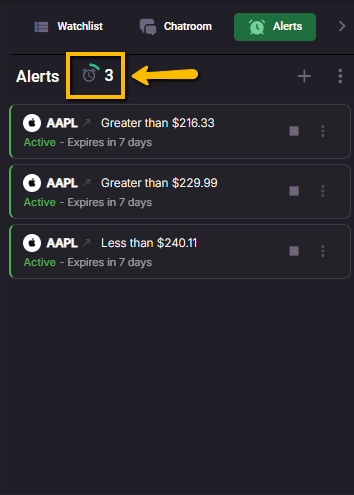
A Price Alert notifies you when a symbol hits a price level you set, using a condition like Greater than or Less than. Alerts can be created manually from the Alerts panel, created directly from the chart, or generated automatically as One-Click Doji Price Alerts from the Doji Screener. All alert types appear in the same Alerts list.
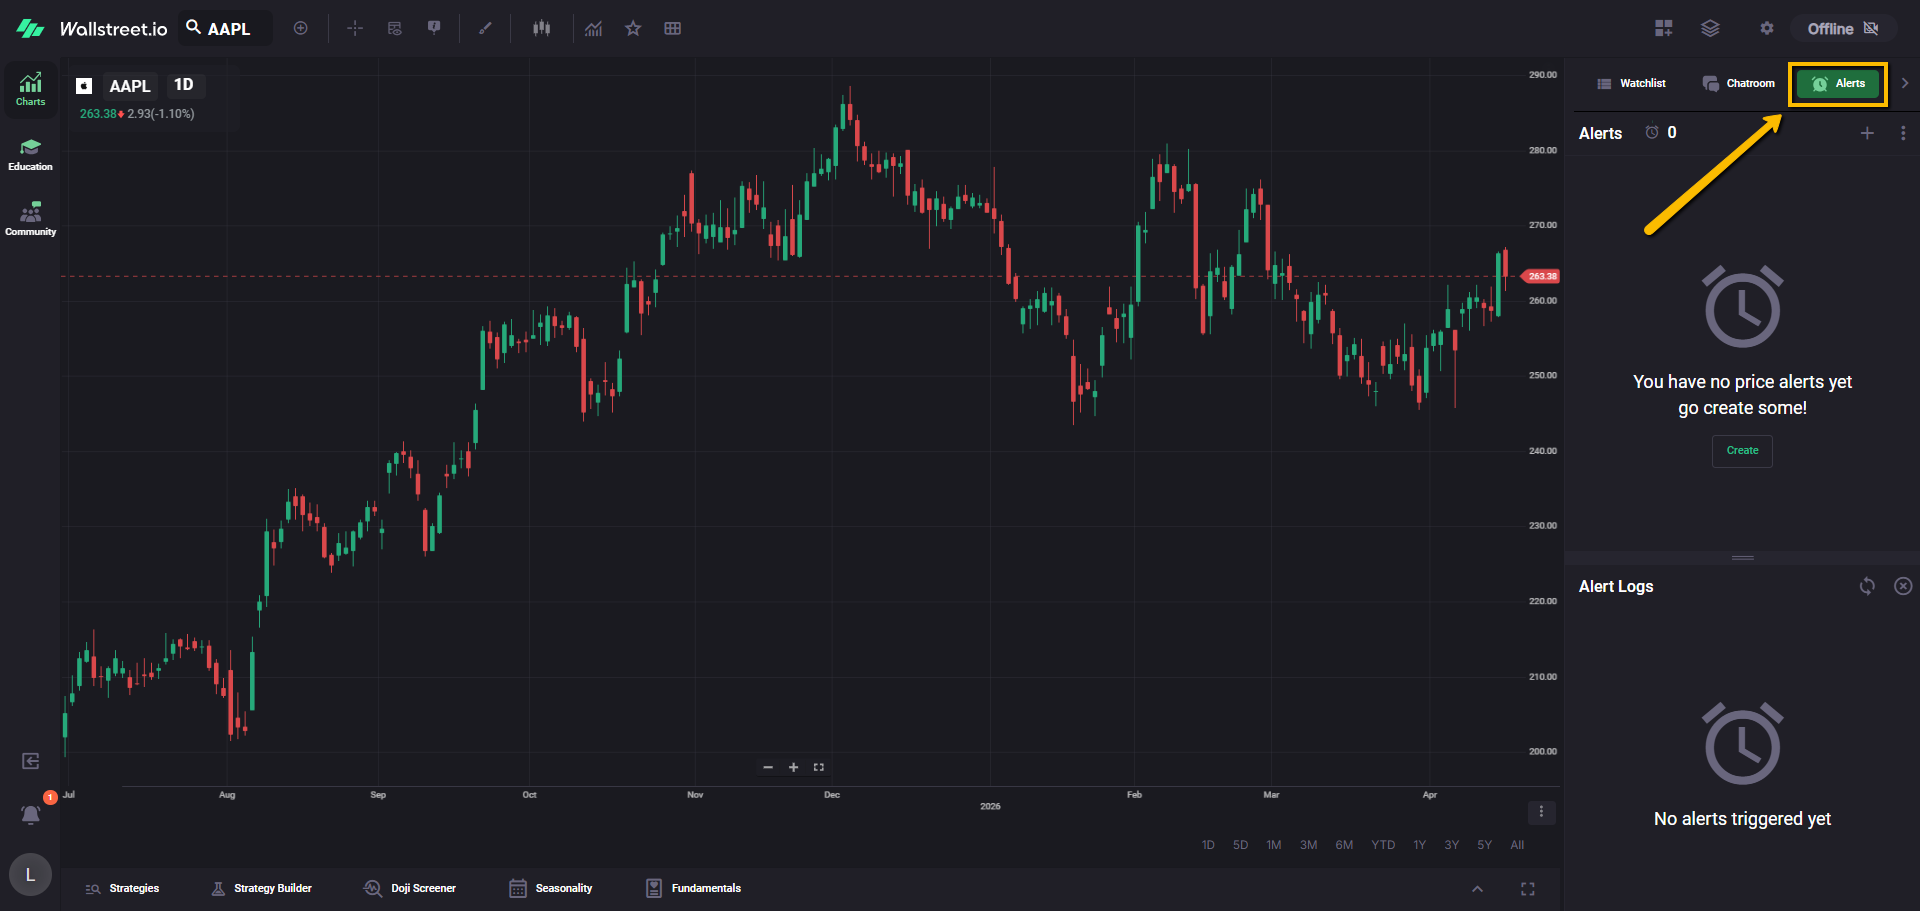
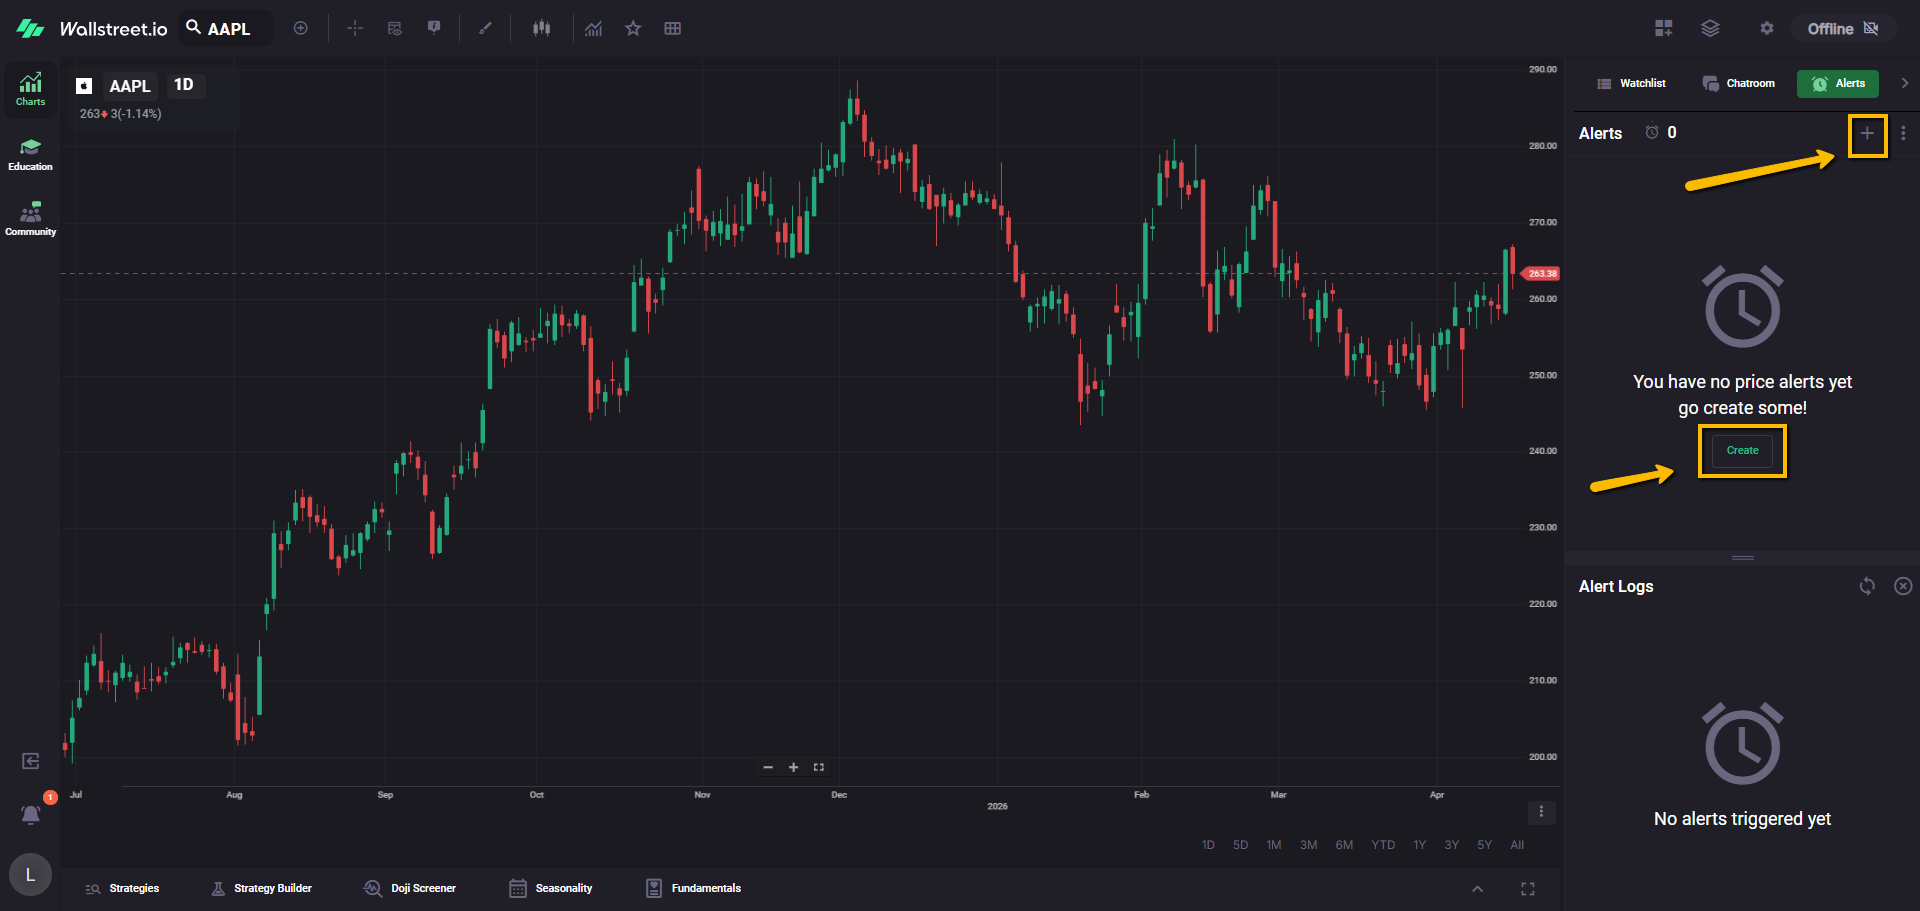
Where to find the Alerts panel
Open the Alerts panel from the right-side workspace tools area, then click the Alerts tab (next to Watchlist and Chatroom).
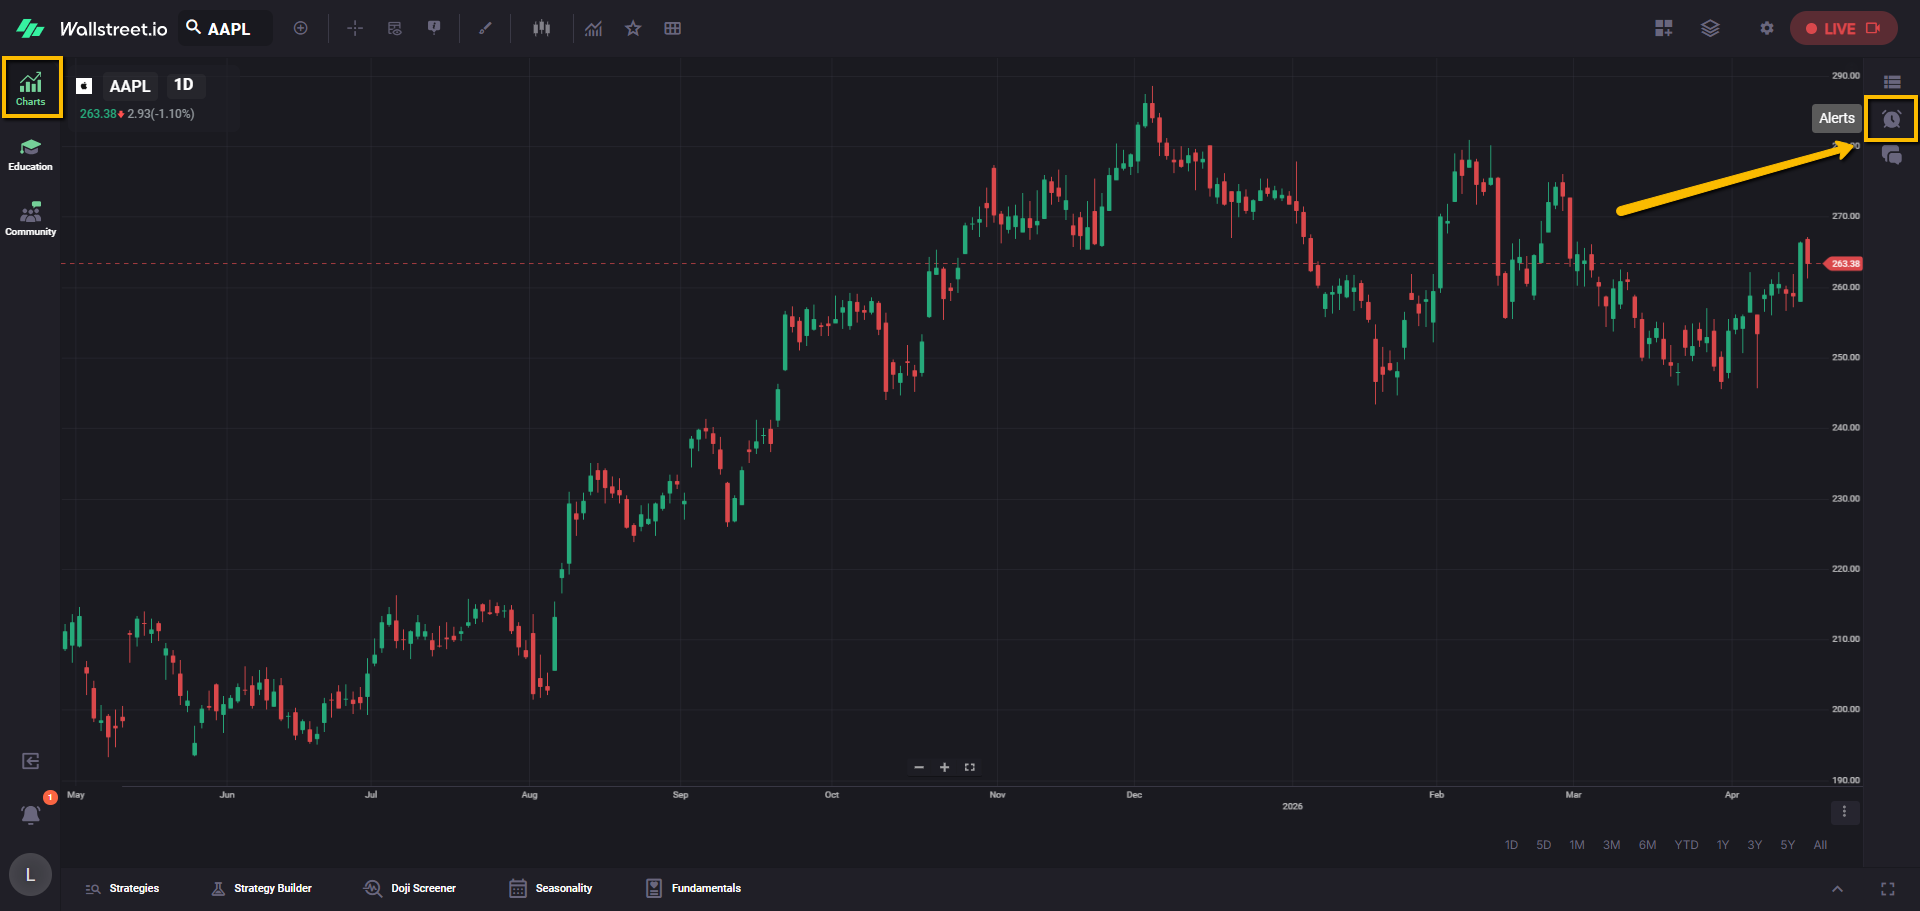
The panel has two main sections:
Ways to create a Price Alert
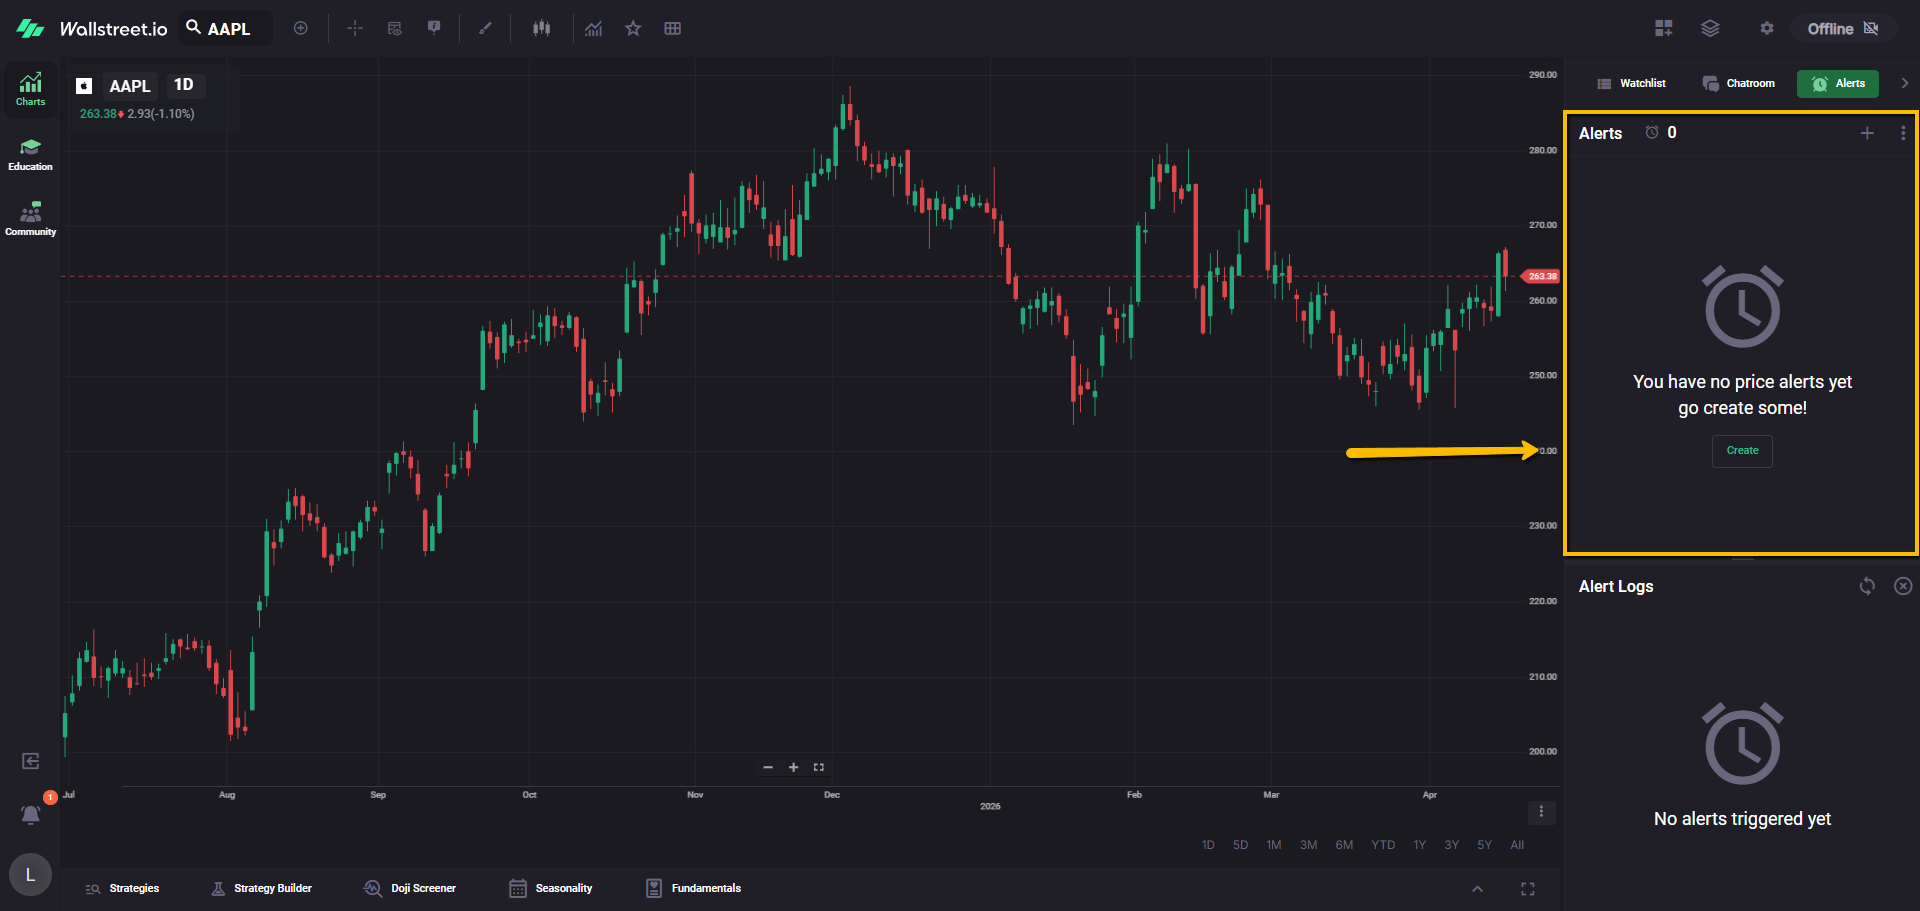
Create an alert from the Alerts panel
Alerts can be created by clicking the plus icon at the top-right of the Alerts section, or clicking on “Create” button at the center of an empty panel.
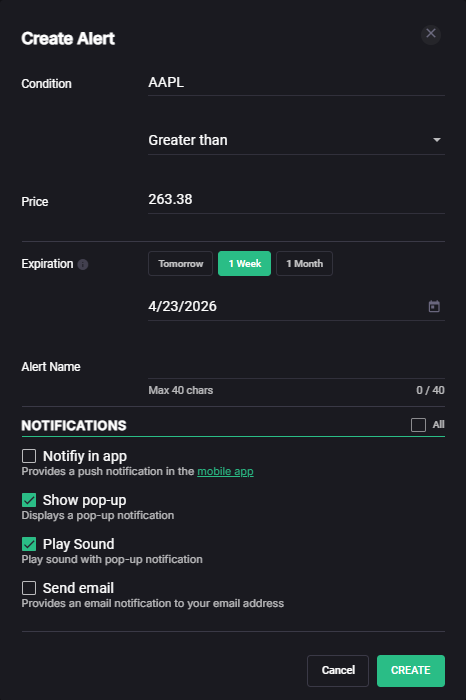
This opens the Create Alert window, where you configure:
In the Create Alert window, you can also select one or more notification options:
Clicking Create will save these changes.
Create an alert from the chart (right click)
You can also create a Price Alert directly from the chart.
Right click on the chart at a price level, then choose the option to create a Price Alert.
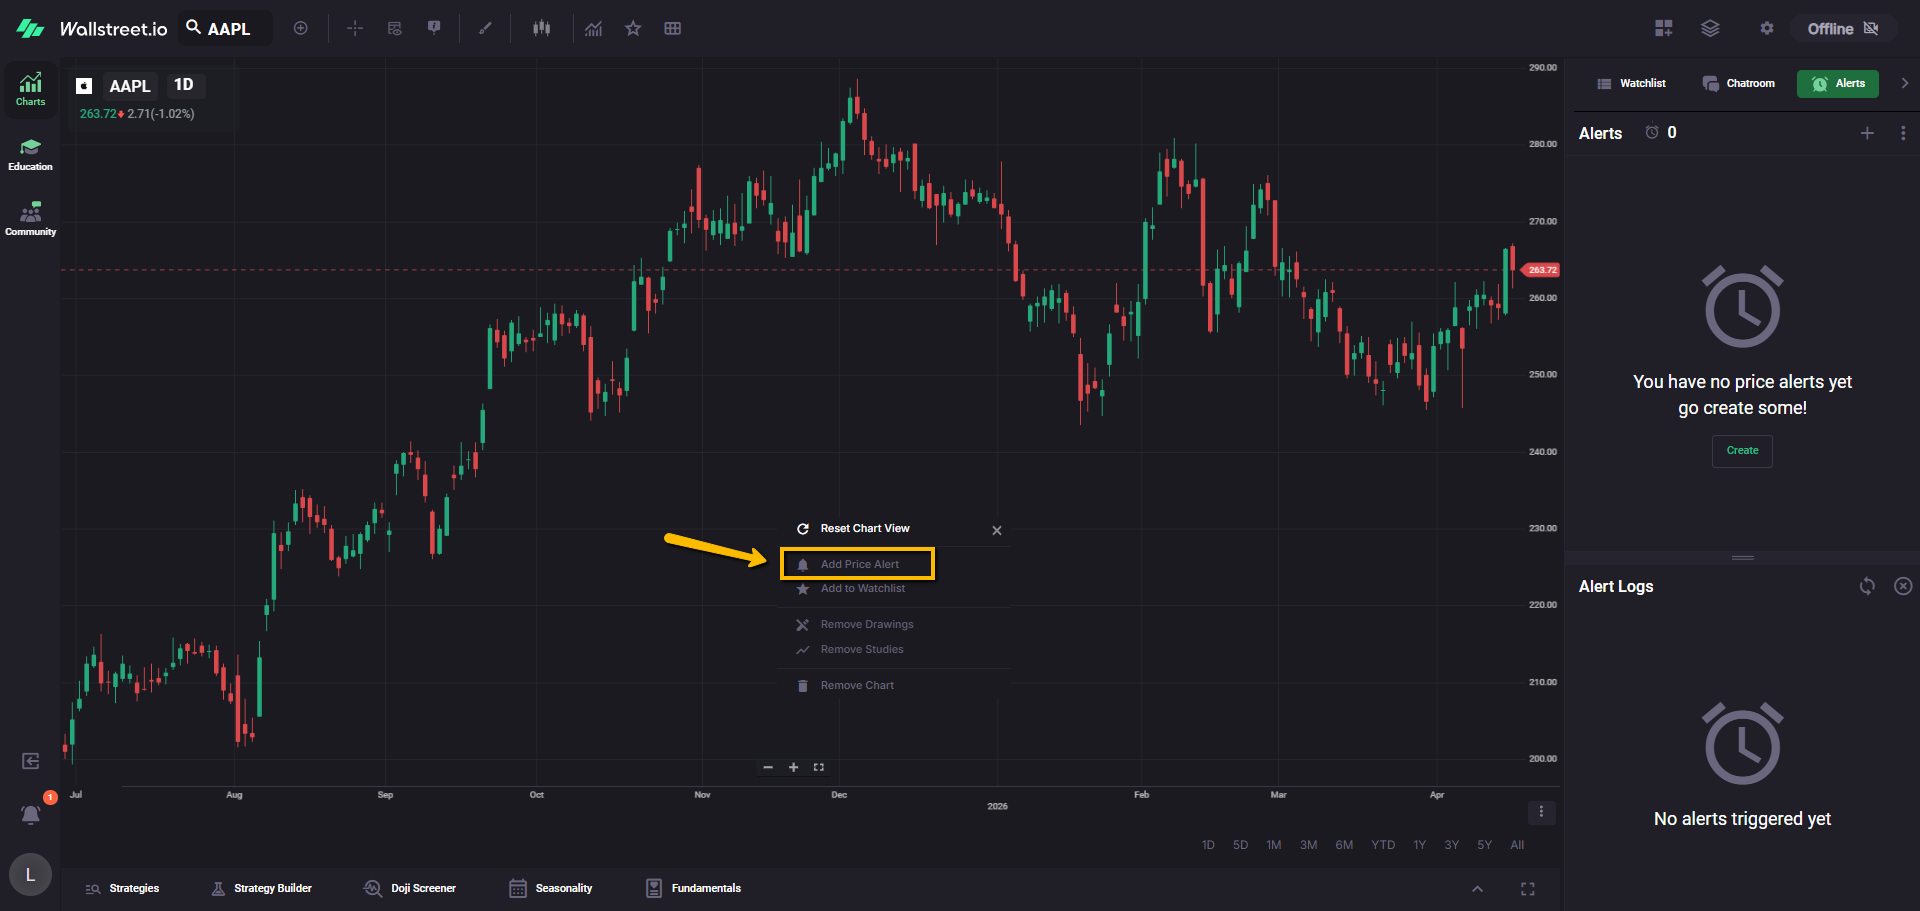
The platform opens the Create Alert flow using that chart level as your starting point, so you can confirm the condition, expiration, and notifications before creating it.
Create One-Click Doji Price Alerts
One-Click Doji Price Alerts are created in the Doji Screener, but they appear and are managed in the same Alerts panel as your regular alerts.
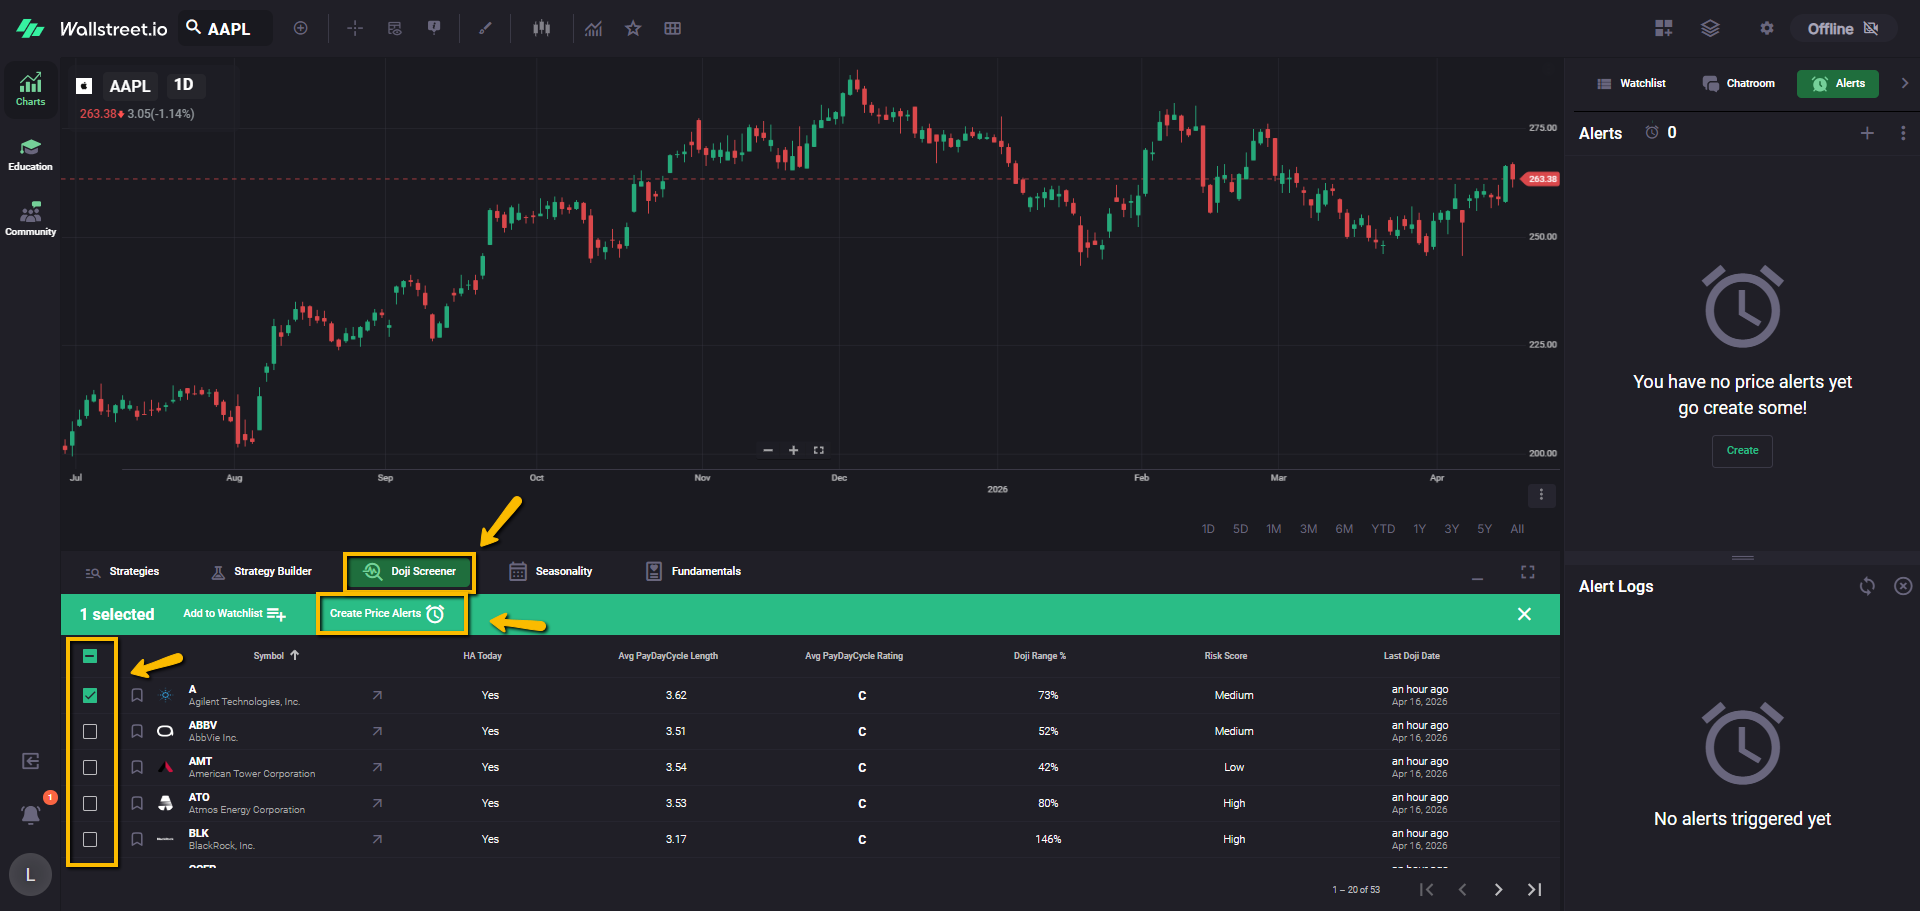
When you create a Doji alert for a symbol, the system allows you to create one single alert or two parallel alerts:
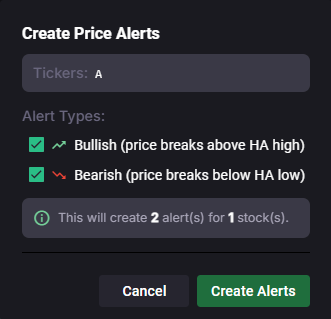
Expiration matches the Doji timeframe:
Default notifications for One-Click Doji alerts are created with email, mobile push, and in-app pop-up enabled, with sound off by default.
How alerts appear on the chart
Alert lines
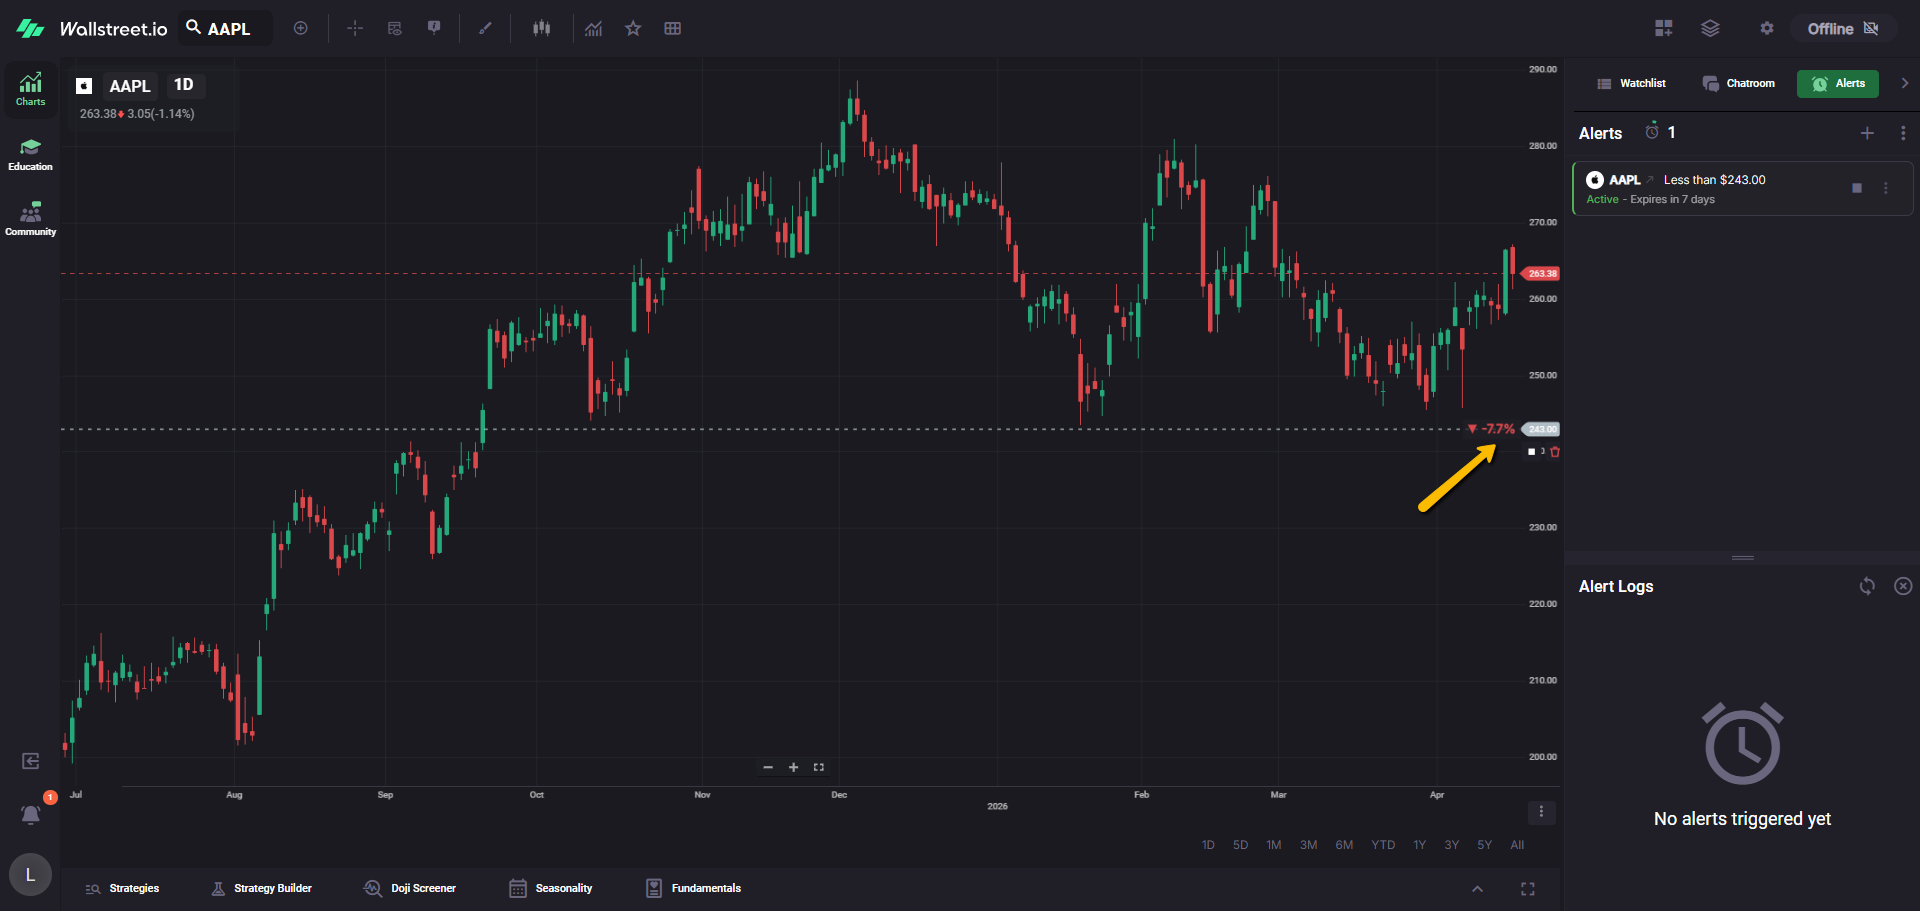
When an alert is active, the platform can display a horizontal alert line on the chart at the alert’s price level. This makes it easy to confirm where your alert sits without opening the Create Alert window again.
Hover details and quick actions
When you hover over an alert line, the chart can display quick details like the alert price and percent distance, plus quick action icons such as Stop and Delete.
Drag to adjust the alert price
You can drag an alert line up or down on the chart to change the alert’s price level.
The platform automatically updates the alert condition to match where the line sits relative to the current price. If you drag the line above current price, the condition updates to Greater than. If you drag it below current price, it updates to Less than.
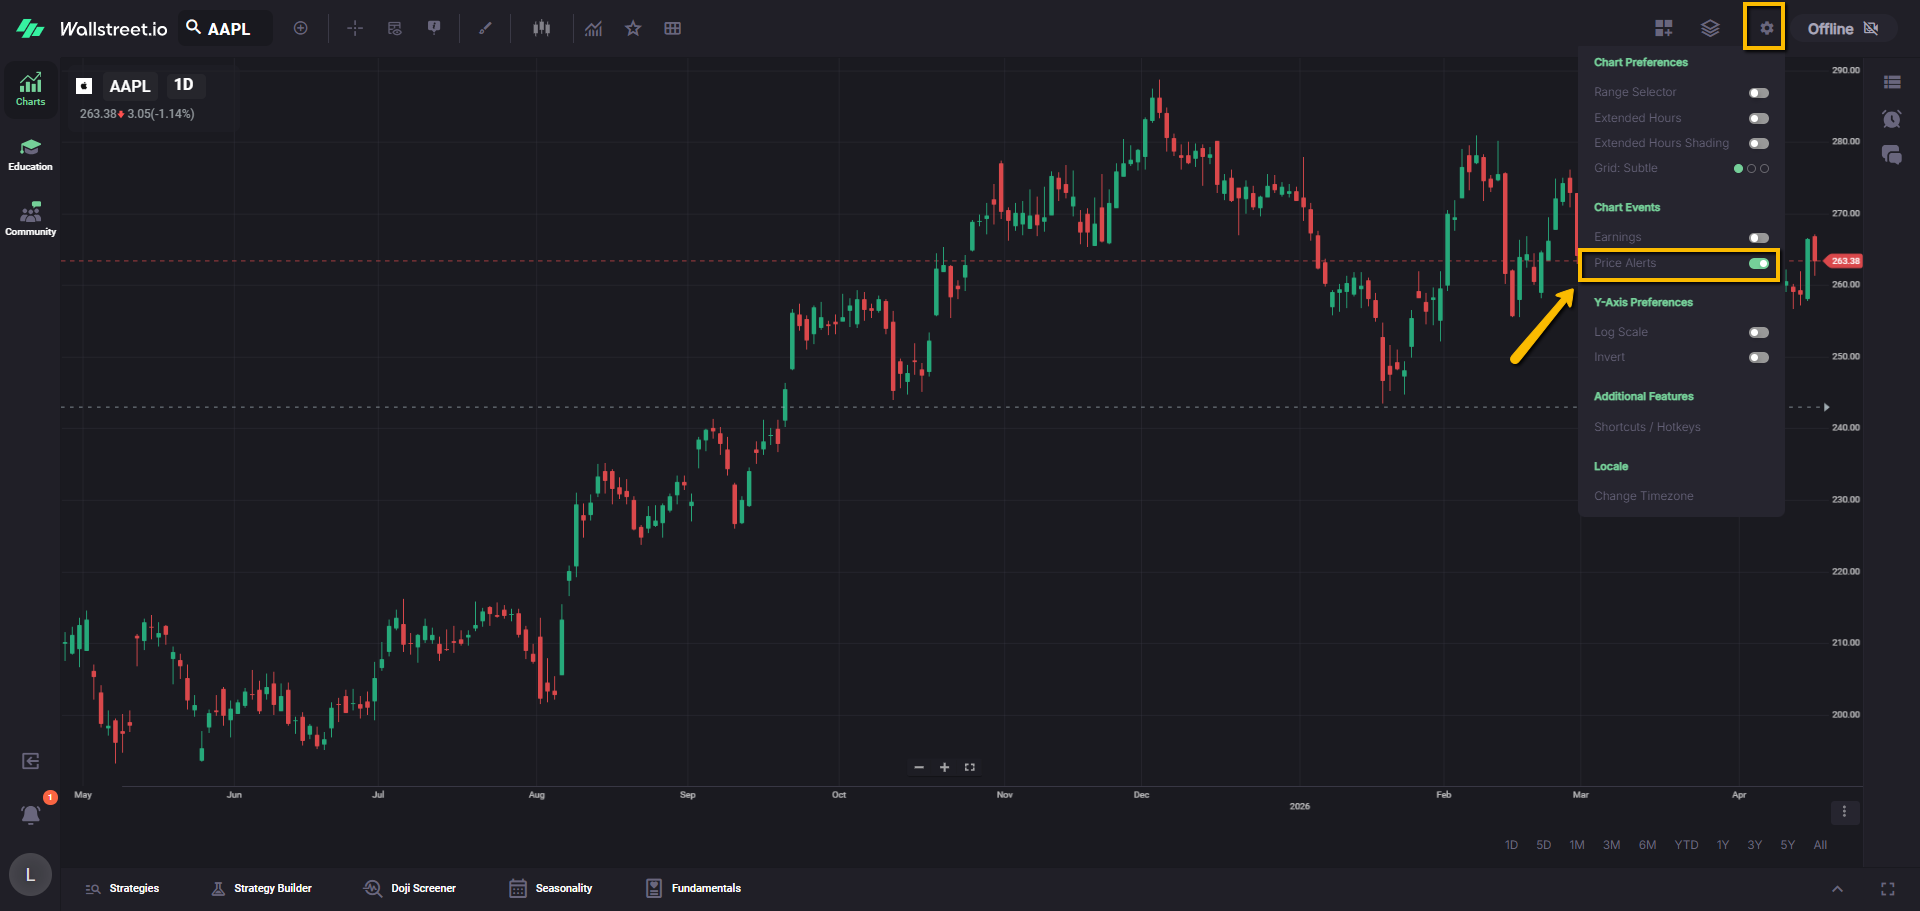
Turn alert lines on or off
Alert visuals on the chart are enabled by default, but you can turn them off from the Chart Settings menu if you prefer a cleaner chart.
Understand the Alerts list
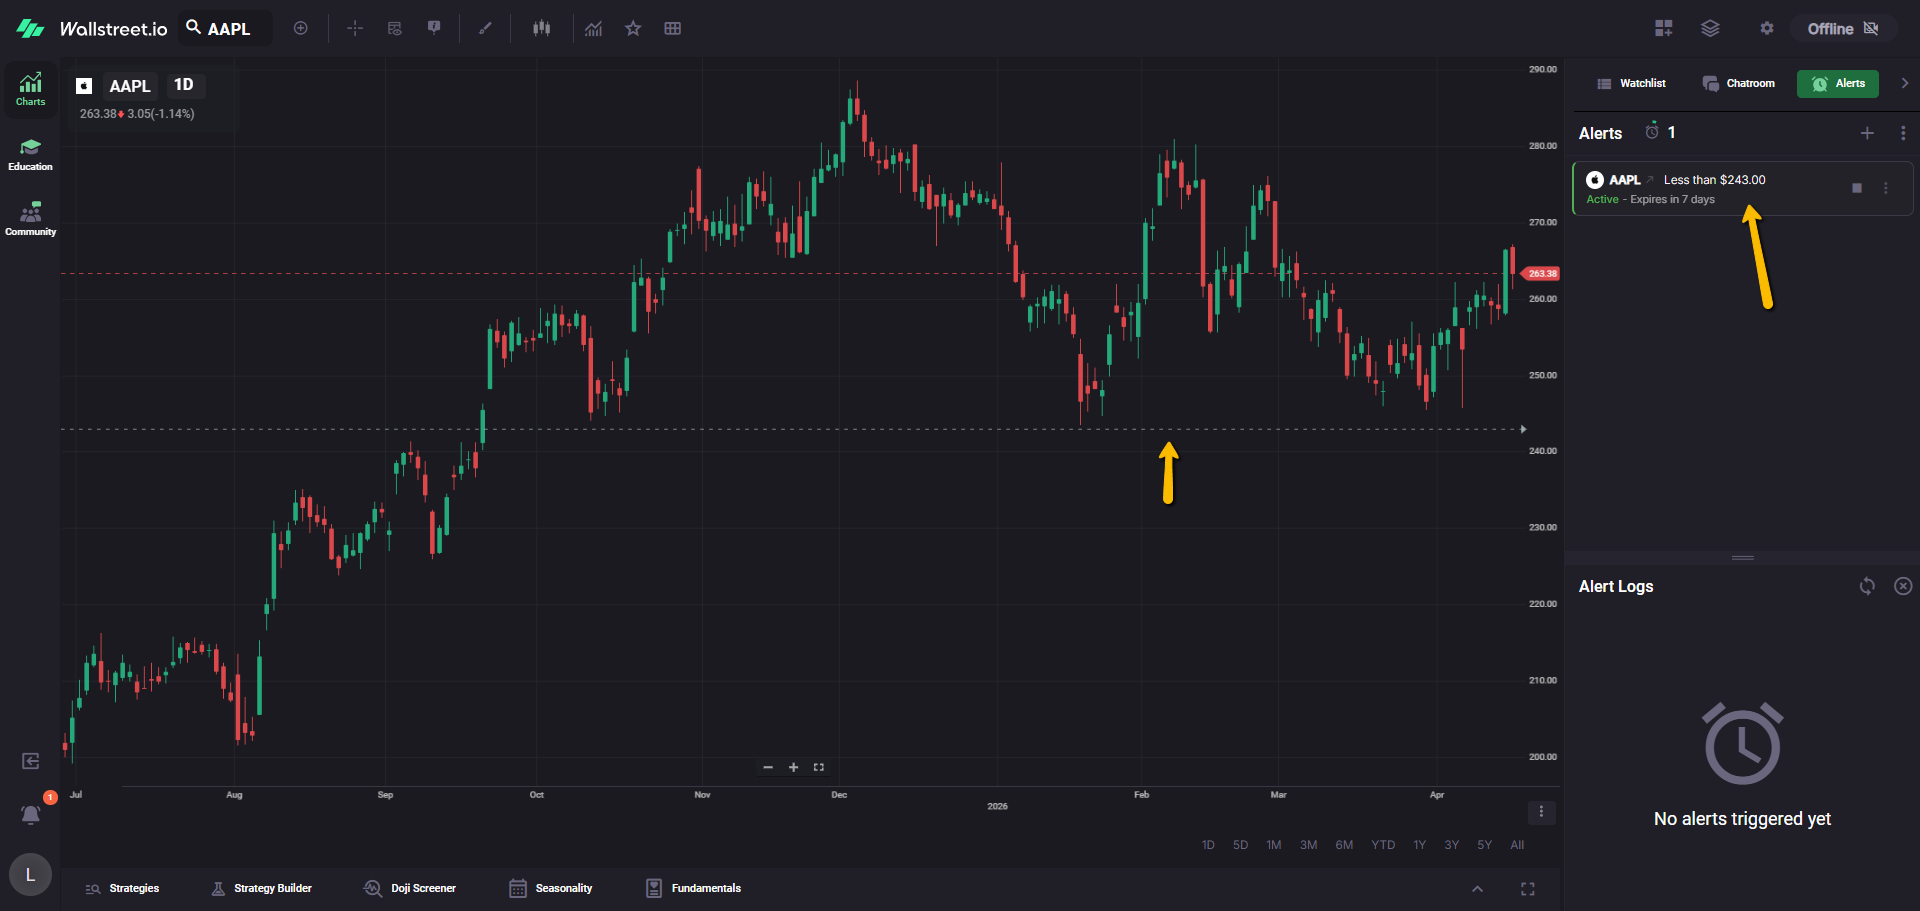
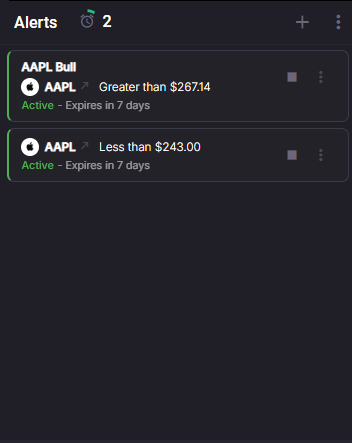
Each alert row shows the essentials at a glance:
On the right side of each alert, you will also see quick controls (such as stop and start), plus a three-dot menu for additional options.
Link between the list and the chart
Alerts stay visually connected across the panel and the chart:
This helps you quickly confirm which alert is which, especially when multiple alerts are close together.
Alert statuses
Alerts can appear in different states:
Reactivating older alerts
When you reactivate an older alert, the platform automatically updates the expiration to one week from today.
Watchlist alert indicators
In Watchlists, symbols can show an alert indicator so you can see how many alerts are active for that ticker at a glance.
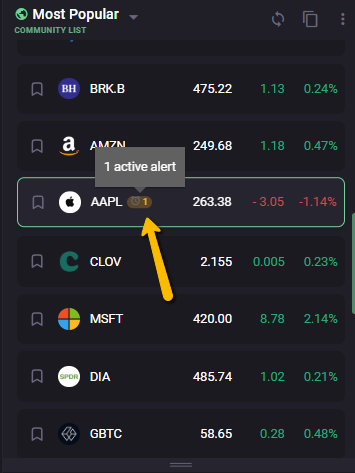
You can also use the alert indicator as a shortcut. Clicking it opens the Alerts panel already filtered to that symbol, so you only see the alerts tied to that ticker.
Sort and filter what you see
Use the three-dot menu at the top-right of the Alerts section to control what is displayed.
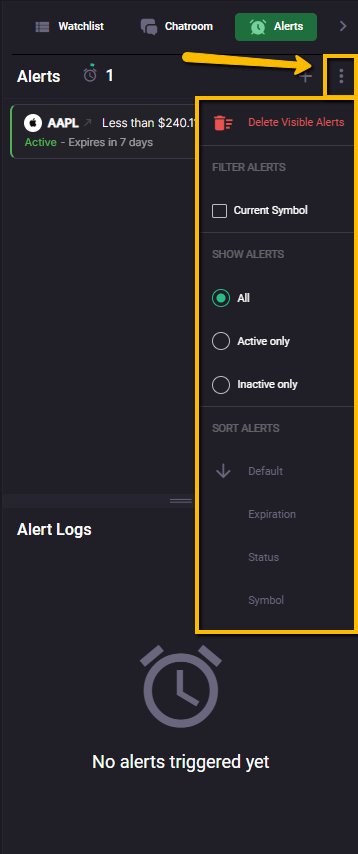
Delete visible alerts
Removes all alerts currently shown in the list. This respects any filters you have applied, so only the visible alerts are affected.
Filter alerts
Current Symbol
Limits the list to alerts related to the symbol currently loaded on your chart. This is useful when you want to focus on one ticker at a time.
Show alerts
Sort alerts
You can change how alerts are ordered in the list:
Alert limits
Price Alerts have a limit. The UI shows an indicator near the Alerts header (a count next to the clock icon, and a ring indicator) to help you track how close you are to the cap.
If you hit the limit while creating alerts (including Doji alerts, which create two at once), you will see a notice and will need to delete older alerts to free up space.
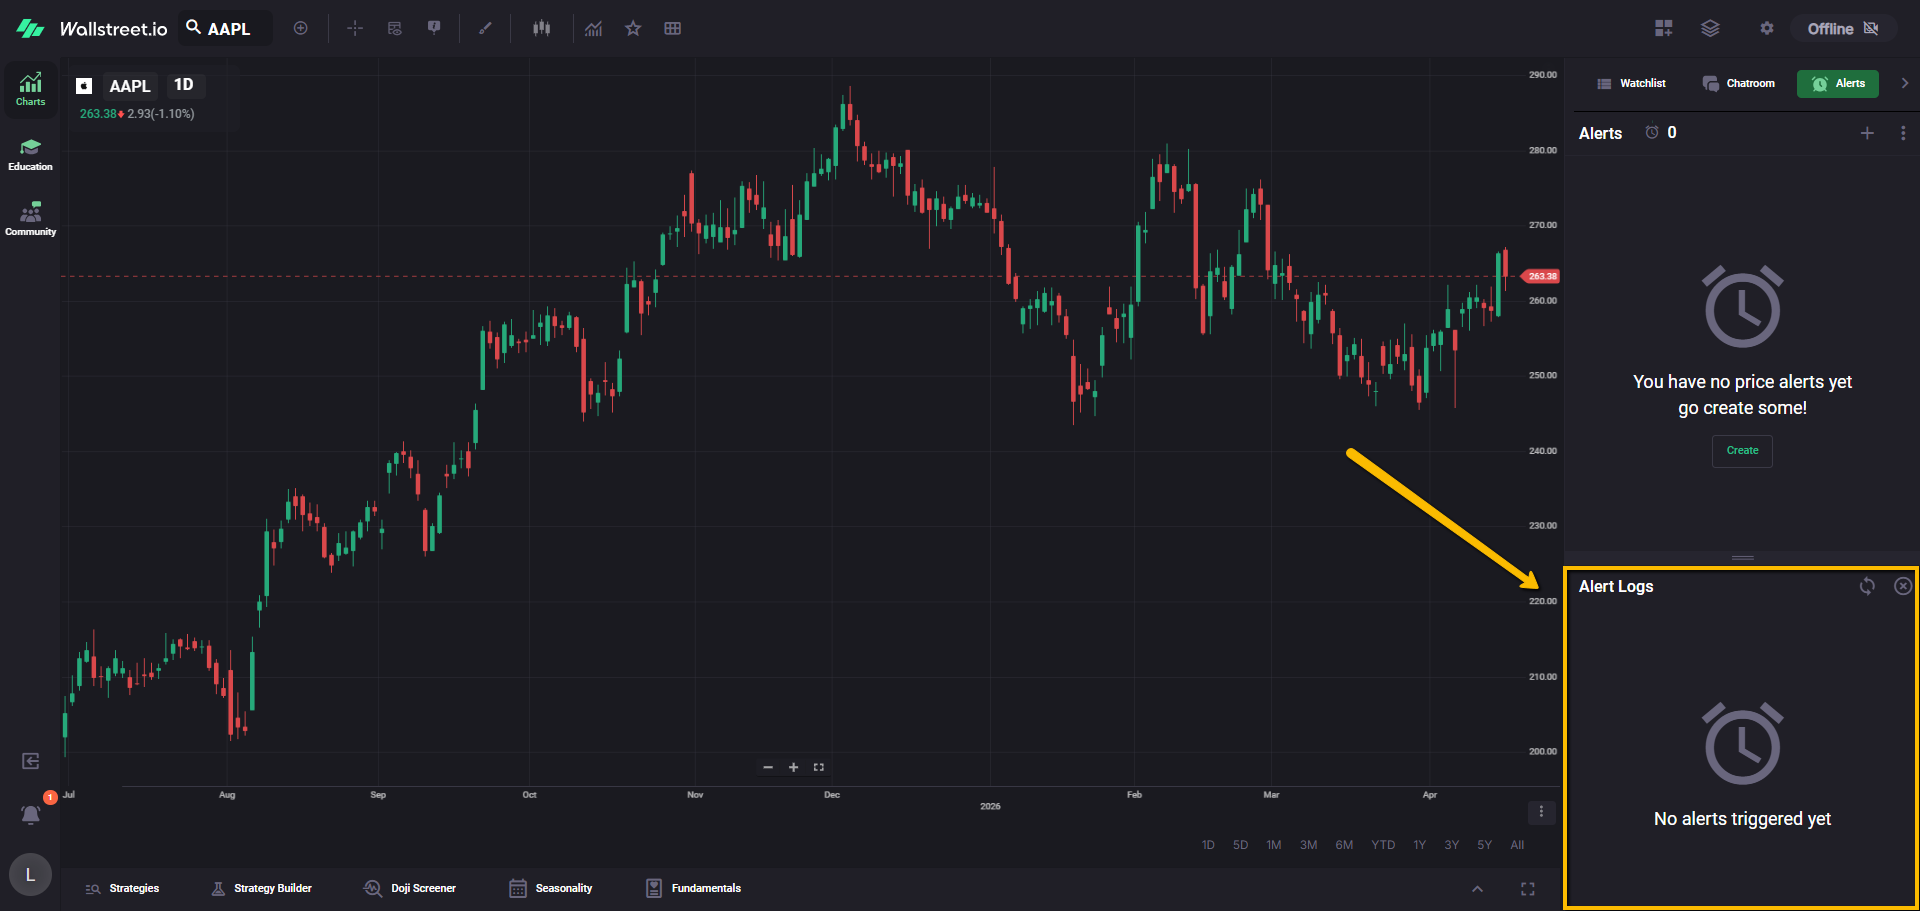
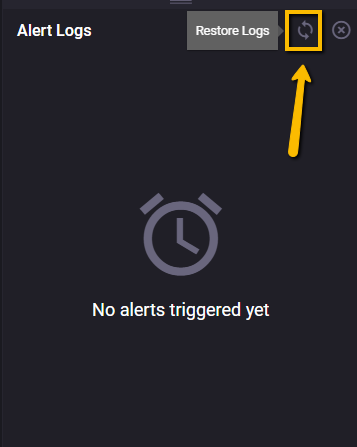
Alert Logs
Alert Logs is the history area at the bottom of the panel. It shows items like deleted alerts, along with the symbol, the condition, and when the log entry was created.
At the top-right of Alert Logs, you have two controls:
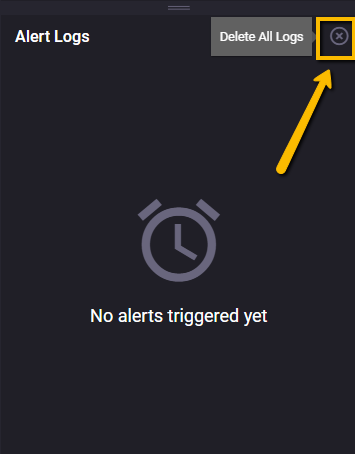
You can also remove individual log entries by clicking the X on the far right of a specific log row.