Slow Stochastic as Smart Studies
The Slow Stochastic is a momentum indicator designed to show the position of the closing price relative to the high-low range over a set number of periods.
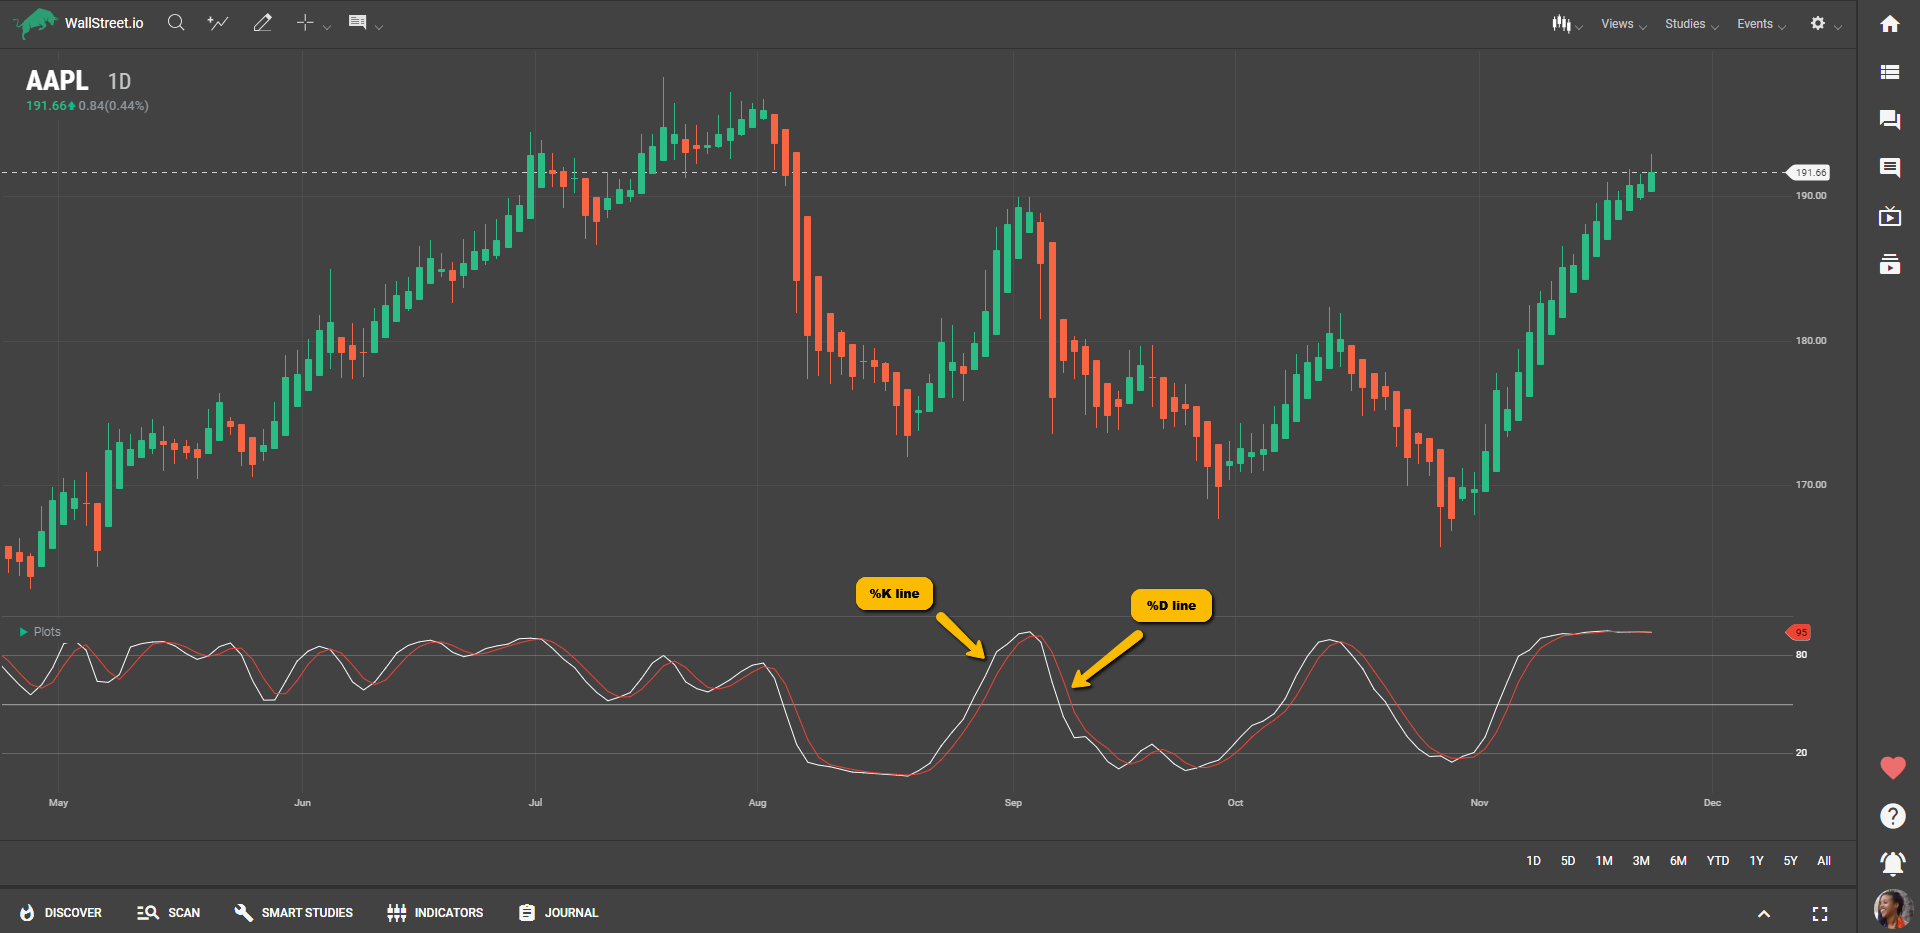
This oscillator moves between 0 and 100, helping you identify potential overbought or oversold conditions in the market. It comprises two lines: the %K line (the white line), which is the actual stochastic reading, and the %D line (the red line), which is a moving average of %K:
The formula for calculating it involves smoothing out the results of the Fast Stochastic Oscillator, typically through a 3-day SMA, as follows:
%K = 100[Sum of the (C - L14) for the %K Slowing Period / Sum of the (H14 – L14) for the %K Slowing Period]
%D = SMA of Slow %K
Where:
C = Latest Close
L14 = Lowest low for the last 14 periods
H14 = Highest high for the same 14 periods
%K Period Smoothing = 3
You can use the Slow Stochastic to understand market momentum. When the %K line crosses above the %D line below the 20 level (oversold area), it could be a buying signal, suggesting that the market may be preparing for an upward trend.
Conversely, if the %K line crosses below the %D line above the 80 level (overbought area), it could signal a potential selling opportunity, indicating that the market might start to trend downwards.