Bollinger Bands as Smart Studies
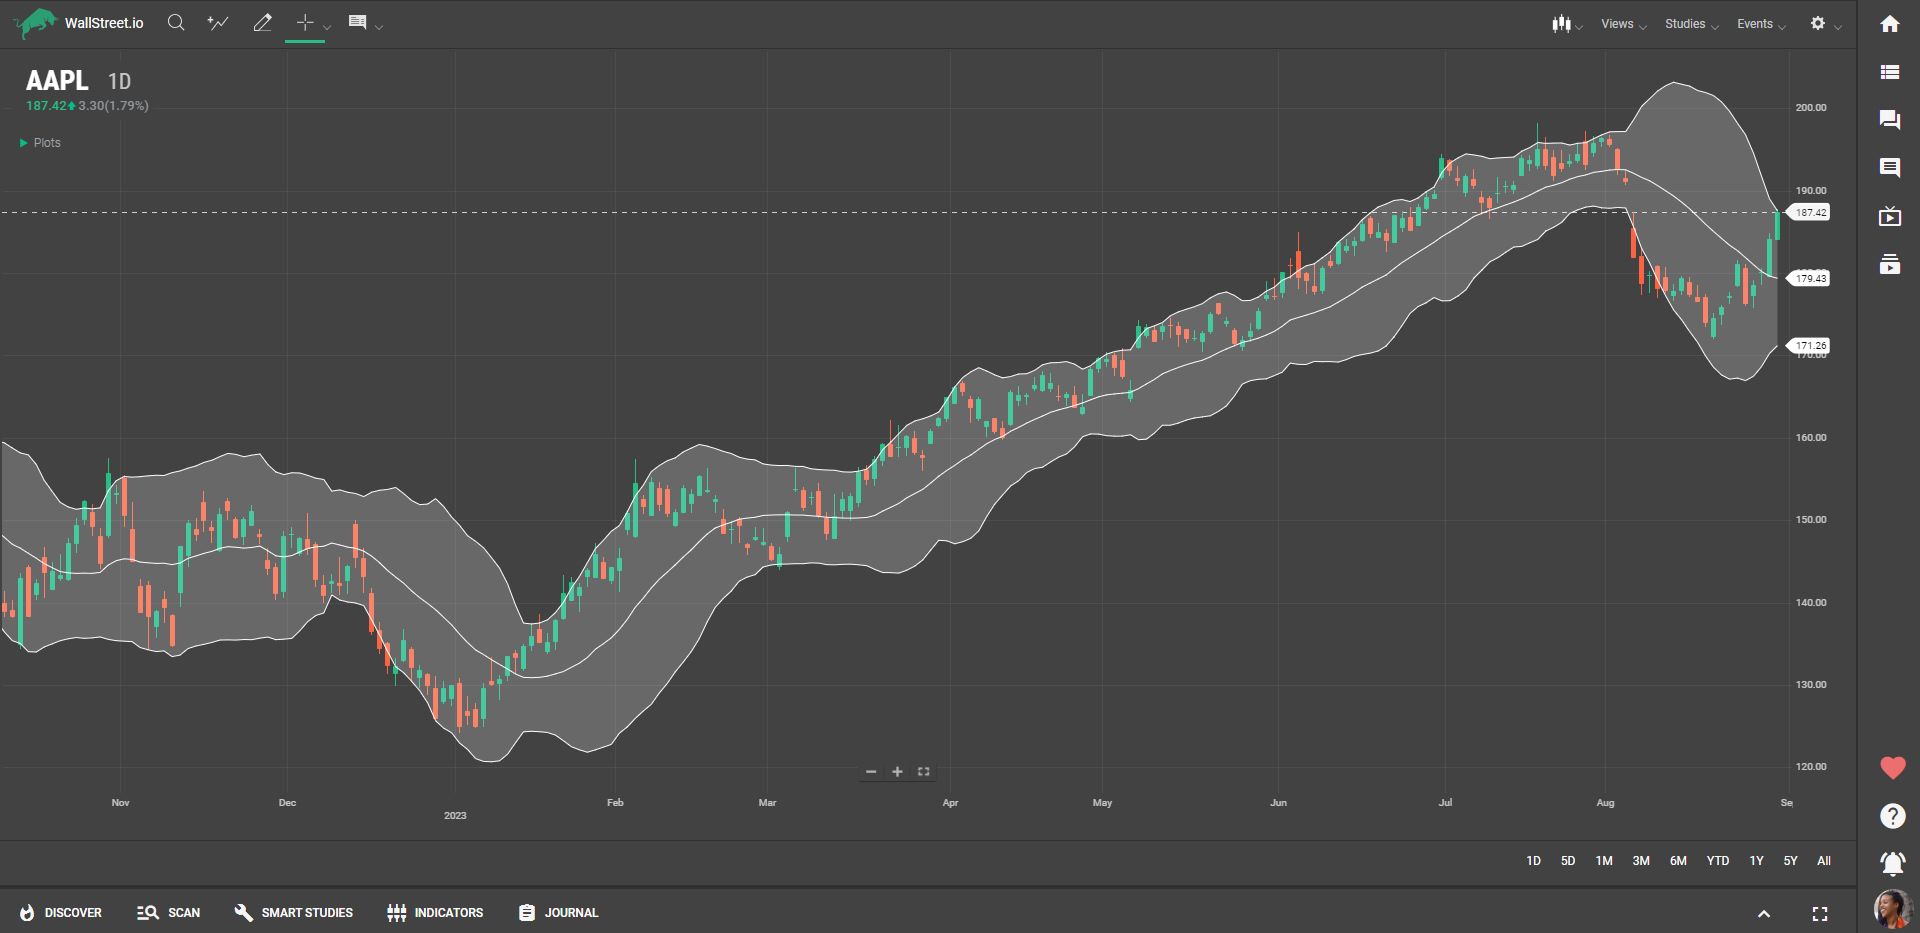
The Bollinger Bands consist of three lines plotted on a price chart: the middle band, which is a simple moving average (typically 20 periods), and the upper and lower bands, which are calculated based on a specified number of standard deviations from the middle band. Bollinger Bands dynamically adjust to market volatility, expanding during periods of increased volatility and contracting during periods of decreased volatility.
Customization Options for Bollinger Bands
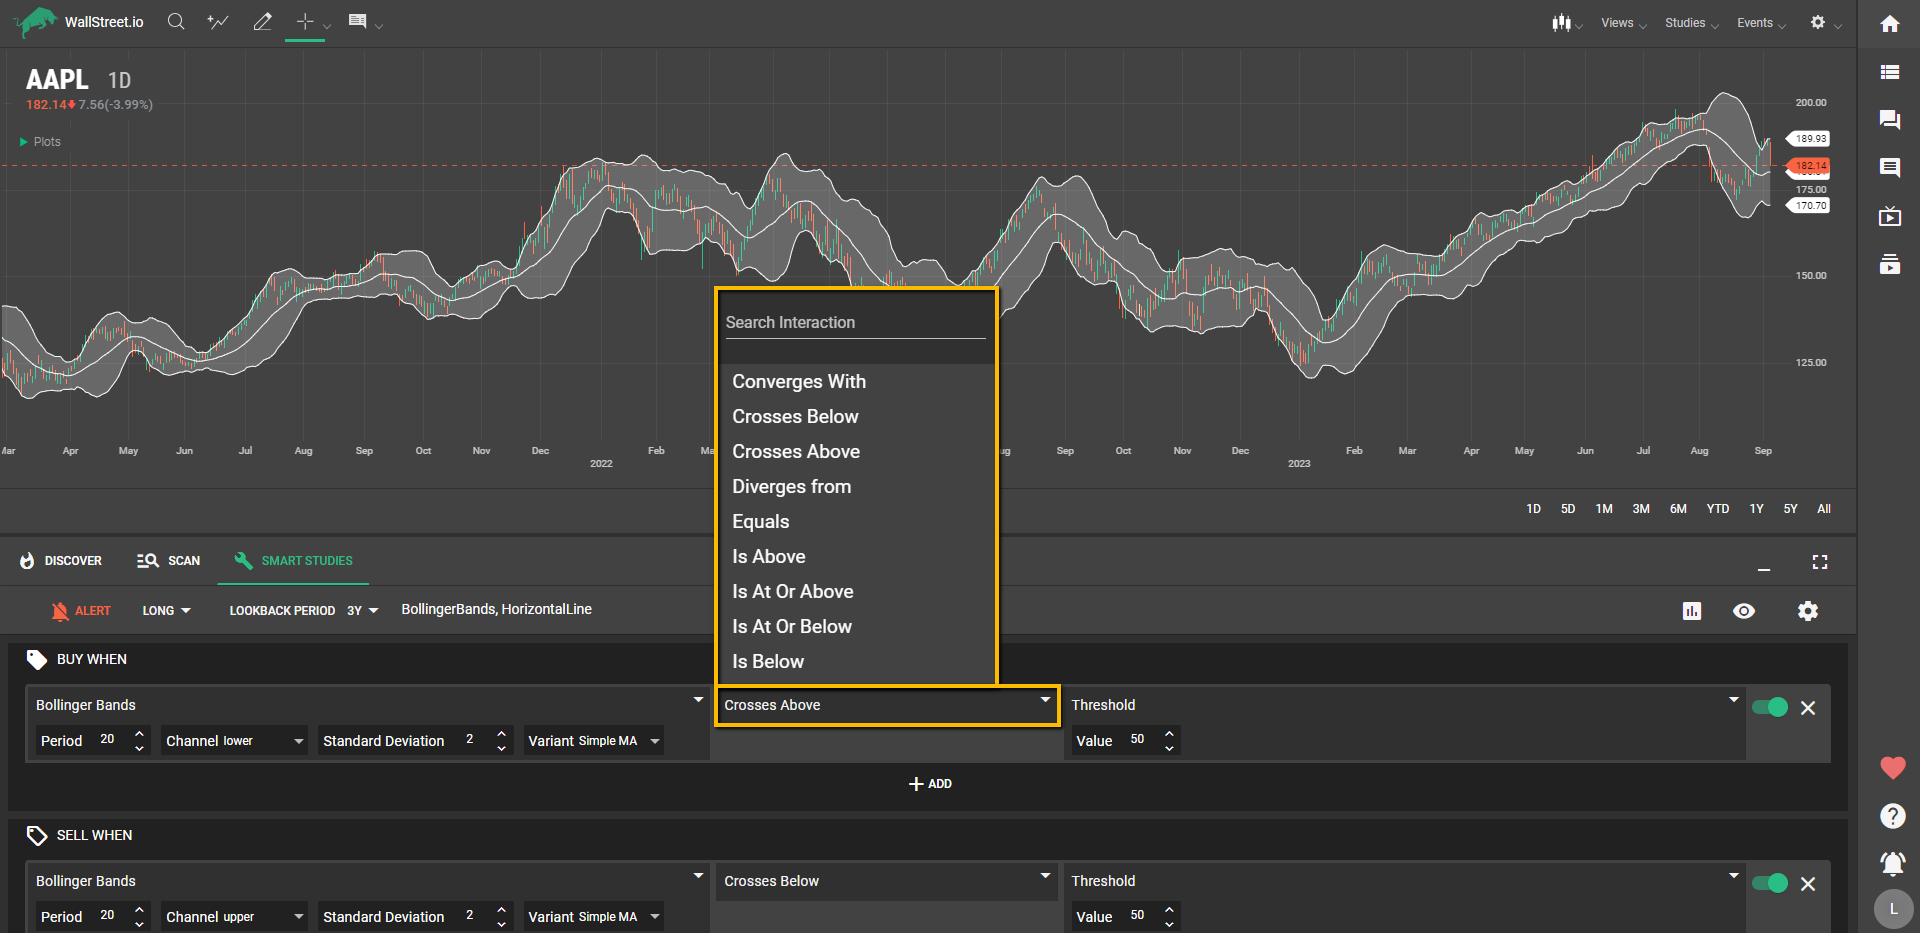
Click on the first dropdown menu under the "Buy When" or "Sell When" Signal sections, depending on if you want to create a Long (bullish) or Short (bearish) strategy.
When you select Bollinger Bands from the first dropdown menu under the Smart Studies tab, you'll find four additional sub-menus to tailor the study to your needs:
Let’s dive into what each of these concepts mean:
Period
In the context of Bollinger Bands, the term "period" refers to the number of data points or periods used in its calculation.
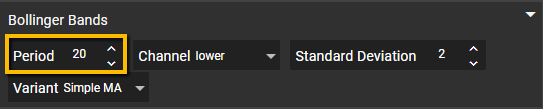
The upper and lower bands are calculated by adding and subtracting a certain number of standard deviations from the middle band. This number of standard deviations is determined by the period specified.
For example, if the period is set to 20, the calculation of Bollinger Bands will consider the past 20 periods of price data. The middle band will be the simple moving average of the price over those 20 periods. The upper band will be the middle band plus a specified number of standard deviations, and the lower band will be the middle band minus the same number of standard deviations.
The period in Bollinger Bands affects the sensitivity and width of the bands. A shorter period, such as 10, will result in narrower bands that closely follow price movements. This can be useful for identifying shorter-term price volatility and potential breakouts.
On the other hand, a longer period, such as 20 or 50, will result in wider bands that capture a broader view of price volatility over a longer time frame. This can be helpful for identifying longer-term trends and potential reversals.
Channel
Bollinger Bands are designed to act as dynamic support and resistance levels that encompass the price action within these bands. Here, you can select between the "upper" or "lower" band. This is the band against which your chosen Study or Threshold will interact.
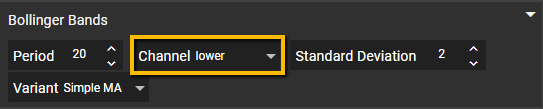
The upper band represents the upper boundary of the channel, while the lower band represents the lower boundary. The width of the channel is determined by the standard deviation and the period used in the calculation of the Bollinger Bands.
Choose between "upper" or "lower" bands to specify which part of the Bollinger Bands you want to focus on.
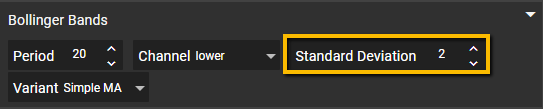
Standard Deviation
In the Bollinger Bands, it sets the distance between the bands and the central moving average. The default is 2, and increasing this value will widen the bands, capturing more price action.
Variant
The middle band of the Bollinger Bands is a Moving Average. With the “Variant” menu, you’re able to choose the Moving Average type (Simple, Exponential, Double, Weighted, etc.).
Each has its unique sensitivity to price movements.
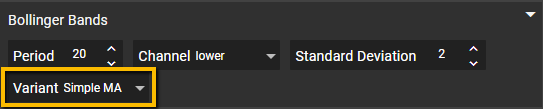
The most used is a Simple Moving Average (SMA) and serves as the baseline for the indicator. Also, the most common period used for the middle band is 20, representing the past 20 periods of price data. However, this period can be adjusted based on your preference and the specific market being analyzed.
Selecting Interactions
Once you've configured the Bollinger Bands, move to the second dropdown to pick the interaction. You have options like "Crosses above," "Is below," "Converges with," etc., to determine how the first criteria set will relate to the second criteria set.
Testing the Bollinger Bands
In the third dropdown, you're presented with a list of Studies and values that can be combined with Bollinger Bands:

Final thoughts
Using Bollinger Bands in the Smart Studies Tab offers you a versatile and insightful tool for strategy development. The range of customizable parameters lets you fine-tune your approach, while the ability to pair it with other studies adds depth to your strategy. With real-time backtesting, you can instantly gauge performance metrics, making it easier to adapt and optimize your trading game. It's a comprehensive tool that caters to various trading styles and timeframes.