DMI as Smart Studies
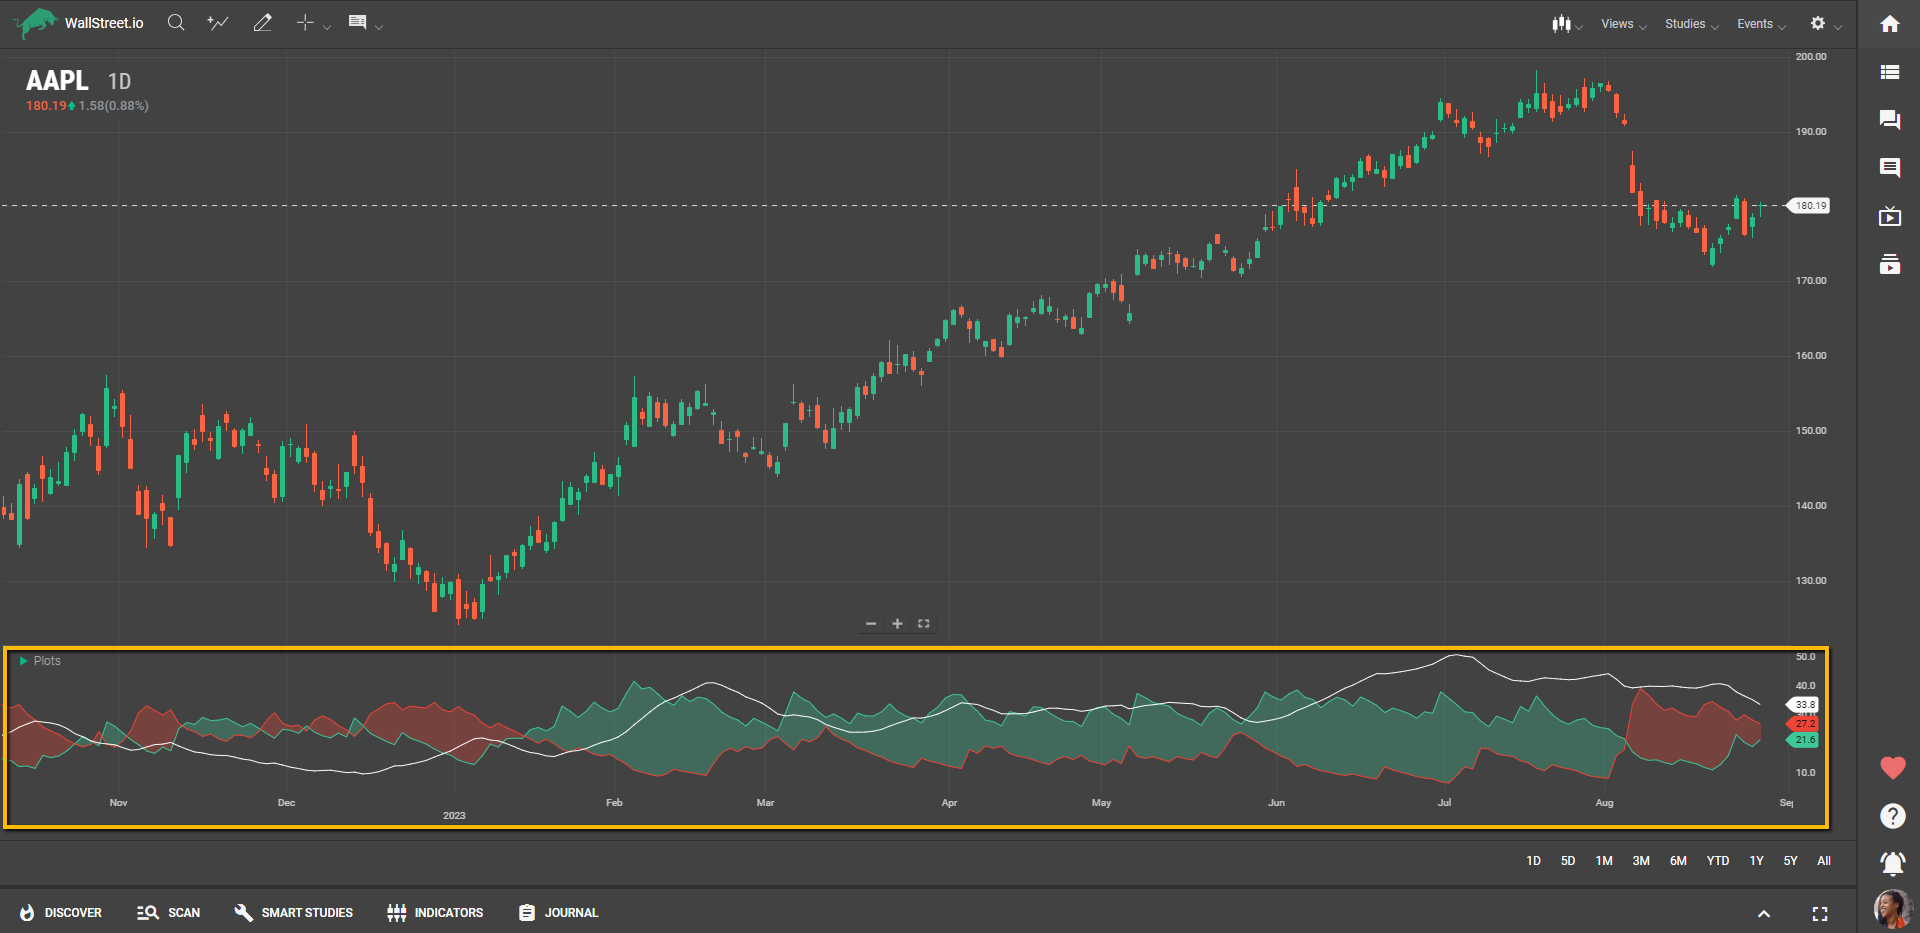
The Directional Movement Index (DMI) is a technical indicator used to assess the strength and direction of a price trend.
It consists of two lines: the Positive Directional Indicator (+DI) and the Negative Directional Indicator (-DI). The +DI measures upward price movement, while the -DI measures downward movement. By comparing these indicators, traders can identify whether a market is experiencing bullish or bearish momentum. The DMI also includes the Average Directional Index (ADX), which quantifies the strength of the trend.
Customization Options for DMI
Click on the first dropdown menu under the "Buy When" or "Sell When" Signal sections, depending on if you want to create a Long (bullish) or Short (bearish) strategy.
When you select the DMI from the first dropdown menu under the Smart Studies tab, you'll find two additional sub-menus to tailor the study to your needs:
Let’s dive into what each of these concepts means:
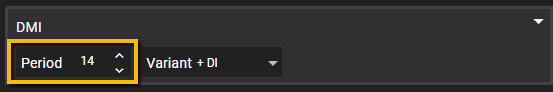
Period
The period determines the number of bars that are used to calculate the +DI and -DI values, therefore impacting the sensitivity of these DMI lines. The default value is set at 14, but you can change it to any numeric value that suits your strategy.
Variant
Here you can choose between the +DI and -DI lines. The +DI line measures the strength of the upward trend, while the -DI line measures the strength of the downward trend.
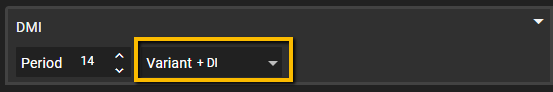
The ADX is often used to assess the strength of a trend rather than focusing on the directional movement itself. Other variants may include adjustments to smoothing techniques or incorporating additional indicators to enhance the analysis.
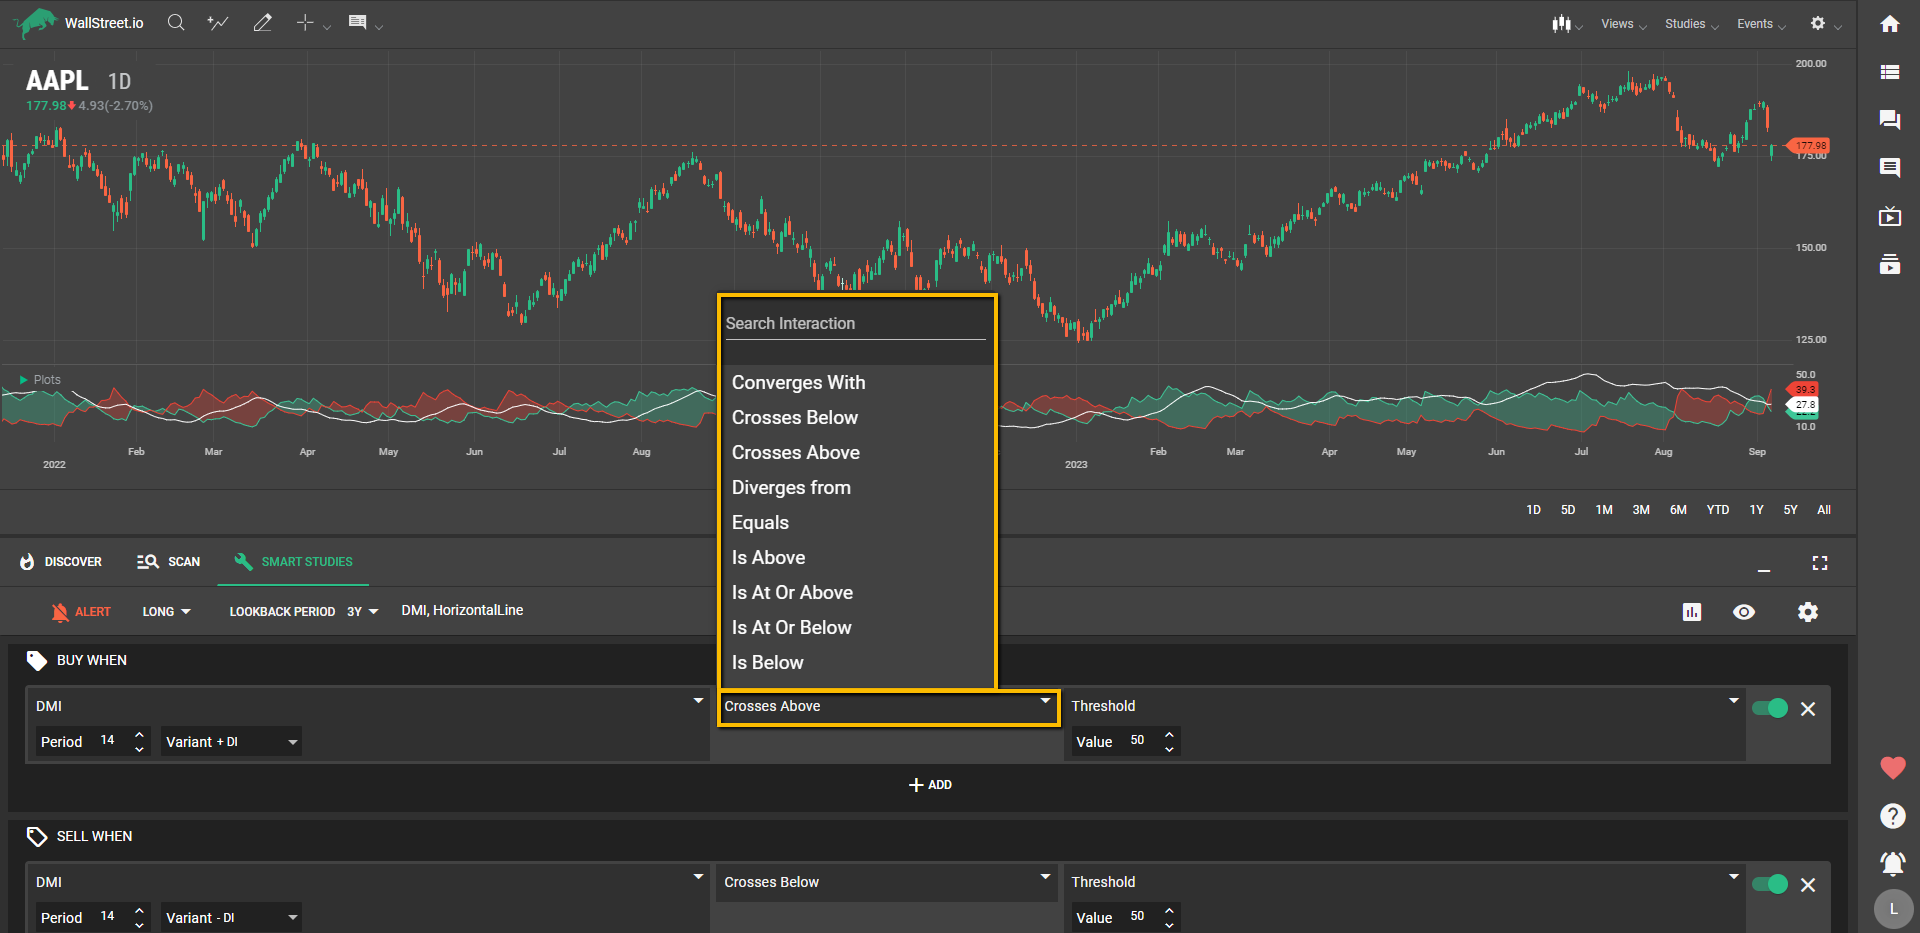
Selecting Interactions
Once you've configured the DMI, move to the second dropdown to pick the interaction. You have options like "Crosses above," "Is below," "Converges with," etc., to determine how the first criteria set will relate to the second criteria set.
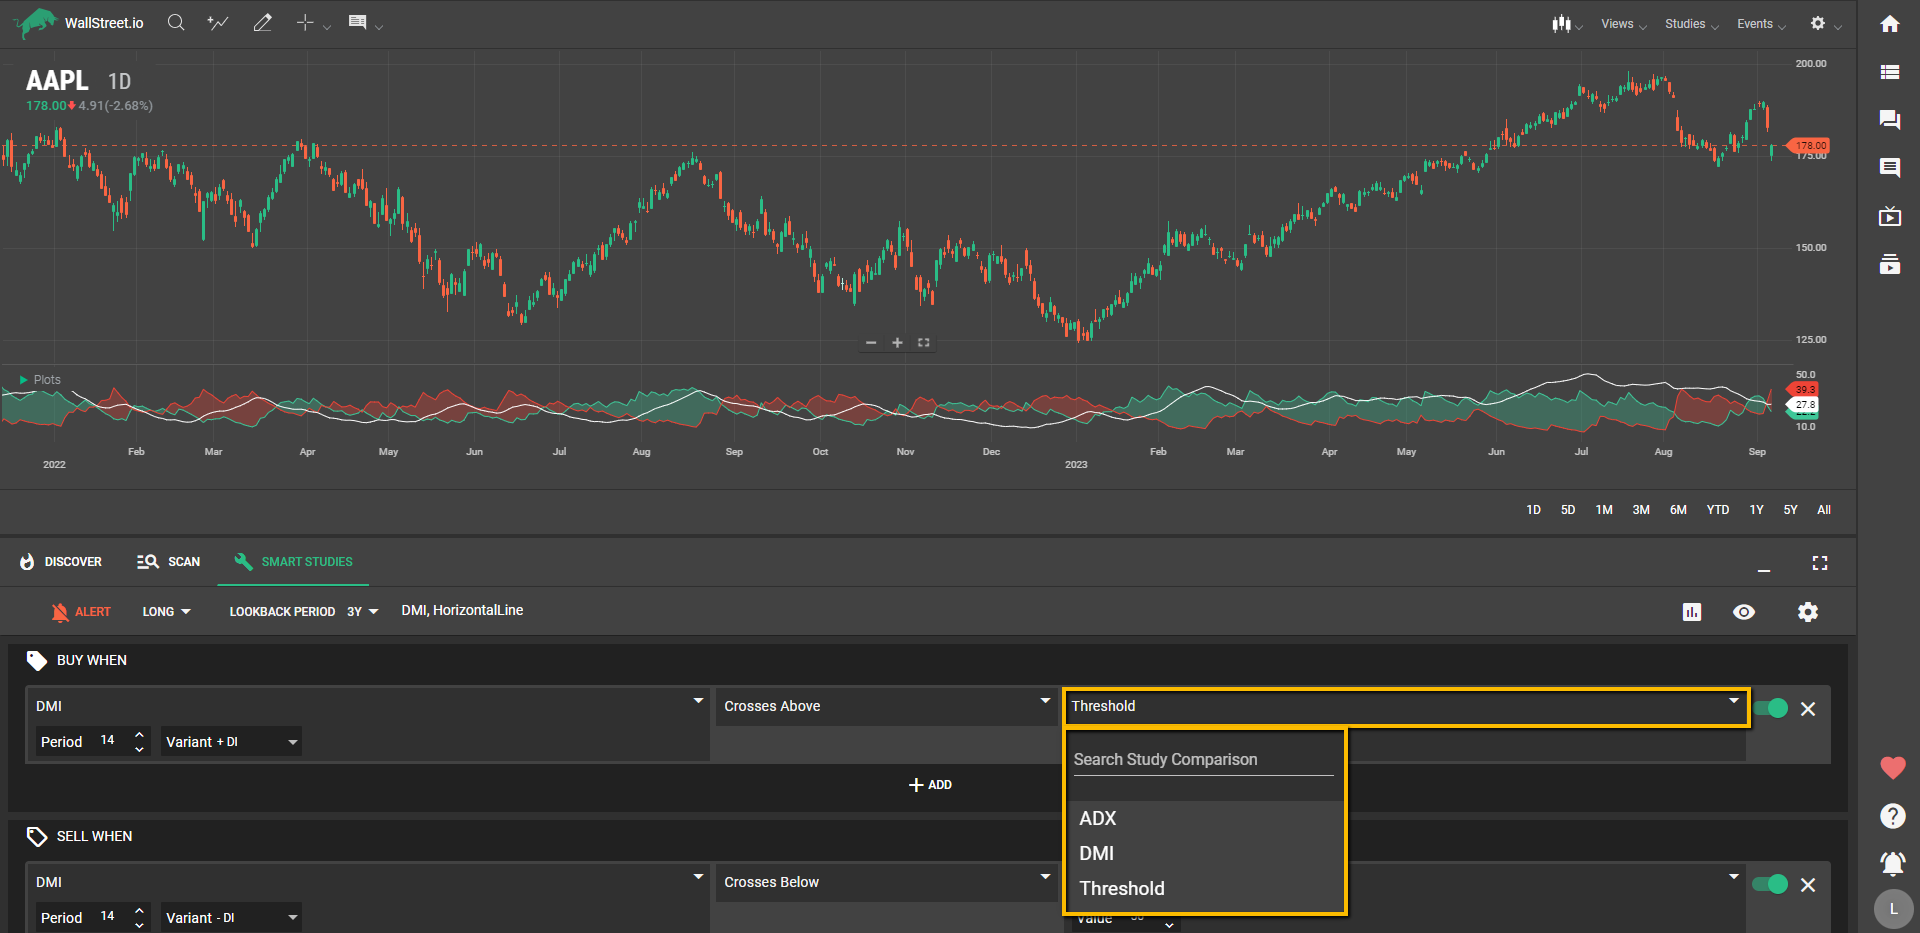
Testing the DMI
In the third dropdown, you're presented with a list of Studies and values that can be combined with the DMI:
The use of DMI within the Smart Studies Tab provides a nuanced way to gauge market trends, allowing you to construct well-informed entry and exit signals. With its customizability in setting the period and choosing between +DI and -DI lines, DMI enables you to capture the essence of directional movements. Paired with real-time backtesting statistics, it offers a robust foundation for crafting strategies that align with your trading objectives and risk tolerance.