ADX as Smart Studies
The Average Directional Index (ADX) is used to quantify the strength and intensity of a market trend, regardless of its direction. Essentially, a higher ADX value indicates a strong trend, while a lower value suggests a weak or non-existent trend.
In short, it measures the extent to which a market is trending and provides insights into the potential for trend continuation or trend reversal.
Using the ADX
Click on the first dropdown menu under the "Buy When" or "Sell When" Signal sections, depending on if you want to create a Long (bullish) or Short (bearish) strategy.
From the dropdown list of studies, select "ADX." Upon making this selection, a smaller dropdown menu will appear, allowing you to set the "Period.”
Customizing the ADX Period
The "Period" customization allows you to set the length of time the ADX considers for its calculation. By default, this value is set at 14, but the period can be adjusted based on your preference.
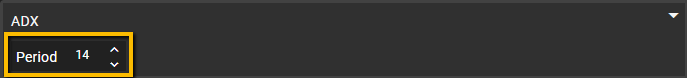
For example, if a period of 14 is chosen, the ADX will be calculated based on the past 14 periods of price data.
A shorter period, such as 10, may provide more sensitive and responsive ADX readings, capturing shorter-term trends. On the other hand, a longer period, like 20 or 30, may smooth out the ADX readings and provide a broader view of the overall trend.
Setting Interactions
After setting your ADX period, the next step is to select an interaction from the second dropdown menu. Interactions like "Is above," "Crosses below," and so on will determine the exact condition that must be met for your Signal to trigger.
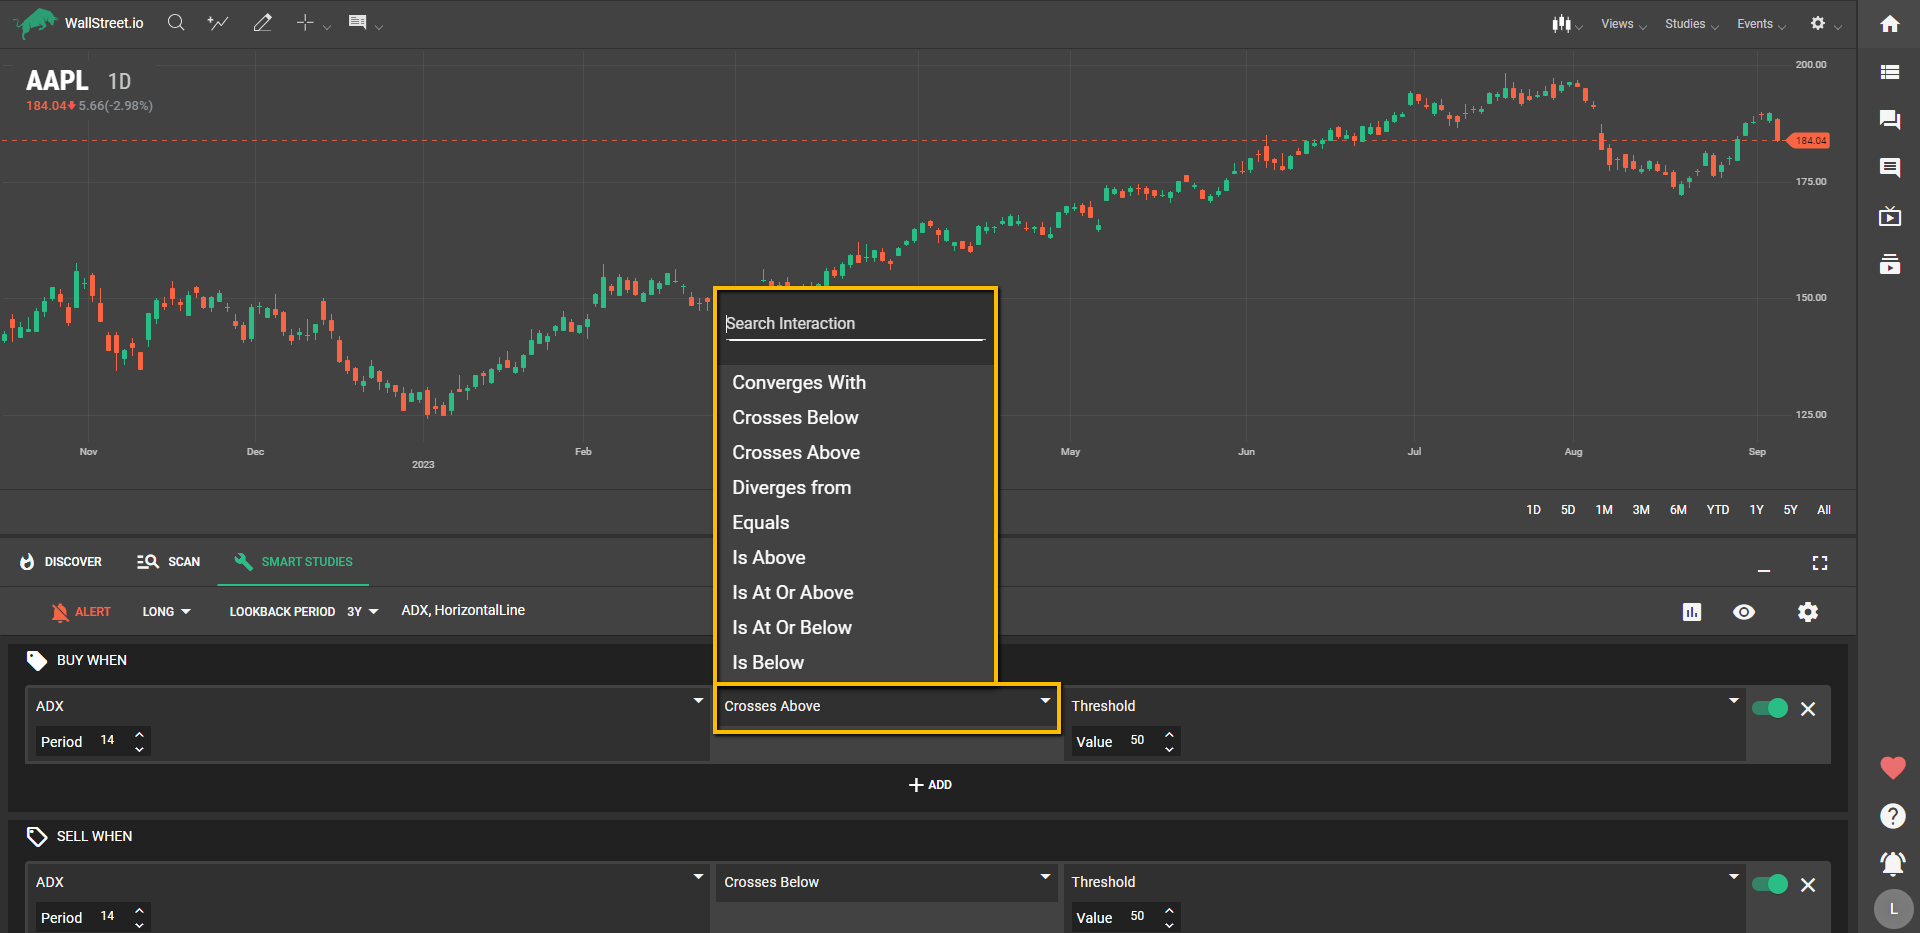
Once you've picked an interaction, it's time to choose a complementary study or a threshold value from the third dropdown menu. You can opt to pair the ADX with:
Using ADX with Another ADX
You could choose to combine the ADX with another instance of itself but with a different period setting. This allows you, for example, to compare short-term and long-term trend strengths, offering a multi-dimensional view of market conditions.

Using a Threshold Value
The "Threshold" option lets you specify a numeric value that the ADX must reach to trigger your Entry or Exit Signal. For example, if you set a threshold value of 40, your "Buy When" Signal could be triggered when the ADX crosses above 40, indicating a strong uptrend.

Combining ADX with DMI
When paired with DMI, the ADX can provide a more holistic view of market direction. For example, in a straightforward, single-signal strategy, you could use the ADX and DMI in the following way:

This is,
Buy When:
In this example, the Entry Signal triggers when the ADX value (with a period of 14) is above the +DI value of the DMI (also with a period of 14). This setup targets situations where the overall trend strength (ADX) is stronger than the current directional movement (+DI of DMI).
Here, you're not specifying a numerical threshold; rather, you're directly comparing two different studies. This can offer a dynamic way to enter trades based on the relationship between general trend strength and specific directional movement.
The ADX is an invaluable tool for identifying trend strength, so don't hesitate to get creative! You can also construct complex strategies by adding multiple Signals within the same group or by creating different groups of Signals.