Hull MA as Smart Studies
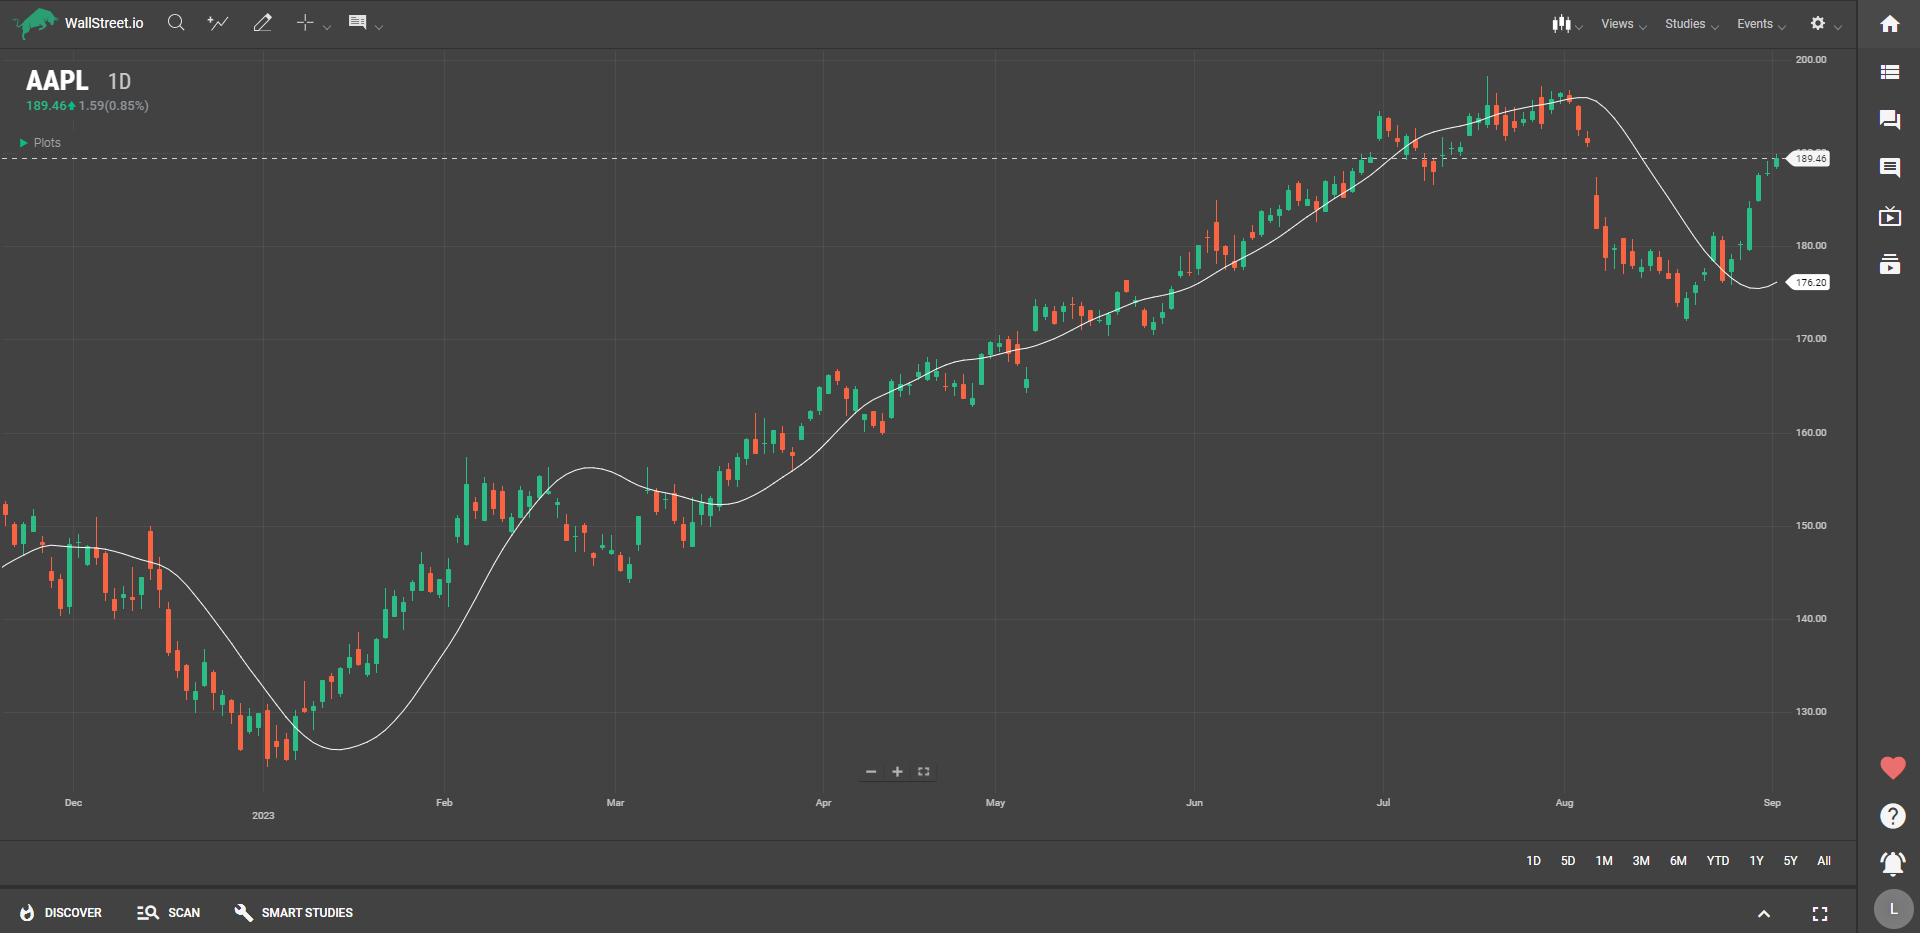
The Hull Moving Average (Hull MA or HMA) is a popular technical indicator developed by Alan Hull. It aims to provide a smoother and more responsive moving average than traditional ones. The HMA achieves this by utilizing a weighted moving average based on a specific period.
Customization Options for the Hull MA
Click on the first dropdown menu under the "Buy When" or "Sell When" Signal sections, depending on if you want to create a Long (bullish) or Short (bearish) strategy.
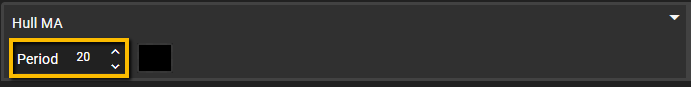
When you select the Hull MA from the first drop down menu under the Smart Studies tab, you'll find an additional sub-menu to adjust the Period for this Moving Average type.
Period
Shorter periods, such as 9 or 12, make the HMA more sensitive to recent price changes, resulting in a quicker response to price trends. Longer periods, such as 20 or 50, provide a smoother average and are better suited for identifying longer-term trends.
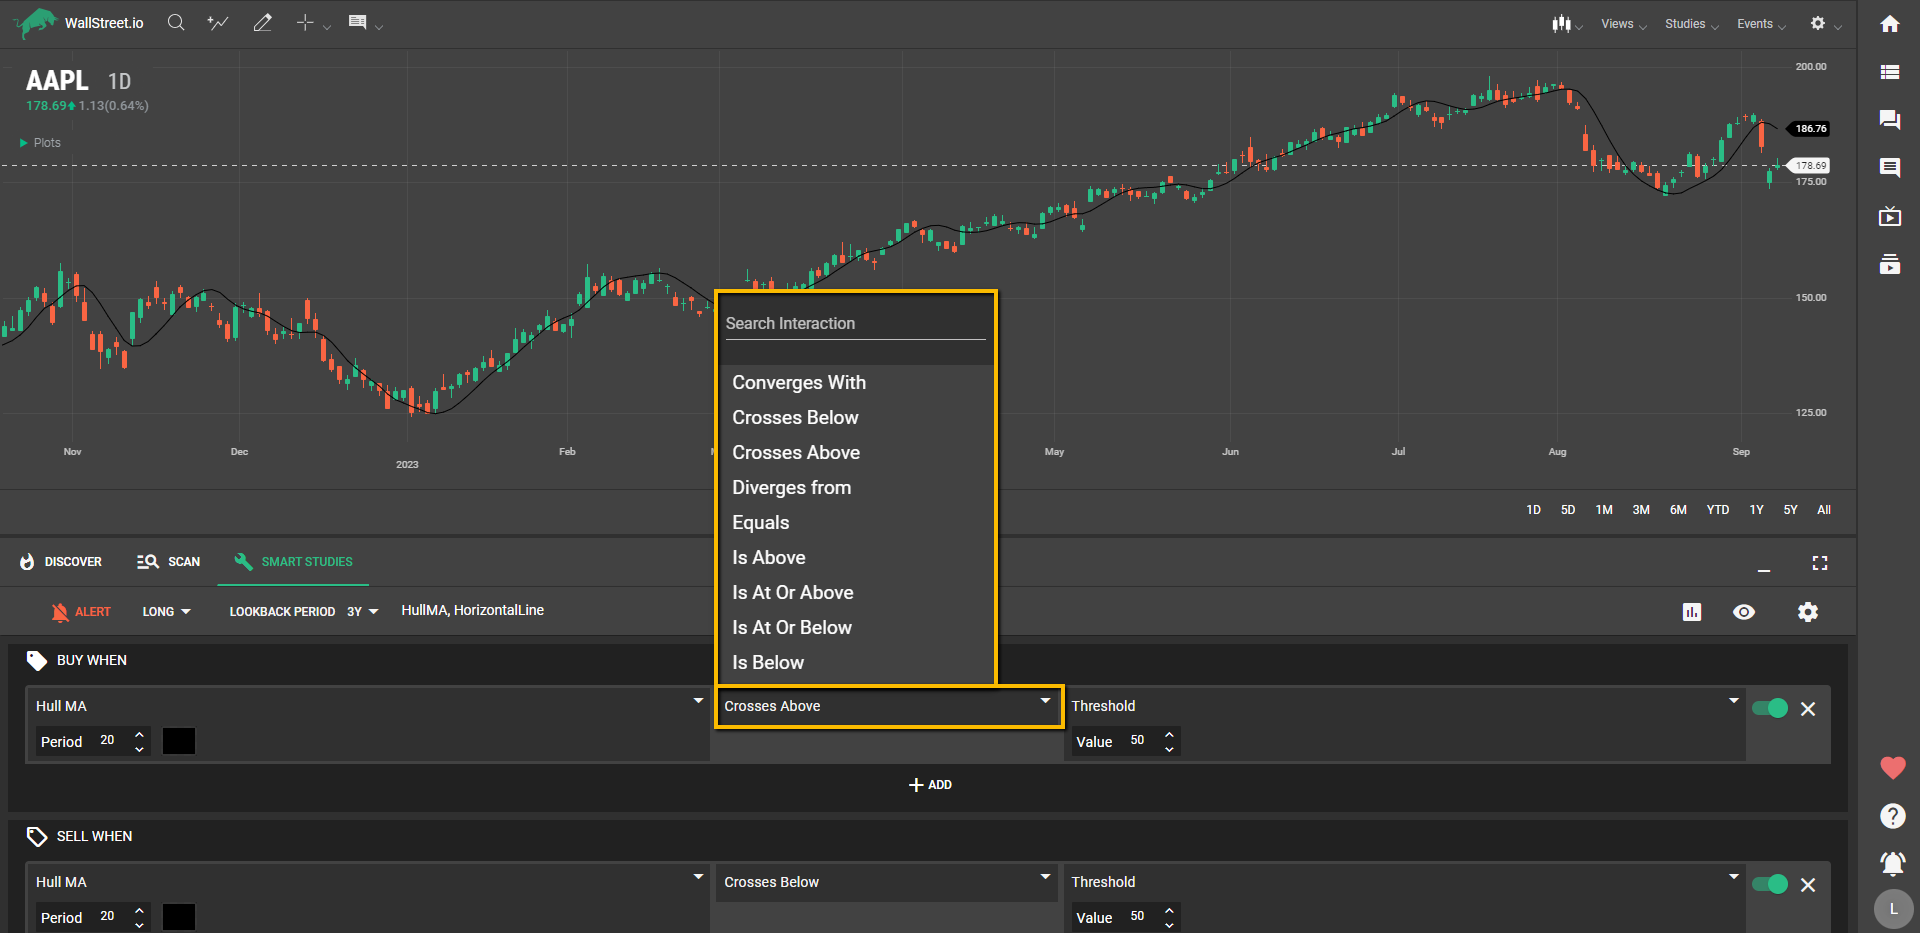
Selecting Interactions
Once you've configured the HMA, move to the second dropdown to pick the interaction. You have options like "Crosses above," "Is below," "Converges with," etc., to determine how the first criteria set will relate to the second criteria set.
Testing the Hull MA
In the third dropdown, you're presented with a list of Studies and values that can be combined with the HMA:
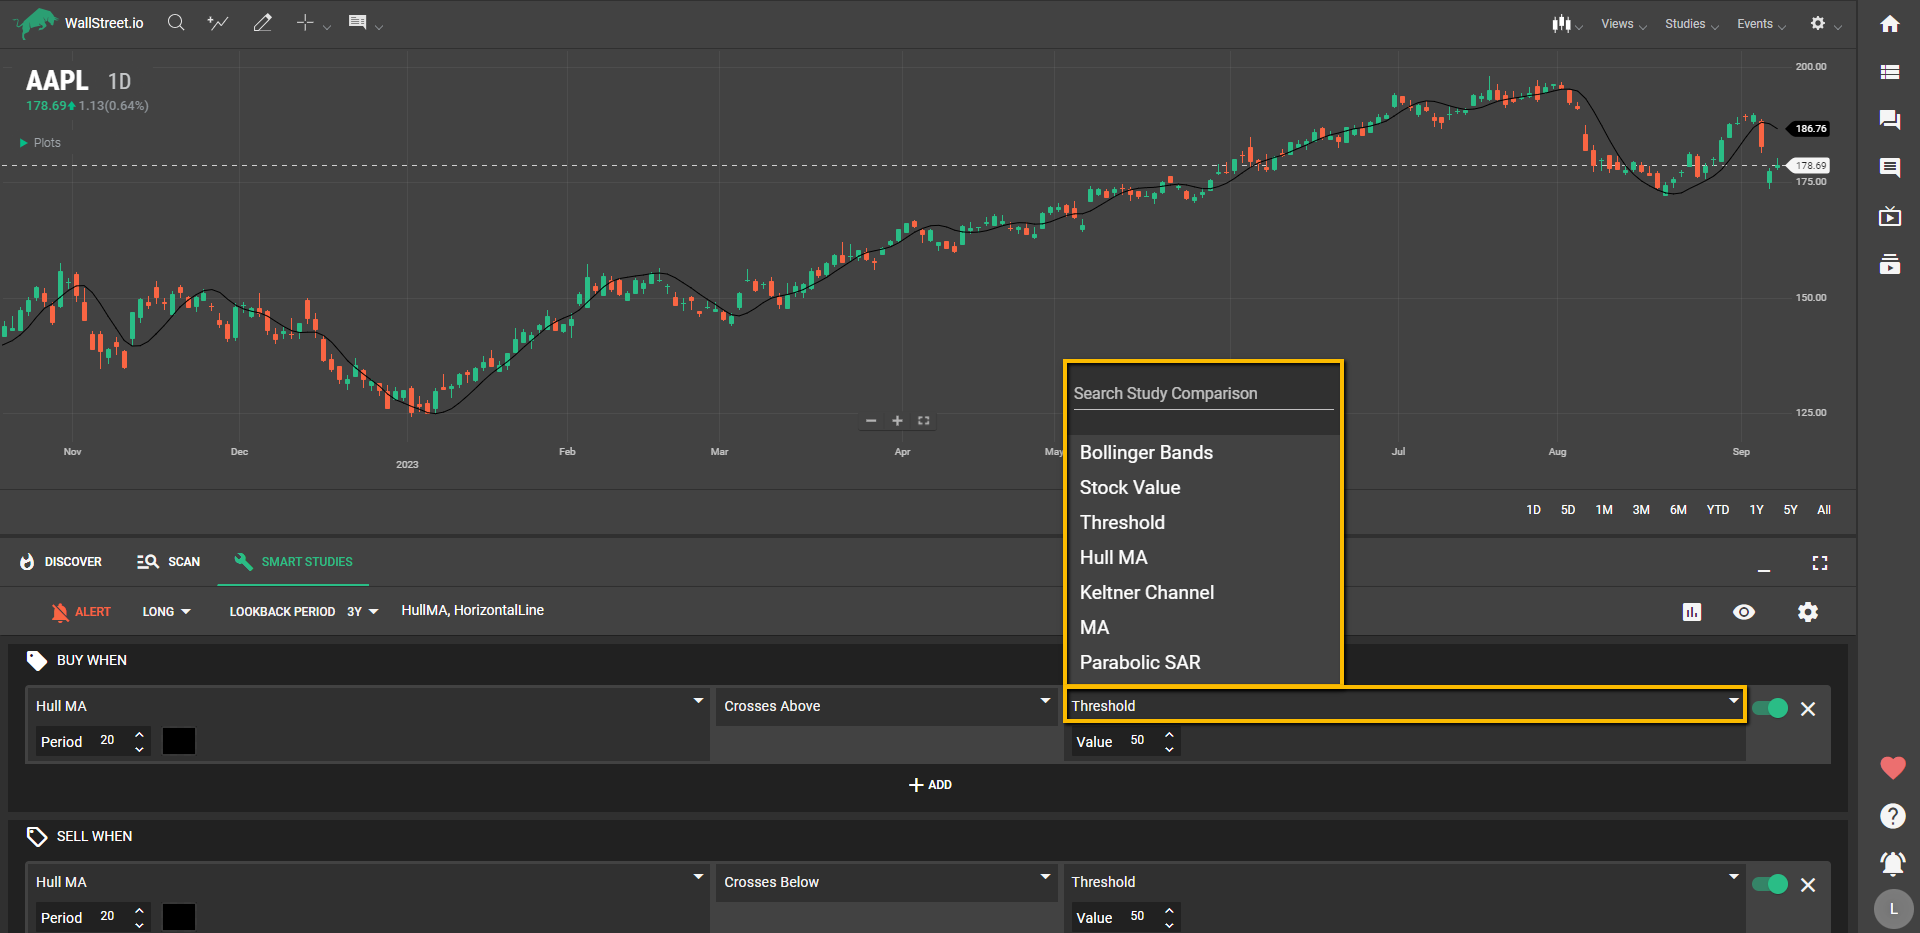
The Hull Moving Average (Hull MA) stands out as a versatile indicator that offers a smoother, faster way to identify market trends, making it a valuable component in a wide array of trading strategies. When combined with other studies, the Hull MA helps to filter out market noise and provide more reliable entry and exit points. The end result is a more effective strategy that allows you to navigate market conditions with increased confidence and reduced risk.