Moving Averages as Smart Studies
The Moving Averages (MA) study is a fundamental technical analysis tool that smoothens price data to identify trends. It is highly customizable in the Smart Studies tab, making it a versatile choice for building and backtesting strategies. This guide explains how to use the MA study and set its conditions effectively.
Customization Options for Moving Averages
When selecting MA from the first dropdown in a condition, you can further customize the study using these sub-menus:
Period
Set a numeric value to define the number of bars or data points used in calculating the moving average. This helps tailor the MA to shorter or longer timeframes.

Variant
Choose the type of Moving Average that best fits your strategy:
• Simple: A straightforward average of prices over a set period.
• Exponential: Places greater weight on recent data for quicker responsiveness.
• Double: An average of the Exponential to further smoothen price fluctuations.
• Weighted: Assigns a linear weight to data, emphasizing recent data even more than EMA.
• Triple: Calculates an EMA of the EMA, creating a lagging but very smooth trendline.
• Triangular: Averages data twice, placing more weight in the middle of the data set.

Color
Next to the Variant dropdown, click on the colored box to choose a color for your Moving Average. This customization is particularly useful if you decide to load the study onto the chart through the Show Strategy Studies option under the Chart Add-Ons menu in the Smart Studies tab.

Possible Interactions
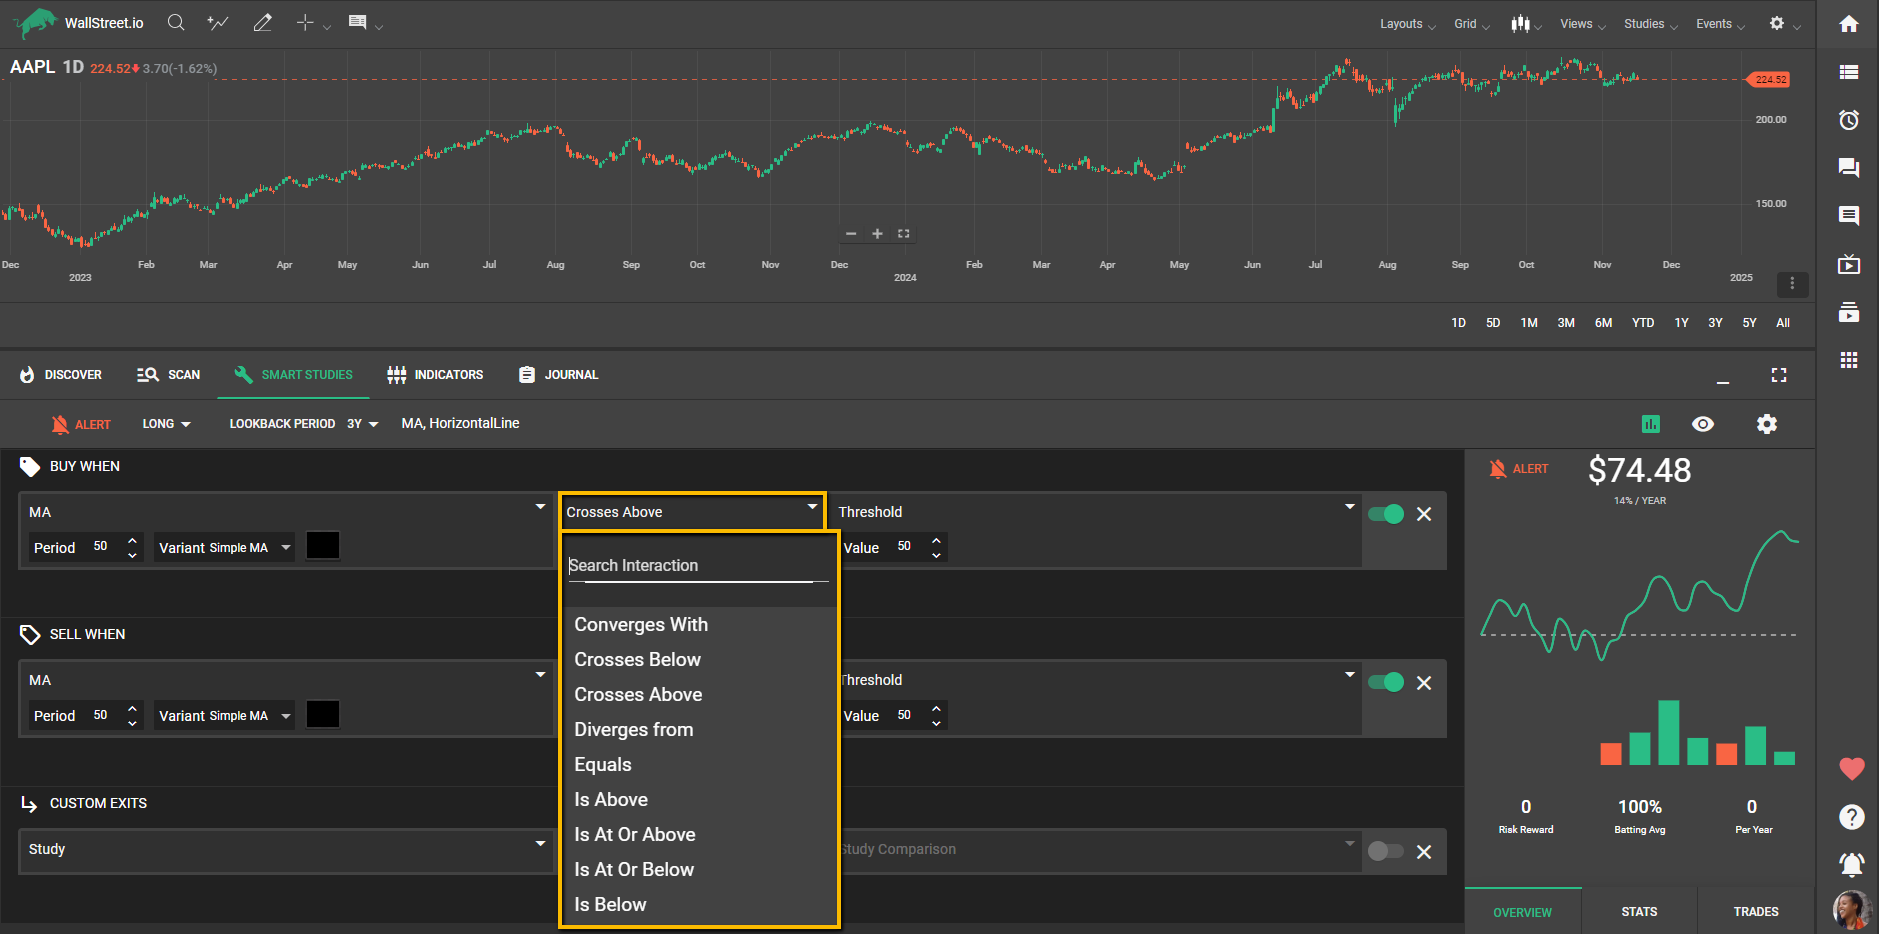
In the second dropdown, you can select interactions to define how the Moving Average relates to other data points. Available interactions include:
• Converges With: When the MA moves closer to another indicator.
• Crosses Below: When the MA crosses below another value or study.
• Crosses Above: When the MA crosses above another value or study.
• Diverges From: When the MA moves further away from another indicator.
• Equals: When the MA is equal to another value.
• Is Above: When the MA is consistently above another value.
• Is At or Above: When the MA touches or remains above another value.
• Is At or Below: When the MA touches or remains below another value.
• Is Below: When the MA is consistently below another value.

Testing the Moving Average Study
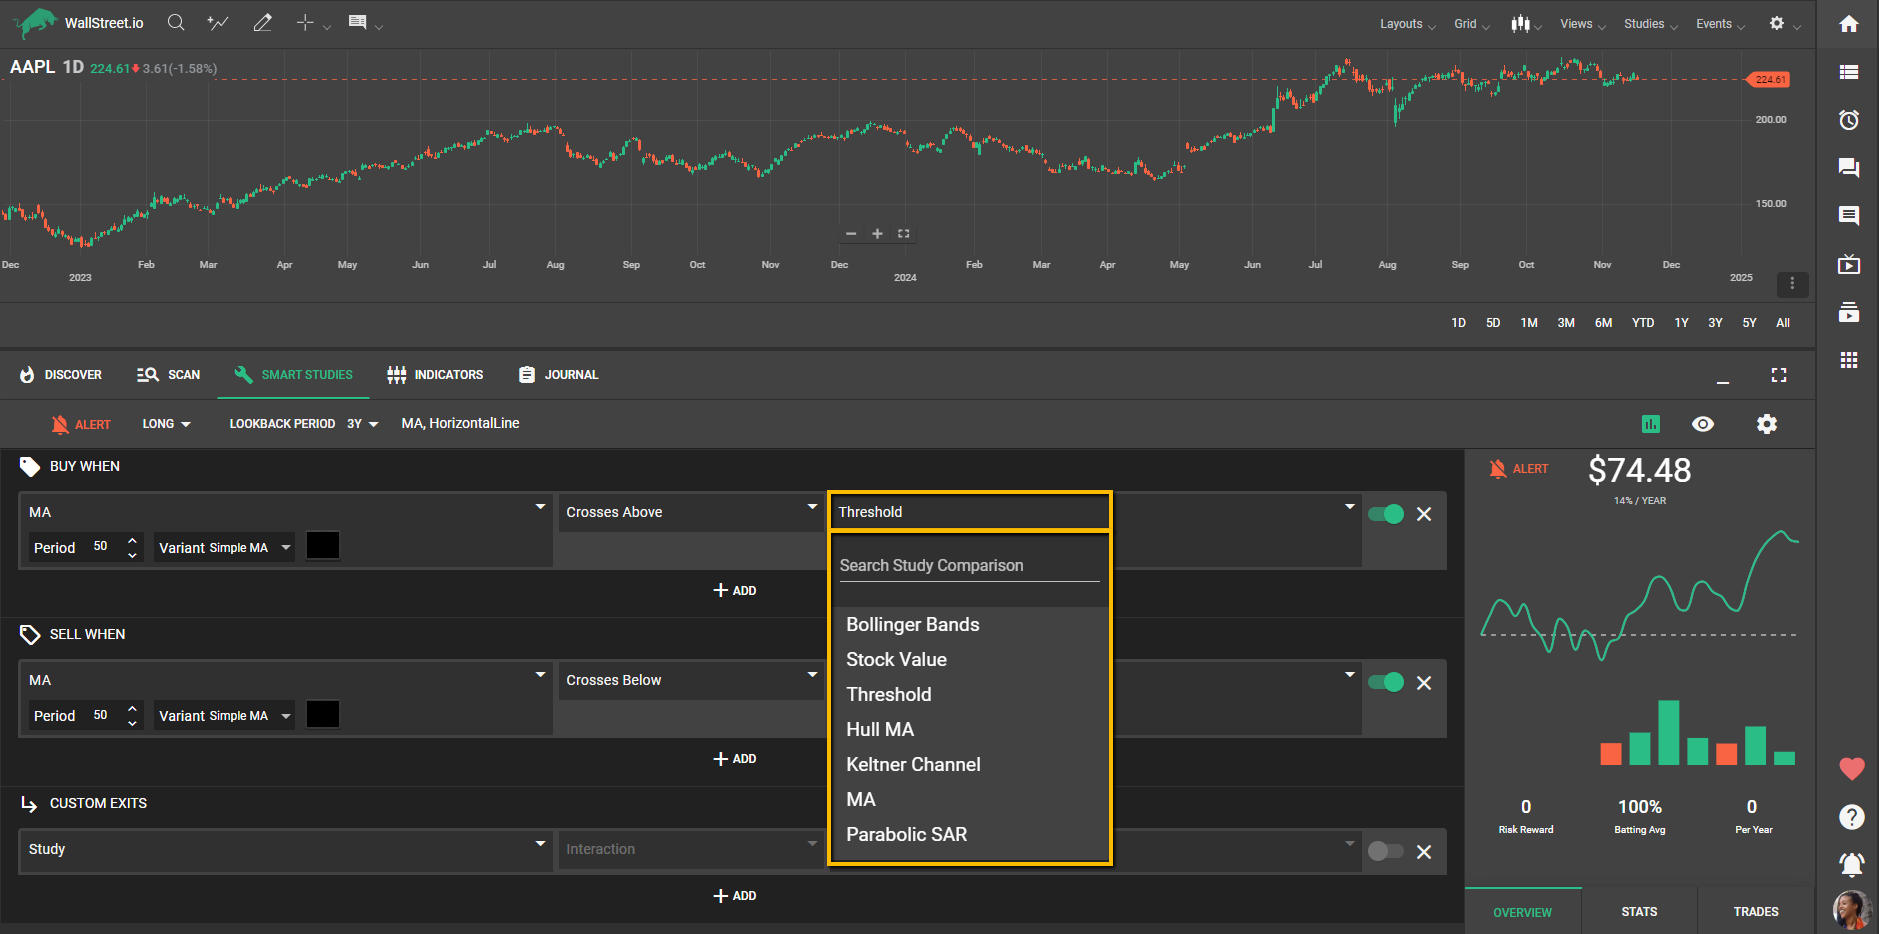
In the third dropdown, you can select the value or study to compare against the MA. Available options include:
• Bollinger Bands: Use the upper, lower, or middle bands to measure price volatility relative to the MA.
• Stock Value: Compare the MA to the stock's current price.
• Threshold: Set a fixed value for comparison (e.g., a stock price threshold).
• Hull MA: Combine the MA with the Hull Moving Average to identify smoother trends.
• Keltner Channel: Evaluate how the MA interacts with this volatility-based indicator.
• MA: Compare one MA to another (e.g., a 20-period SMA vs. a 50-period EMA).
• Parabolic SAR: Integrate the MA with this stop-and-reverse indicator for trend confirmation.


 Discover Tab Reference Guide
 Discover Tab How-To Guide
 Smart Studies How-To Guide
 Smart Studies Reference Guide
 Scan Tab Reference Guide
 Scan Tab How-To Guide
 Watchlists How-To guide
 Watchlists Reference Guide
 Chatrooms Reference Guide
 Community Wall How-To Guide
 Community Wall Reference Guide
 Streams Reference Guide
 Streams How-To Guide