
 Discover Tab Reference Guide
 Discover Tab How-To Guide
 Smart Studies How-To Guide
 Smart Studies Reference Guide
 Scan Tab Reference Guide
 Scan Tab How-To Guide
 Watchlists How-To guide
 Watchlists Reference Guide
 Chatrooms Reference Guide
 Community Wall How-To Guide
 Community Wall Reference Guide
 Streams Reference Guide
 Streams How-To Guide
ADX/DMS
Definition
The ADX/DMS (sometimes called DMI instead of DMS) is a set of indicators within technical analysis that helps traders identify the strength and direction of a trend. The ADX measures the strength of a trend but not its direction, while the DMS includes two lines, the +DI (Positive Directional Indicator) and -DI (Negative Directional Indicator), which help indicate the trend's direction.
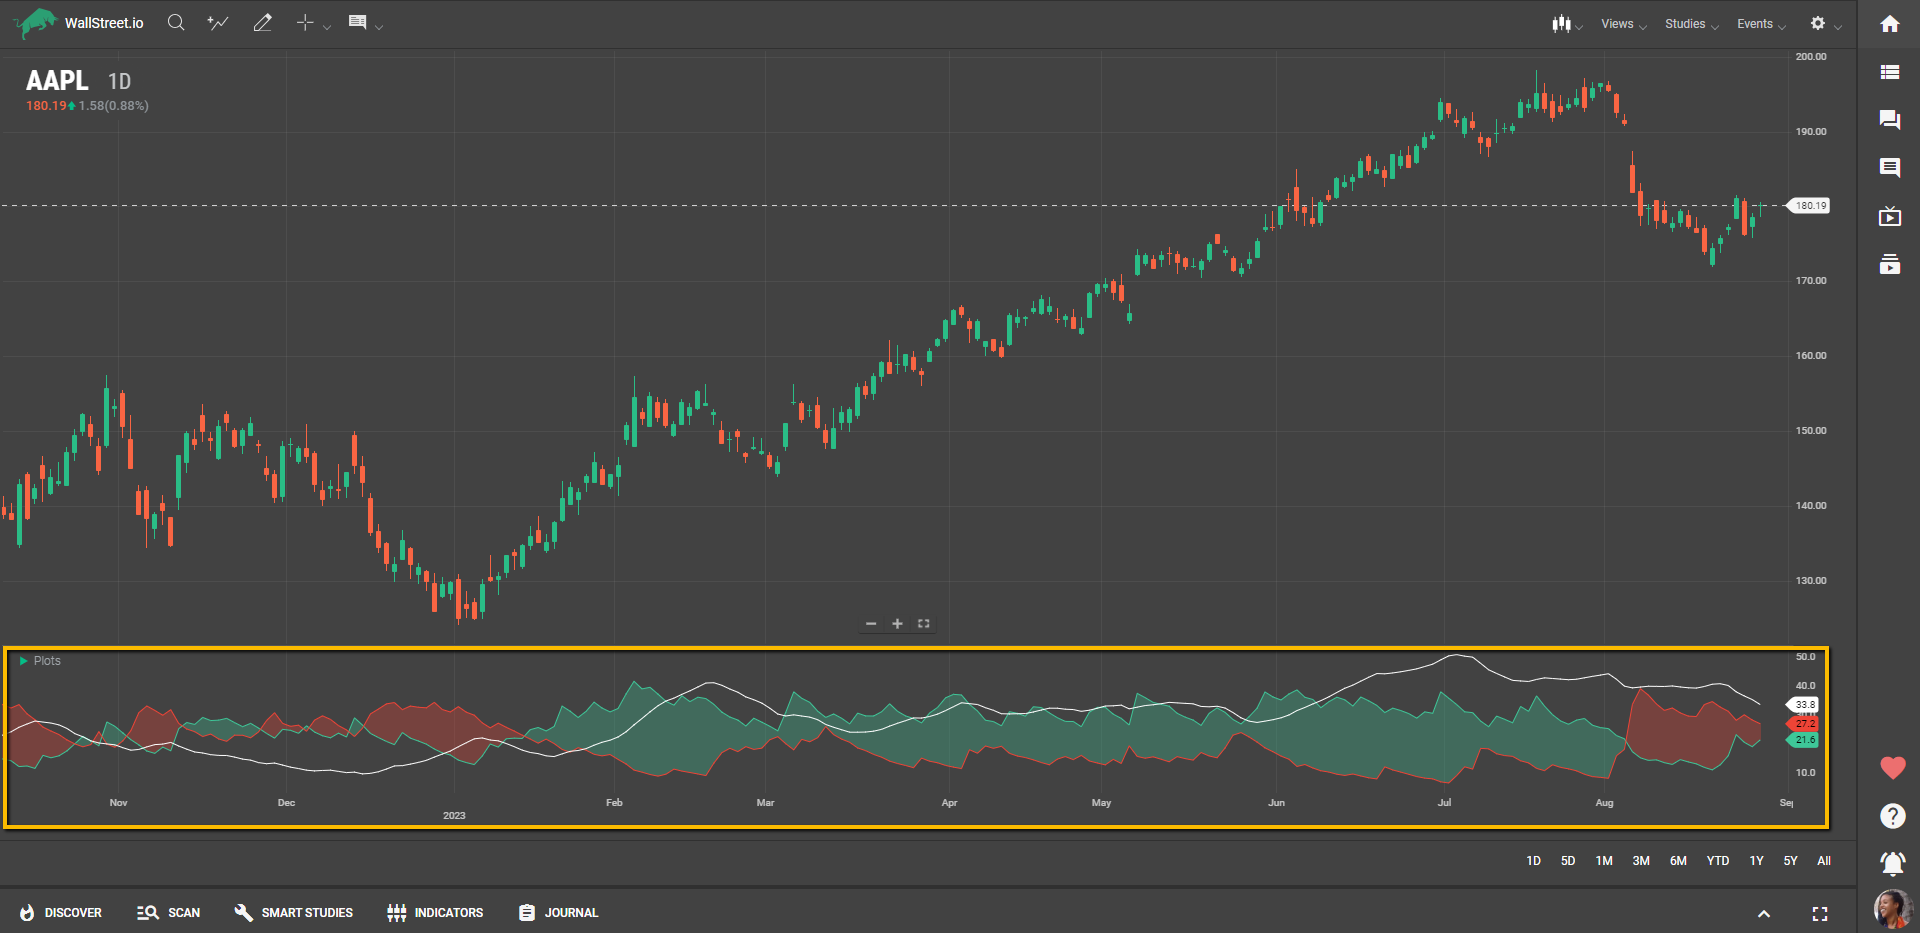
Suggested Trading Use
Traders can utilize the ADX/DMS Study to gauge the robustness of a trend and make informed decisions on entry and exit points. A strong trend (ADX above 25) combined with +DI crossing above -DI may suggest a strong upward trend, suitable for a buying position. Conversely, a strong trend with -DI crossing above +DI may signal a strong downward trend, suitable for selling or shorting.