
 Discover Tab Reference Guide
 Discover Tab How-To Guide
 Smart Studies How-To Guide
 Smart Studies Reference Guide
 Scan Tab Reference Guide
 Scan Tab How-To Guide
 Watchlists How-To guide
 Watchlists Reference Guide
 Chatrooms Reference Guide
 Community Wall How-To Guide
 Community Wall Reference Guide
 Streams Reference Guide
 Streams How-To Guide
Bollinger %b
Definition
The Bollinger %b indicator measures where the latest price stands in relation to the Bollinger Bands. This percentage can range from less than 0 to greater than 100. A reading of 50% means the price is exactly at the middle moving average, often the 20-day moving average. A value less than 0 or greater than 100 indicates that the price has moved beyond the Bollinger Bands, which is considered a breakout signal.
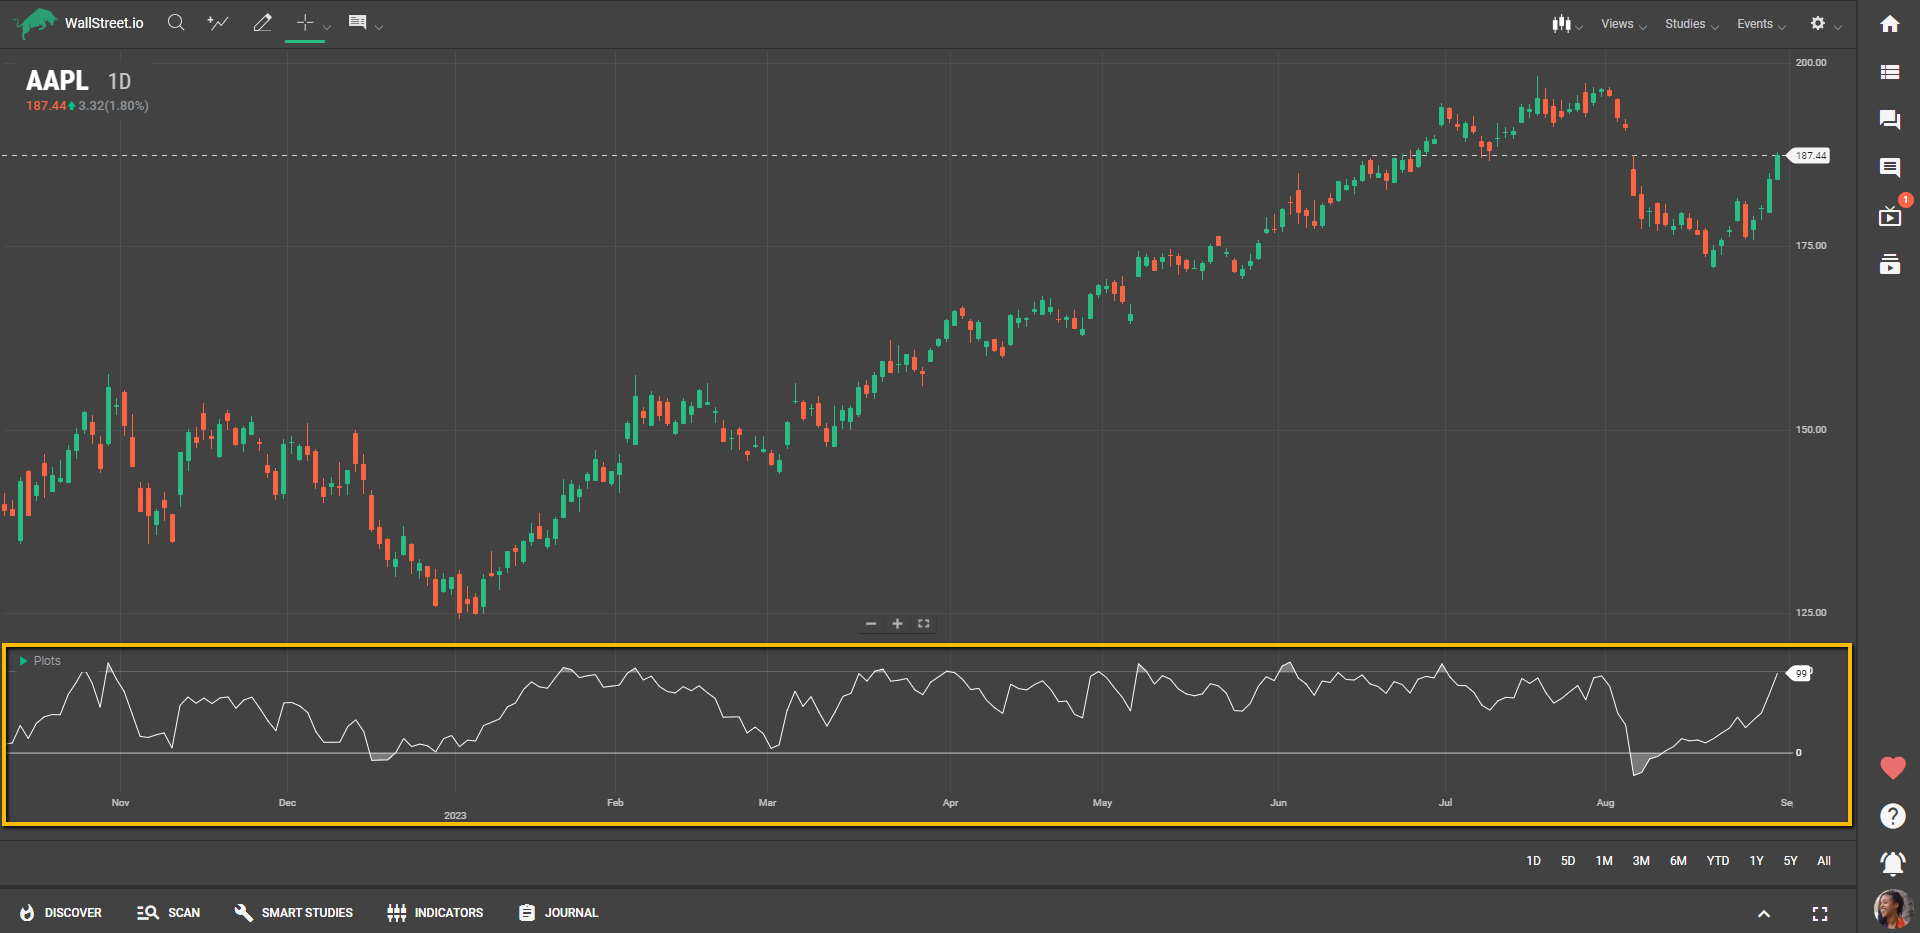
Suggested Trading Use
Bollinger %b is great for identifying overbought or oversold conditions in a security. If the %b value is above 80, the stock may be considered overbought and could be ready for a pullback. Conversely, if it's below 20, the stock may be oversold and could be ripe for a rebound.
The indicator is also helpful for spotting potential breakouts or breakdowns. A %b reading higher than 100 or lower than 0 indicates that the stock is performing exceptionally compared to its recent history, and a significant price movement might be imminent.
Additionally, traders can use Bollinger %b in conjunction with other indicators or studies to confirm signals. For instance, a %b reading corroborating a trend identified by another indicator can be a strong buy or sell signal.
Using Bollinger %b effectively allows traders to gauge volatility and price levels, making it a versatile tool in a trader's arsenal.