Definition
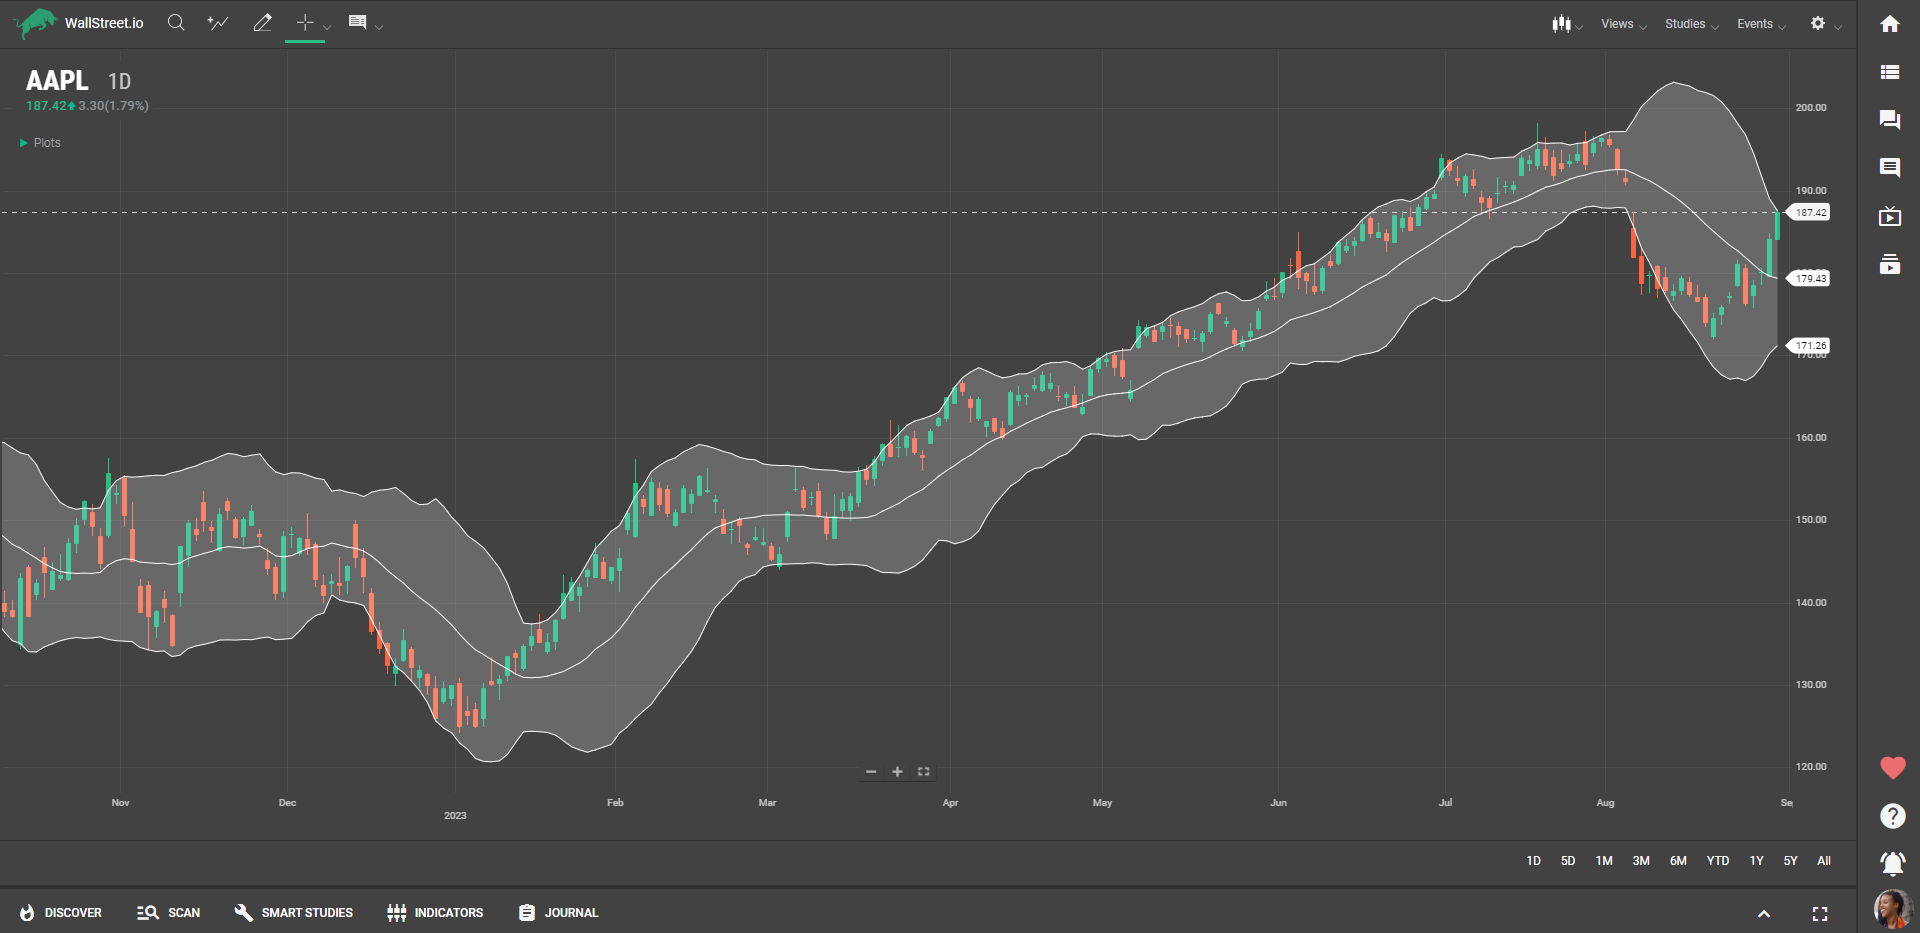
Bollinger Bands consist of a middle band, which is a moving average of a security's price, and two outer bands that are calculated based on standard deviations from this moving average. When the bands expand, it suggests an increase in market volatility, and when they contract, it indicates decreased volatility. The price of a security typically fluctuates within these bands.
Suggested Trading Use
Bollinger Bands are versatile and can be used in various ways for trading:
Spotting Overbought/Oversold Conditions: If the price is touching or moving outside the upper band, it could mean the stock is overbought. Conversely, if it's near or outside the lower band, the stock may be oversold.Identifying Breakouts: A price that moves outside of the Bollinger Bands can signal a significant price movement. Traders often use these potential breakouts as trading opportunities.Volatility Indication: The width of the bands can also be used to gauge market volatility. Widening bands suggest increasing volatility, while narrowing bands indicate decreasing volatility.Trend Following: In a strong uptrend, prices usually hover around the upper band, while in a downtrend, they tend to stay close to the lower band.Squeeze Patterns: When the bands come close together ("squeeze"), it can often be the precursor to a significant price move. A squeeze suggests that a breakout is imminent.

 Discover Tab Reference Guide
 Discover Tab How-To Guide
 Smart Studies How-To Guide
 Smart Studies Reference Guide
 Scan Tab Reference Guide
 Scan Tab How-To Guide
 Watchlists How-To guide
 Watchlists Reference Guide
 Chatrooms Reference Guide
 Community Wall How-To Guide
 Community Wall Reference Guide
 Streams Reference Guide
 Streams How-To Guide