Definition
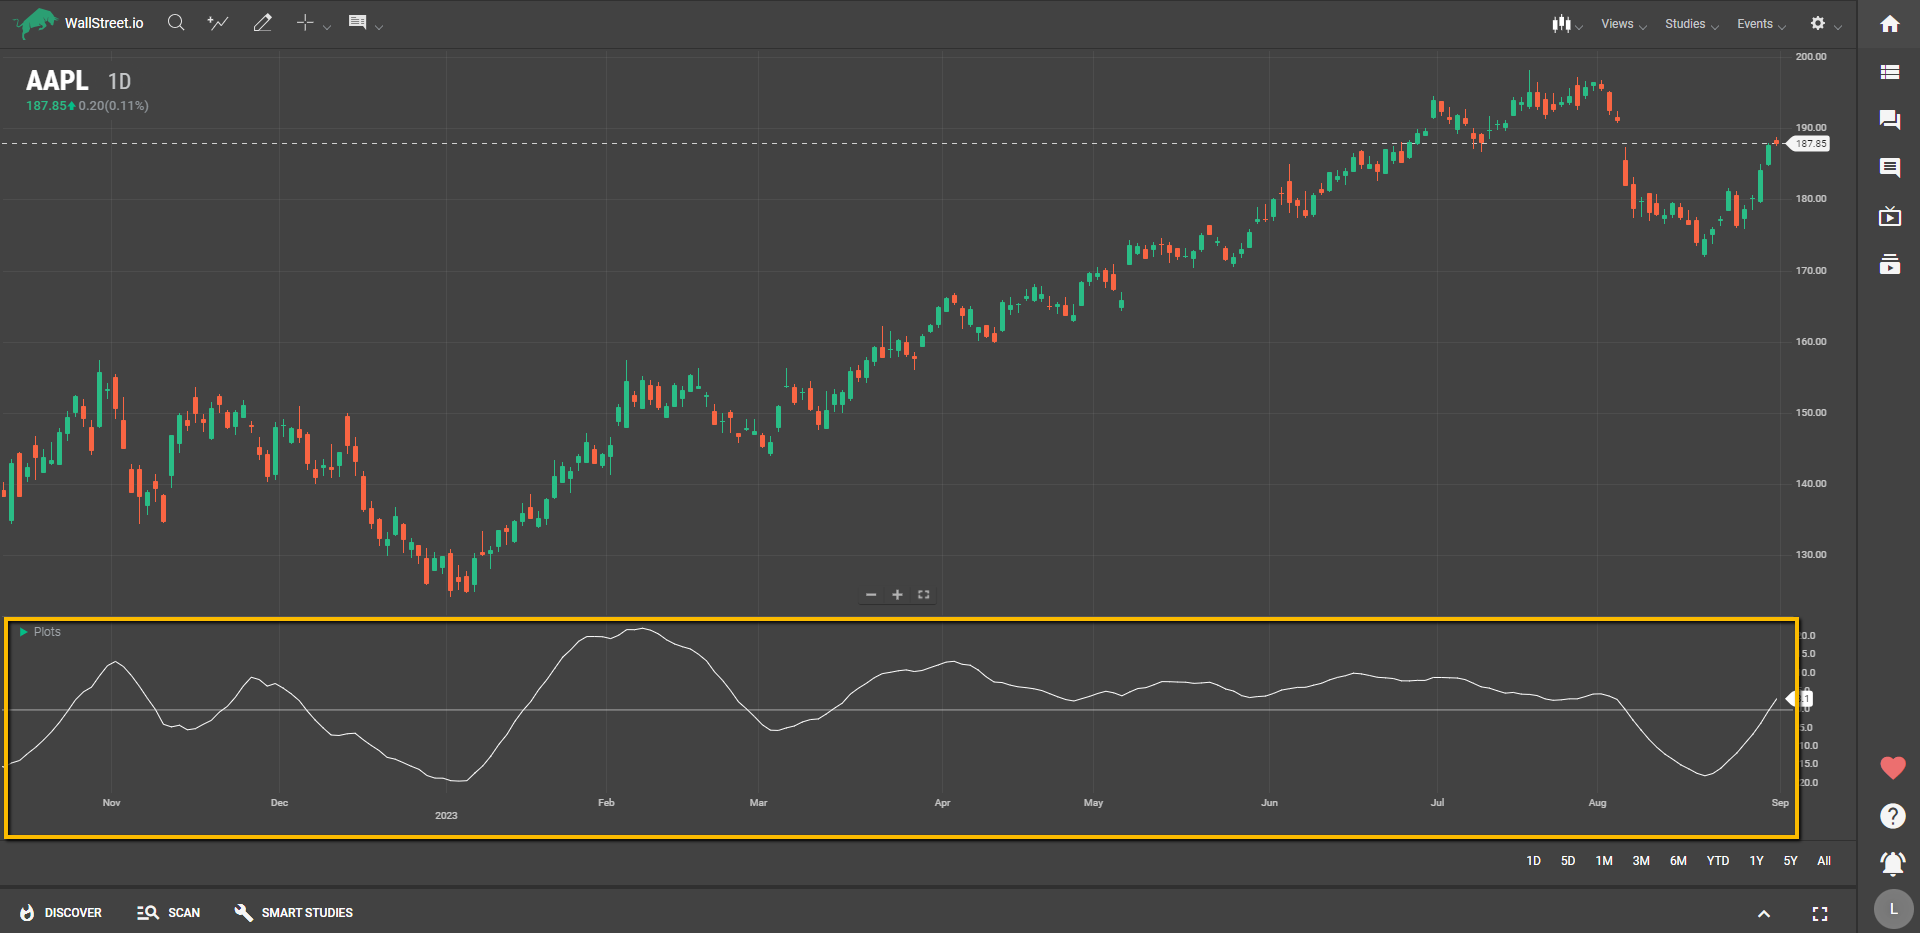
The Coppock Curve helps you gauge the long-term momentum of an asset by combining two different rates of change—one long-term and one short-term—and then applying a weighted moving average to this sum. The curve oscillates around a zero line, providing you with clues about market sentiment.
Suggested Trading Use
Here are some practical ways you can use the Coppock Curve in your trading strategy:
Identify Bullish Entry Points: When the Coppock Curve crosses above the zero line, it's often considered a bullish signal. This could be an opportune moment for you to consider entering a long position.Spot Market Bottoms: The Coppock Curve is particularly useful for identifying the end of a bear market or a substantial downward move. When you see the curve turning upwards from a low point, it could indicate that the market is recovering and a new upward trend might be forming.Combine with Other Studies: The Coppock Curve can be used in conjunction with other indicators to confirm signals. For example, if you see a bullish signal on the Coppock Curve, you might look for confirming signals on other long-term momentum or trend-following indicators.Avoid Whipsaws: Be cautious about overly rapid fluctuations in the Coppock Curve. These could be false signals and may not necessarily indicate a sustainable change in trend.Be Mindful of Trend Lengths: Since the Coppock Curve incorporates both long-term and short-term rates of change, it can offer a more comprehensive view of an asset's momentum. Make sure to factor in the lengths of these trends when interpreting the curve.The Coppock Curve can be a versatile tool, especially for those focused on long-term trading, helping you to spot potential trend reversals and entry points based on market momentum.

 Discover Tab Reference Guide
 Discover Tab How-To Guide
 Smart Studies How-To Guide
 Smart Studies Reference Guide
 Scan Tab Reference Guide
 Scan Tab How-To Guide
 Watchlists How-To guide
 Watchlists Reference Guide
 Chatrooms Reference Guide
 Community Wall How-To Guide
 Community Wall Reference Guide
 Streams Reference Guide
 Streams How-To Guide