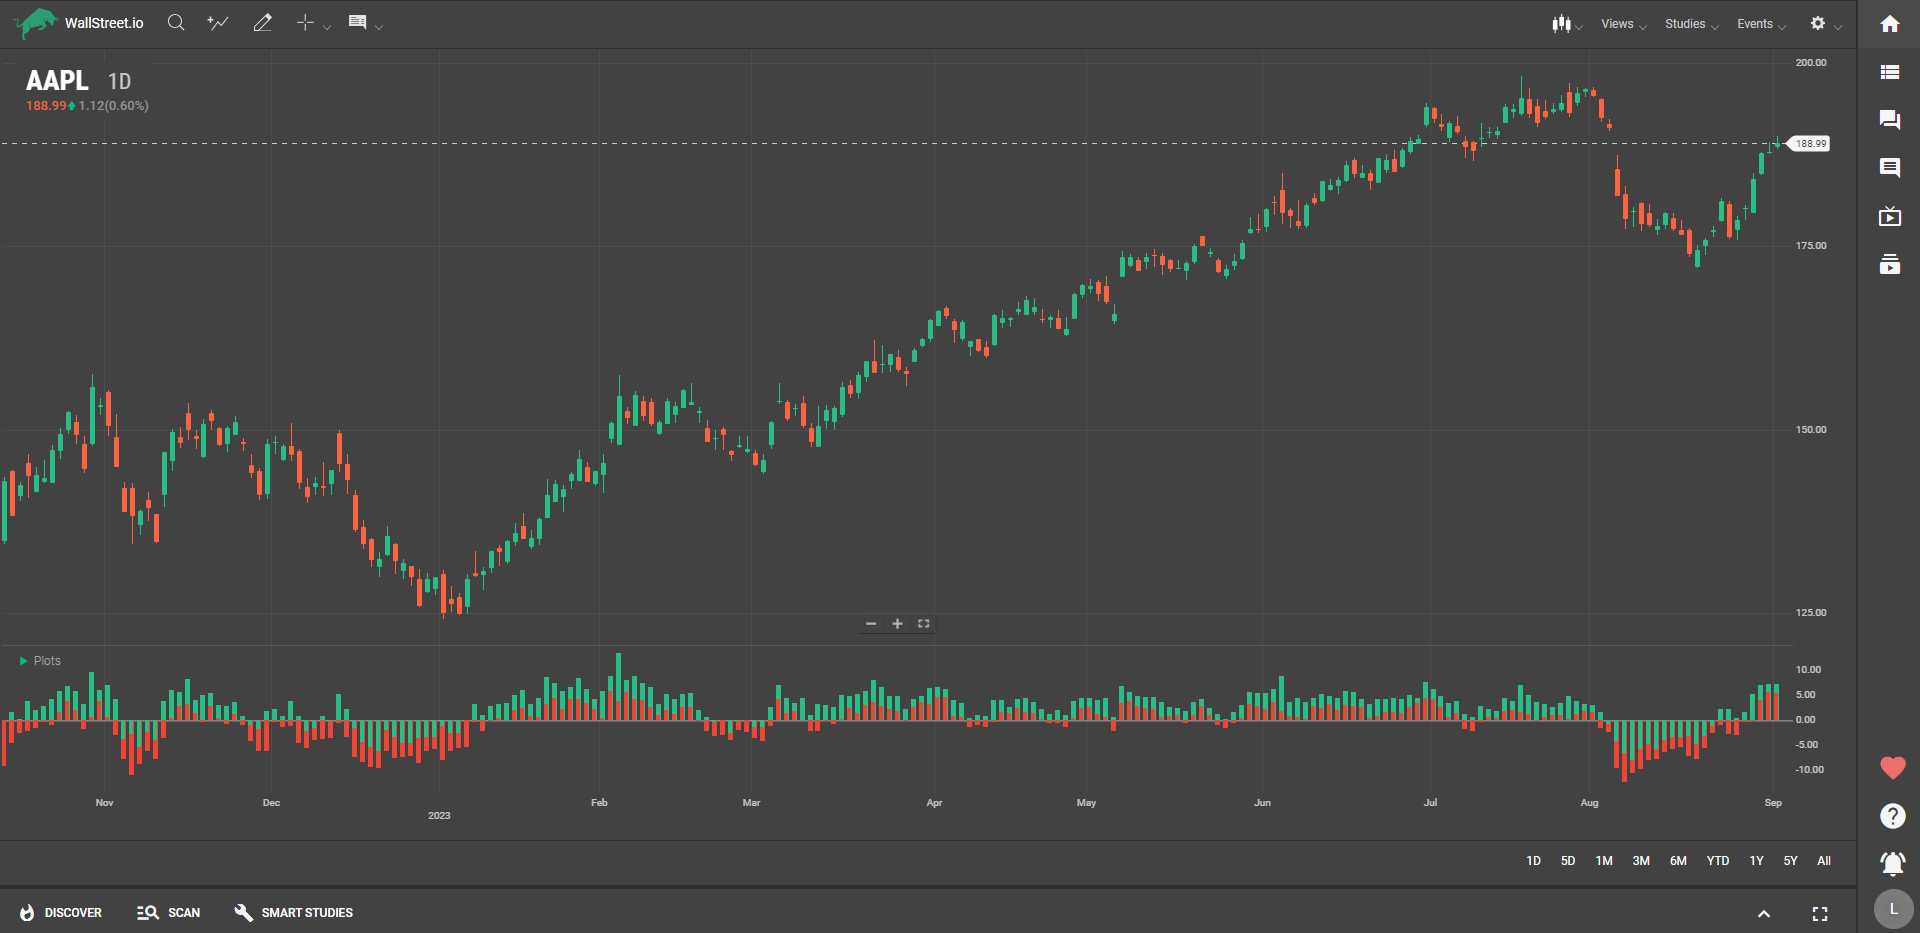
Elder Ray Index
Definition
The Elder Ray Index is a technical indicator that presents two histograms. These histograms measure how far the day's high and low prices are from an exponential moving average (EMA) of the asset's price. Because it's an unbounded oscillator, it doesn't have specific upper or lower limits, allowing for flexibility in interpretation.

Suggested Trading Use
When the histogram values for the high prices are increasing and are above the EMA, it usually indicates bullish strength. You might consider this a favorable moment for entering or maintaining a long position.
Conversely, when the histogram values for the low prices are decreasing and are below the EMA, it suggests bearish conditions. You could interpret this as a potential time to consider short positions or exercise caution with existing long positions.
The Elder Ray Index helps you understand the bullish or bearish pressure in relation to an EMA, offering a nuanced view of market sentiment. By keeping an eye on these histogram values in relation to the EMA, you can gain additional insights into market conditions.

 Discover Tab Reference Guide
 Discover Tab How-To Guide
 Smart Studies How-To Guide
 Smart Studies Reference Guide
 Scan Tab Reference Guide
 Scan Tab How-To Guide
 Watchlists How-To guide
 Watchlists Reference Guide
 Chatrooms Reference Guide
 Community Wall How-To Guide
 Community Wall Reference Guide
 Streams Reference Guide
 Streams How-To Guide