
 Discover Tab Reference Guide
 Discover Tab How-To Guide
 Smart Studies How-To Guide
 Smart Studies Reference Guide
 Scan Tab Reference Guide
 Scan Tab How-To Guide
 Watchlists How-To guide
 Watchlists Reference Guide
 Chatrooms Reference Guide
 Community Wall How-To Guide
 Community Wall Reference Guide
 Streams Reference Guide
 Streams How-To Guide
High Low Bands
Definition
High Low Bands are a visual tool on your chart that form a channel around a triangular moving average. These bands are plotted at a specific percentage or a set number of points both above and below the moving average, helping to identify potential overbought or oversold conditions.
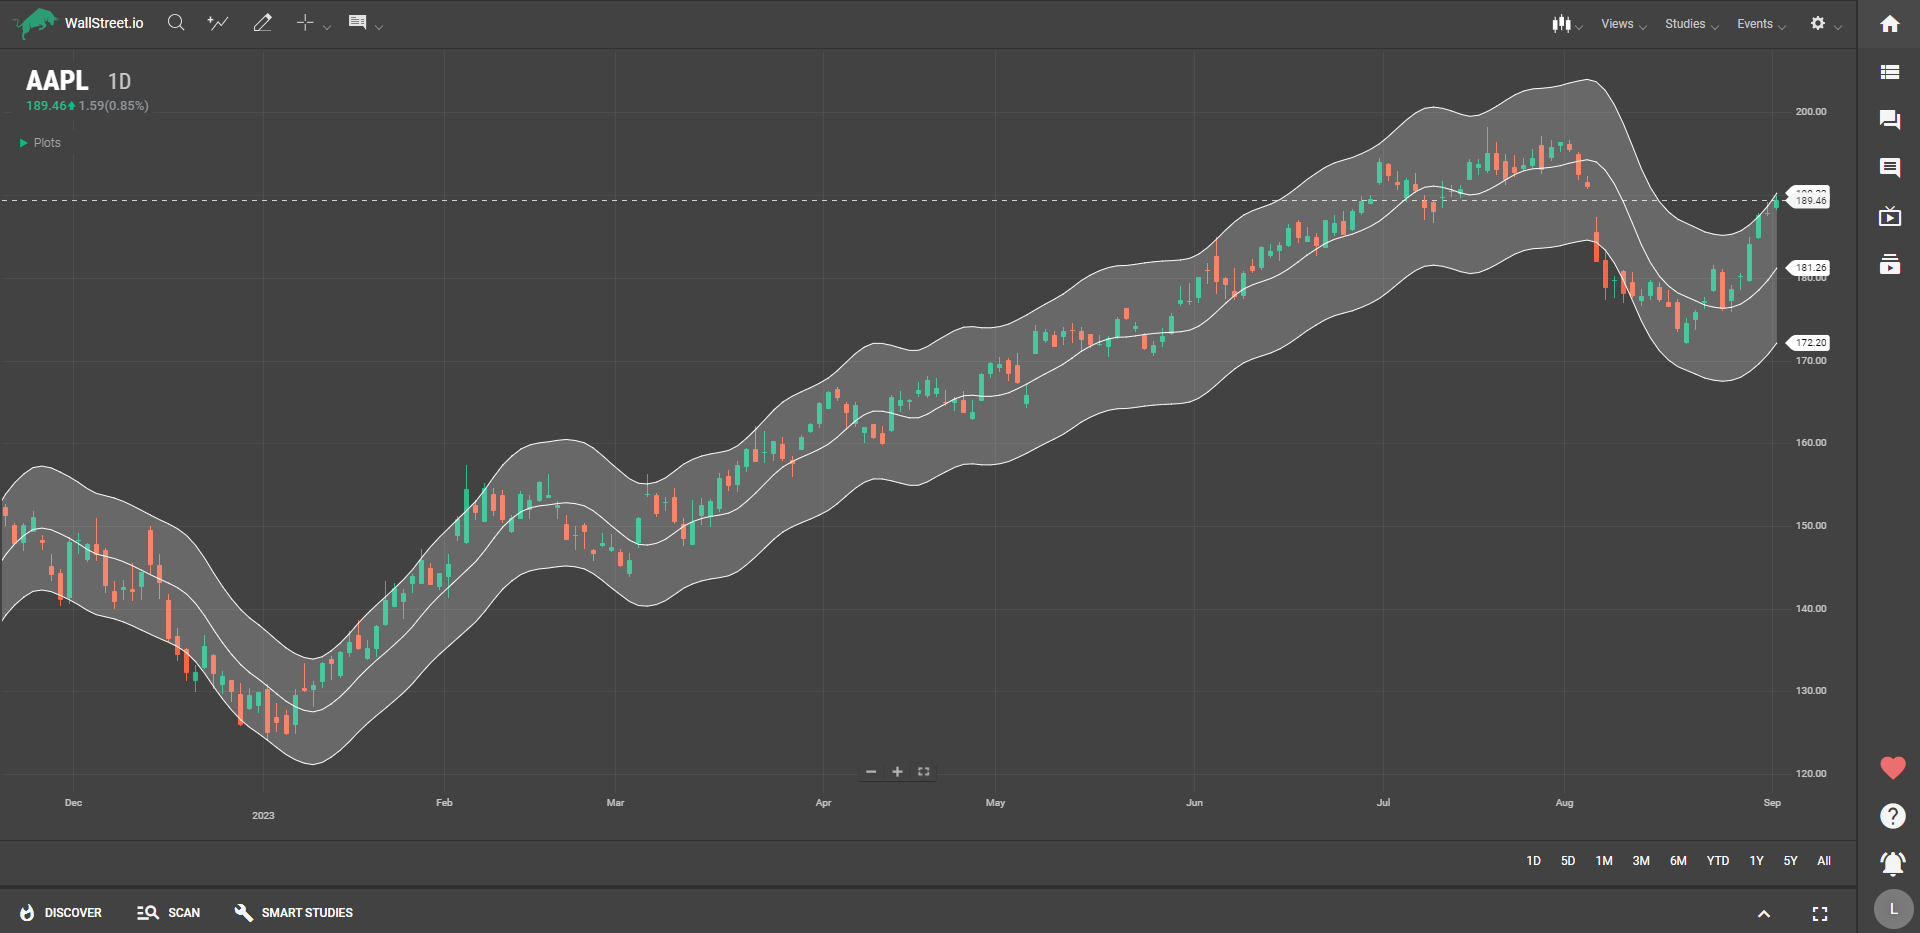
Suggested Trading Use
When the price of an asset approaches or crosses the upper band, it's often an indication that the asset may be overbought. In such a scenario, you could consider taking profits on existing long positions or look for short opportunities.
On the flip side, if the price approaches or breaches the lower band, the asset could be oversold, suggesting it might be a suitable time to consider buying or closing out short positions.