Klinger Volume Oscillator
Definition
The Klinger Volume Oscillator (KVO) is a trading indicator designed to measure the flow of money into and out of an asset on a short-term basis. It calculates volume with a positive or negative value based on changes in the Typical Price, which is the average of an asset's high, low, and closing prices. The KVO line is derived from the difference between long and short exponential moving averages of this directional volume. A Signal Line, which is an EMA of the KVO line, is also plotted to generate trading signals.
Suggested Trading Use
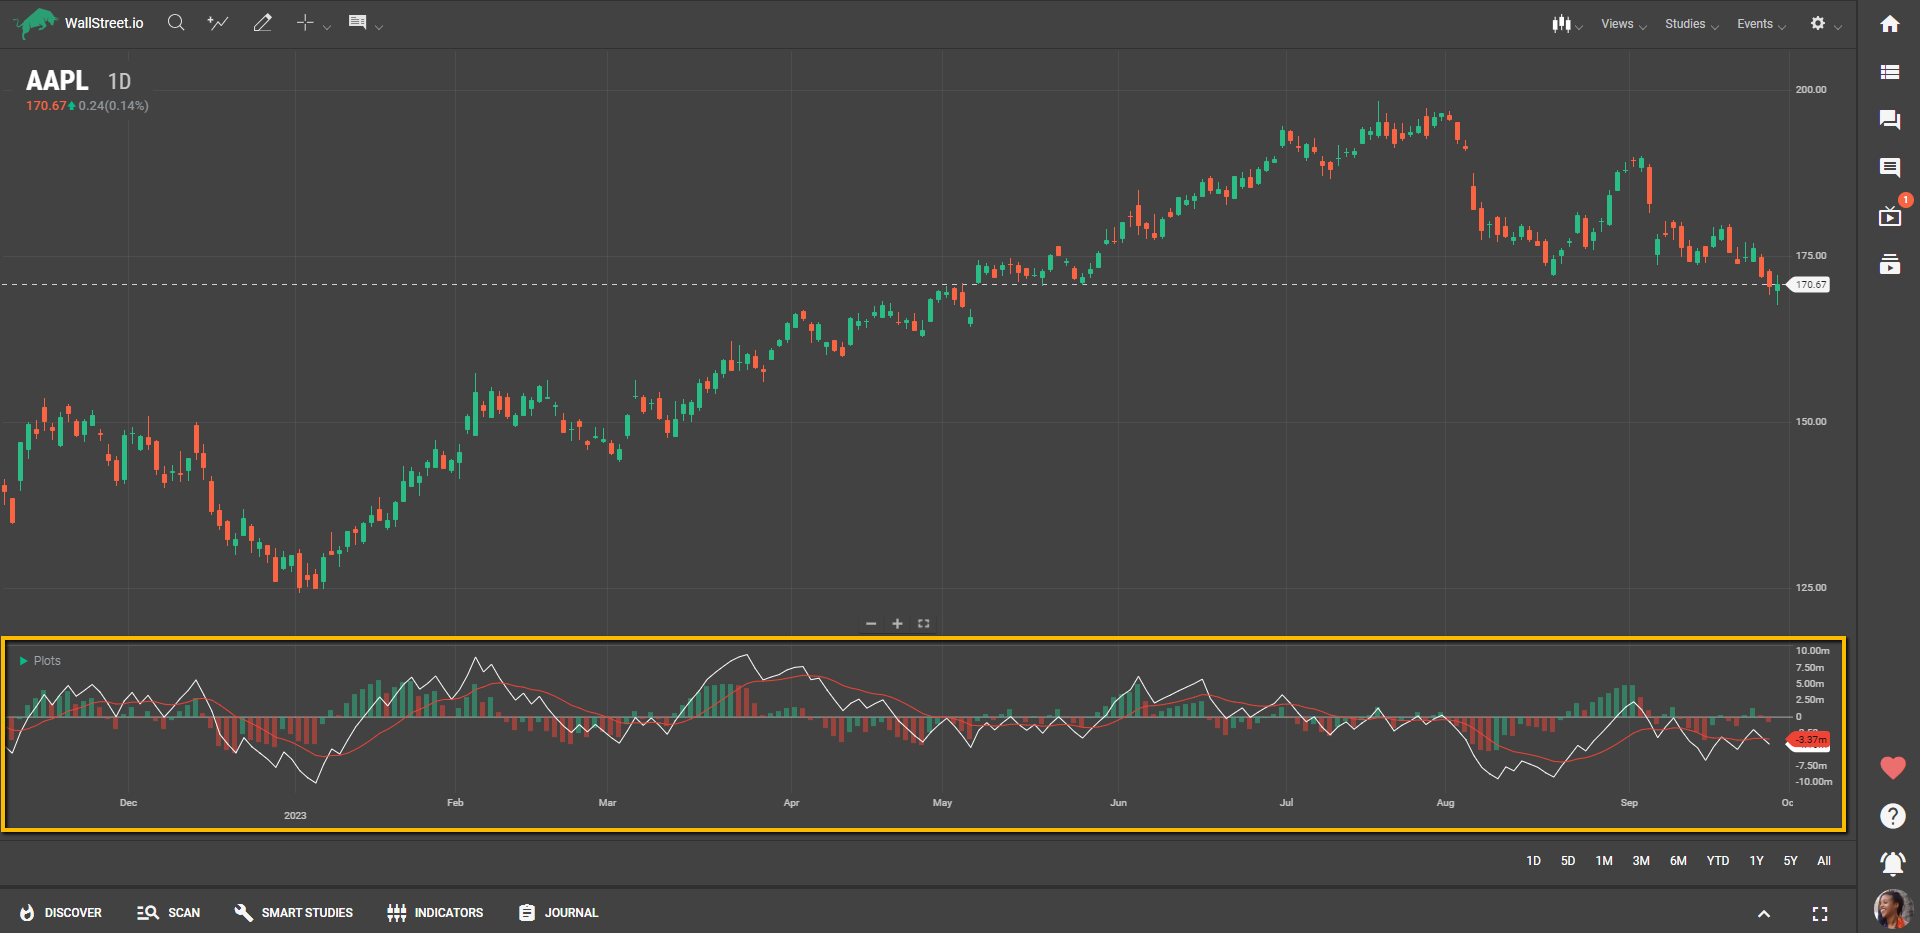
The Klinger Volume Oscillator can serve as a handy tool for identifying trend strength based on volume. When the KVO line crosses above the Signal Line, it could indicate that buying pressure is building up, and you may consider entering a long position. Conversely, when the KVO line crosses below the Signal Line, it might be a signal that selling pressure is increasing, and a short position could be warranted.
Keep an eye on the KVO Histogram as well; it changes color to reflect the direction of the KVO values. A green histogram typically suggests that the KVO values are rising, thus potentially validating an upward trend, while a red histogram indicates falling KVO values, which may support a downward trend.