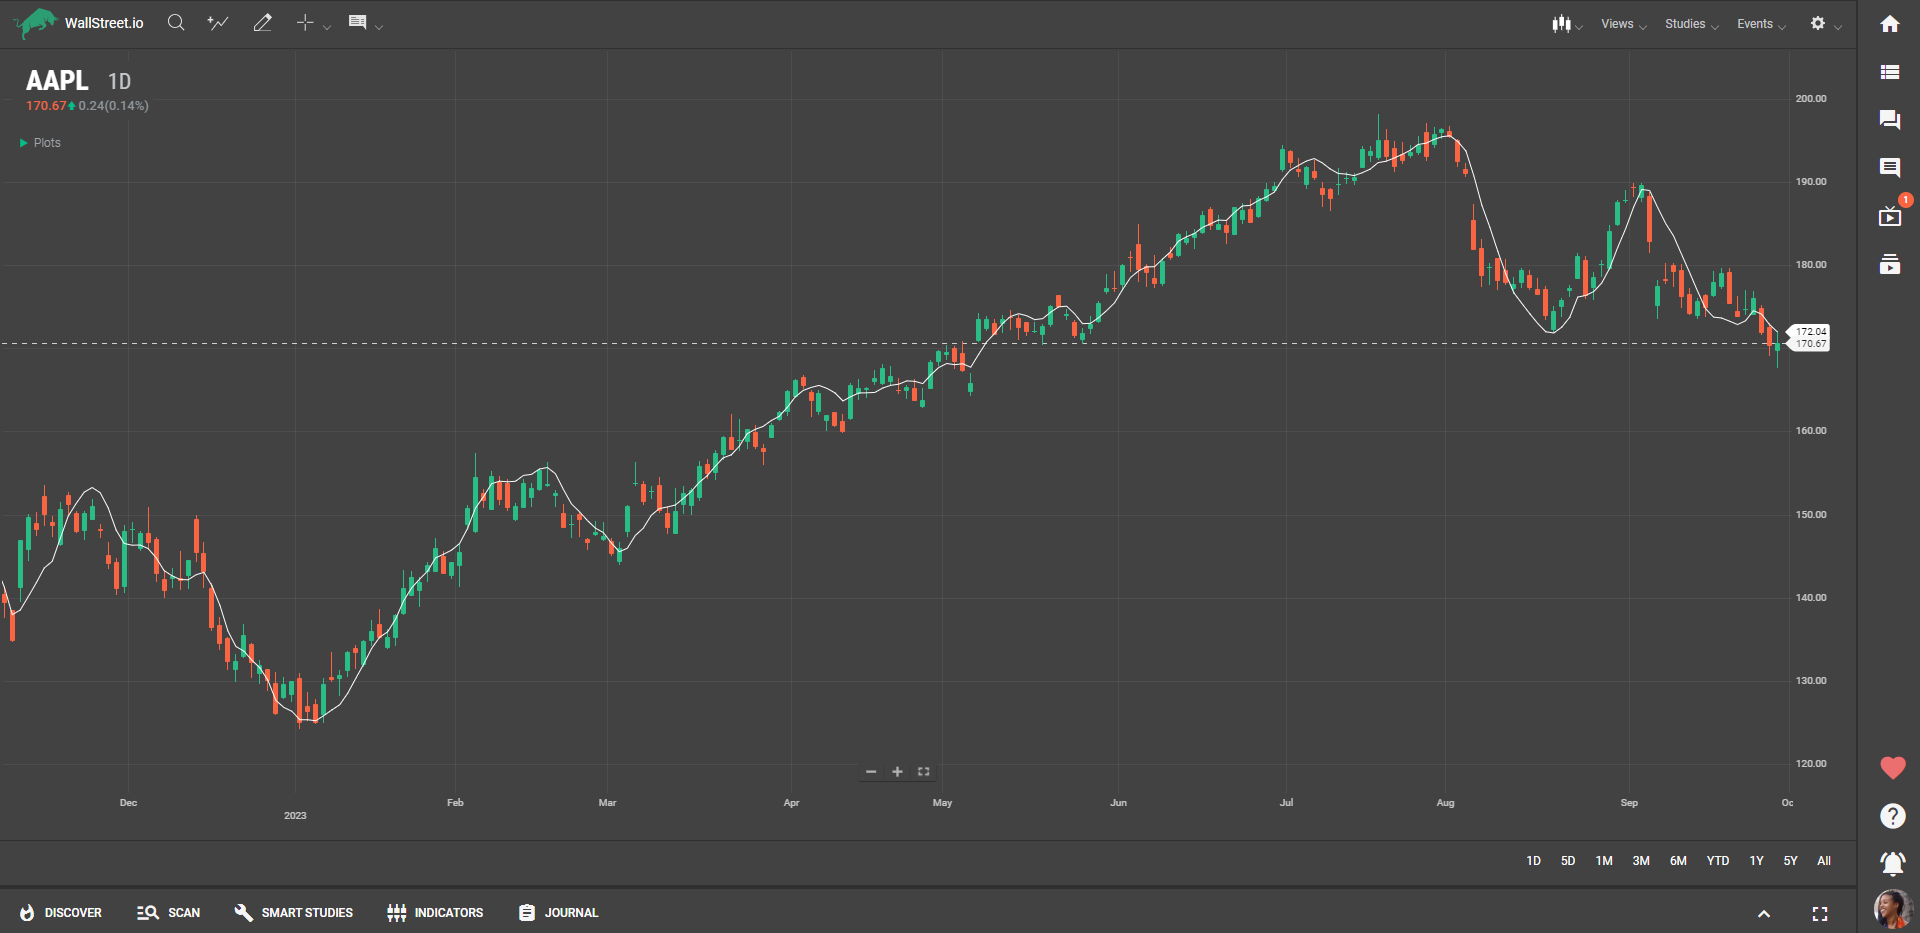
Linear Reg Forecast
Definition
The Linear Regression Forecast (LRF) is a trading study that calculates a straight line running through historical prices to project future price movement. It leverages the ordinary least squares method to find the line that minimizes the gap between this line and the actual prices. The "ordinary least squares method" is a statistical technique used to find the best-fitting straight line through a set of data points. In simple terms, it tries to draw a straight line that is as close as possible to all the data points on a chart. Imagine tossing a handful of pebbles onto a flat surface; this method would find the straight line that lies closest to all those pebbles, minimizing the distance from each pebble to the line. This line then serves as the basis for forecasting future values in the Linear Reg Forecast study. With this being said, think of the LRF drawing a straight path based on where the stock has been to get an idea of where it might go next.

Suggested Trading Use
When you're looking to understand the direction of a stock's price movement, the LRF can serve as a simple yet effective tool. This study not only highlights the trend but also provides you with a forecasted value, updated each trading period, that can guide your trading actions. Use the last point on the LRF line as a hint of where the market could head in the immediate future.
Note that this study can be customized to apply to other studies by adjusting the Field parameter, so you can get a broader or more focused view depending on your needs. Keep an eye on how the forecasted value changes; shifts could indicate that it might be time to adjust your trading strategy.

 Discover Tab Reference Guide
 Discover Tab How-To Guide
 Smart Studies How-To Guide
 Smart Studies Reference Guide
 Scan Tab Reference Guide
 Scan Tab How-To Guide
 Watchlists How-To guide
 Watchlists Reference Guide
 Chatrooms Reference Guide
 Community Wall How-To Guide
 Community Wall Reference Guide
 Streams Reference Guide
 Streams How-To Guide