Linear Reg R2
Definition
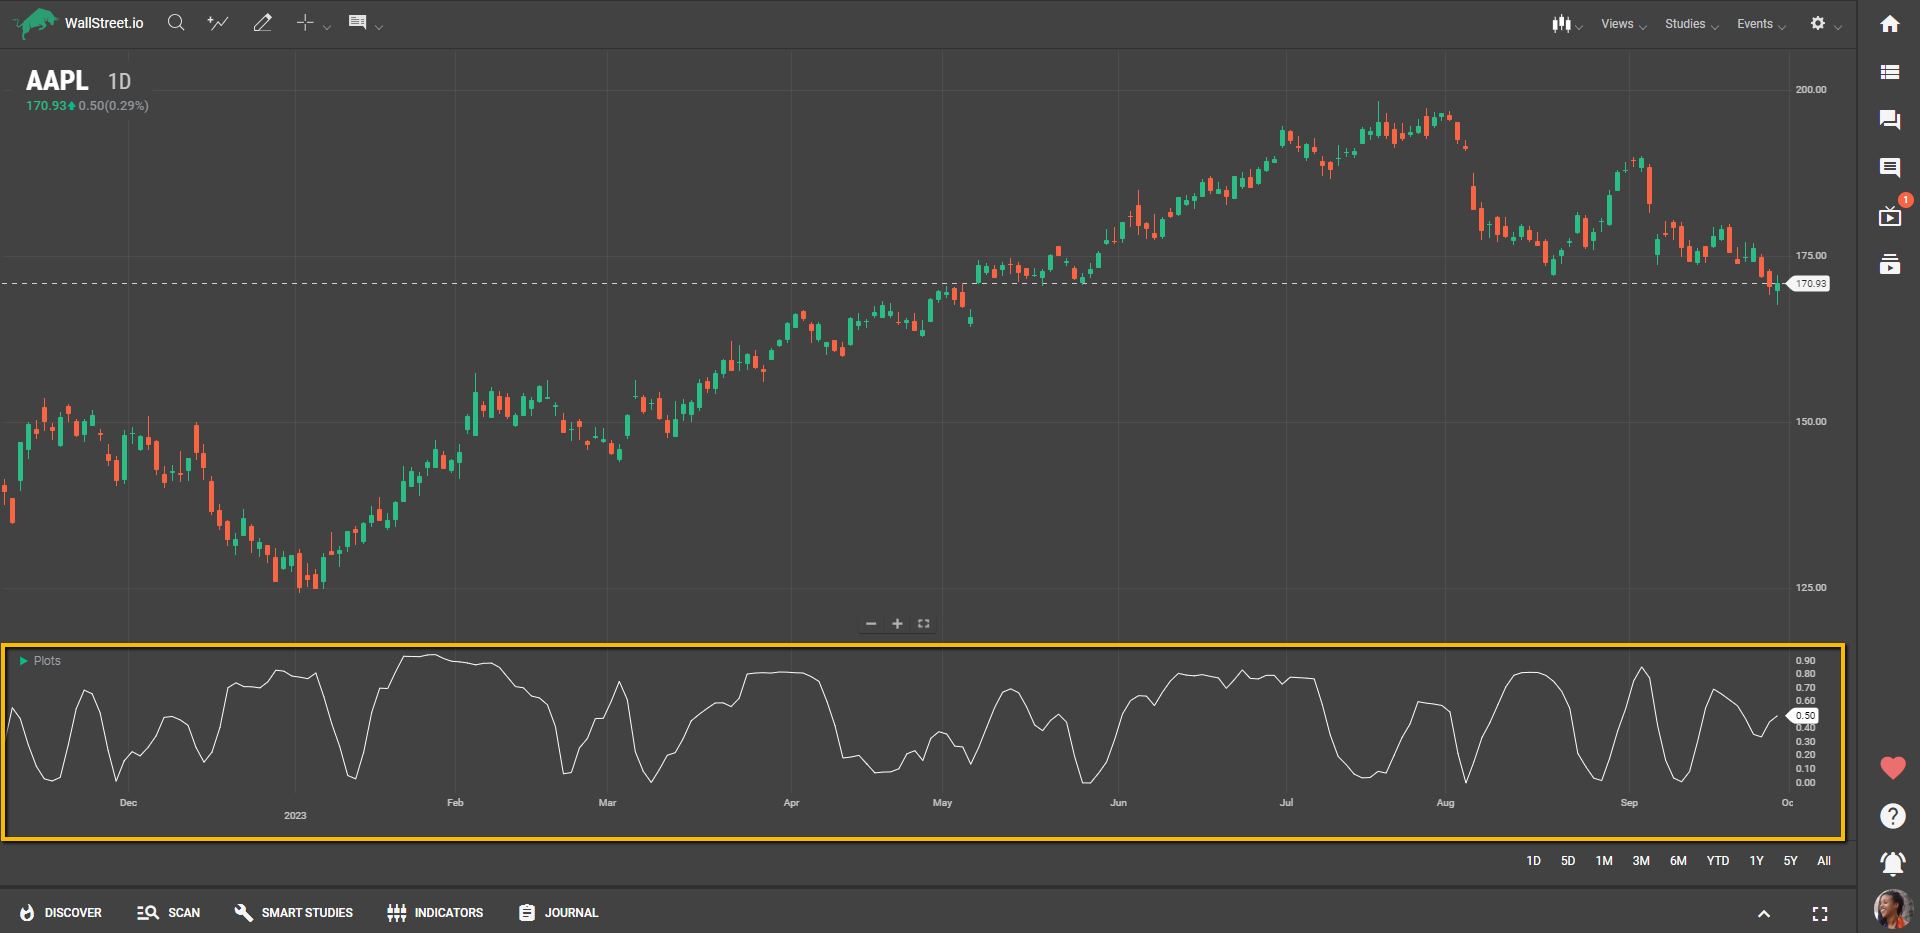
The Linear Regression R2 (LR-R2) is a specialized trading study that tells you how well the trendline fits the actual price data. It uses the same ordinary least squares method as other linear regression studies to create the trendline.
The "ordinary least squares method" is a statistical way to find the most accurate straight line that represents a trend by minimizing the distance from each data point to this line.
The LR-R2 generates an R-Squared value for each period, which acts as a gauge for the quality of the fit. In essence, it tells you how reliable the derived trendline is for forecasting future prices.
Suggested Trading Use
When you're trying to assess the reliability of a trend, turn your attention to the Linear Reg R2. The R-Squared value it provides is a good indicator of how accurately the trendline reflects the actual market data. Higher R2 values signify a better-quality fit, and thus, increased confidence in your use of trend-based strategies.
This study is also versatile; you can apply it to other studies by adjusting the Field parameter. If you're already using the Linear Regression Forecast (LR-Forecast) in your analysis, consider pairing it with the LR-R2. The R-Squared values can offer additional confidence in the forecasted trends, helping you to navigate the market with greater clarity.